Article Text

Abstract
Background and objectives Renal histological injury patterns in type 2 diabetes are heterogeneous. We compared renal histological injury patterns using renal biopsy findings with renal function and followed up renal functional changes in normoalbuminuric and microalbuminuric patients with type 2 diabetes to determine whether renal function progresses according to injury patterns.
Design, setting, participants, and measurements We examined 111 patients with type 2 diabetes with percutaneous renal biopsy (78 men, 52±11 years old, 59 normoalbuminuria, 52 microalbuminuria) and followed up 37 cases for 11 years. Light microscopy of tissues revealed renal injury patterns as: category I (CI), normal or near-normal structure; category II (CII), typical diabetic glomerulopathy; category III (CIII), atypical (disproportionately severe tubulointerstitial/vascular damage with no/mild glomerulopathy).
Results There were 29 CI, 62 CII, and 20 CIII patients. CII patients had a higher frequency of chronic kidney disease (CKD) G3-4, while the injury pattern distribution was not different among the albuminuria stages. The mean glomerular volume and volume fraction of cortical interstitium were larger than those of controls. The arteriolar hyalinosis index was larger in CII and CIII, while the percent global glomerular sclerosis was larger in CKD G3-4 compared with CKD G1-2. Renal function at follow-up was decreased in CII and CIII compared with the baseline estimated glomerular filtration rate (eGFR), while the GFR decline rate was faster in CII.
Conclusions In normoalbuminuric and microalbuminuric patients with type 2 diabetes, loss of GFR could indicate typical diabetic glomerulosclerosis and a high frequency of global glomerular sclerosis. Urinary biomarkers identifying histological patterns of renal injury are necessary because GFR decline rates differed according to histological injury patterns.
- Glomerular Structure
- Nephropathy
- Pathology
This is an Open Access article distributed in accordance with the Creative Commons Attribution Non Commercial (CC BY-NC 4.0) license, which permits others to distribute, remix, adapt, build upon this work non-commercially, and license their derivative works on different terms, provided the original work is properly cited and the use is non-commercial. See: http://creativecommons.org/licenses/by-nc/4.0/
Statistics from Altmetric.com
Key messages
-
In normoalbuminuric and microabuminuric patients with type 2 diabetes, renal histological injury pattern was heterogeneous, and was related to chronic kidney disease (CKD) stages, but not albuminuria categories.
-
The patients with typical diabetic glomerulosclerosis showed renal functional decline during the 11 years of observation.
-
Therefore, urinary biomarkers identifying histological patterns of renal injury are necessary because GFR decline rates differed according to histological injury patterns.
Introduction
It is still difficult to detect patients who are susceptible to having or progressing to diabetic nephropathy, especially in patients who have type 2 diabetes, because we do not have accurate biomarkers to identify the risk of diabetic nephropathy. Microalbuminuria has been a risk factor resulting in macroalbuminuria in patients who have either type 1 or type 2 diabetes.1–3 In addition, some patients with microalbuminuria showed a rapid decline in the glomerular filtration rate (GFR) in Caucasian patients with type 1 diabetes.4 However, all microalbuminuric or macroalbuminuric patients do not necessarily have diabetic glomerulosclerosis or result in end-stage kidney disease after a long duration.5 In addition, recent studies6–11 have shown that most of the microalbuminuric patients with types 1 and 2 diabetes remained stable or reverted to normoalbuminuria despite using renin angiotensin aldosterone blockade, which indicated that microalbuminuria was not necessarily an accurate biomarker of the progression of diabetic nephropathy.
In the histological aspect of patients with type 1 diabetes, urinary albumin excretion increases in parallel with mesangial expansion.12–14 However, there were more striking phenomenon that the severity of glomerular lesions including mesangial expansion and glomerular basement membrane (GBM) thickening, were overlapped between normoalbuminuric, microalbuminuric, and macroalbuminuric patients with type 1 diabetes,14 as in normoalbuminuric and microalbuminuric patients with type 2 diabetes.15 From these reports, GBM thickening was seen in almost all patients with types 1 and 2 diabetes, while mesangial expansion was within normal range in some normoalbuminuric and microalbuminuric patients.14–16 In addition, a recent report showed that GBM thickening was a risk factor for development of macroalbuminuria or end-stage kidney disease in patients with type 1 diabetes.17 GBM thickening and mesangial expansion predicted albuminuria increase after 6-year follow-up of Japanese patients with type 2 diabetes,18 although renal structural–functional relationships were not present at the early stage of diabetic nephropathy in type 2 diabetes.15
Regarding renal function course in patients with type 2 diabetes, one previous report19 showed that GBM thickening and mesangial expansion predicted GFR decline in 108 microalbuminuric and macroalbuminuric patients using research-related biopsies. However, the report also revealed that there were progressors and non-progressors of GFR decline in each quartile of GBM thickening and mesangial expansion degrees, and that the changes in GFR were heterogeneous in these patients. Moreover, there have been few studies that compared renal biopsy findings with renal functional changes, wide ranges of GFR, or different degrees of albuminuria, especially in normoalbuminuria and microalbuminuria in patients with type 2 diabetes.
It has been shown that glomerular lesions of diabetic nephropathy, including GBM thickening and mesangial expansion, are more heterogeneous in patients with type 2 diabetes than in type 1.20–22 A previous study showed that there were three different patterns of renal histological injury in microalbuminuric Caucasian patients with type 2 diabetes,23 indicating that atypical patterns of renal injury are not rare in patients with type 2 diabetes. That study also suggested that typical diabetic glomerulosclerosis was related to poor glycemic control, lesser body mass index, and the presence of preproliferative or proliferative diabetic retinopathy.23 Therefore, we conducted the present study to evaluate renal structural–functional relationships and identify individuals who would be susceptible to renal function progress according to the renal histological injury patterns evaluated from renal biopsy findings in Japanese patients with type 2 diabetes.
Materials and methods
Patients with type 2 diabetes
Patients with normotensive type 2 diabetes without macroalbuminuria, hematuria, or renal dysfunction and patients without any evidence, suggesting atherosclerotic diseases, were recruited at the outpatient clinics of Akita University, Nara University, Niigata University, and Kitasato University Hospitals in Japan. Some cases in the Kitasato University were used for parts of the previous studies,15 ,18 ,24 and patients were excluded whose biopsies were performed because of a clinical indication from the previous study. All biopsies were performed for research purposes in the other three universities. In addition, we excluded patients: receiving antihypertensive drugs; with a history of any malignant, cerebrovascular, or cardiovascular diseases; or those with recurrent infections. Patients were fully informed about the renal biopsy, and 132 Japanese patients with type 2 diabetes, who consented to participate, received percutaneous renal biopsies at the four university hospitals. We excluded 21 patients with incomplete renal biopsy samples to determine the histological categorizations described below. The remaining 111 patients showed no evidence of non-diabetic renal glomerular changes (table 1).
Demographic data and clinical characteristics of all patients with type 2 diabetes
There were 33 women and 78 men (52±11 years) with a known diabetic duration of 10±7 years. The normoalbuminuria was defined as an albumin/creatinine ratio (ACR) less than 30 mg/gCr where microalbuminuria was defined as an ACR between 30 and 300 mg/gCr using spot urine samples at the outpatient clinics in each institute. Clinical examinations were performed along with the renal biopsies.
Normal control participants
The renal biopsy reference values of normal controls were obtained from nine living renal transplant donors (2 men, 7 women; age 51±8 years) 1 h after transplantation as described.15 ,24 All nine participants showed normal 75 g oral glucose tolerance test results, negative dipstick proteinuria, and normal blood pressure (BP).
Laboratory and clinical measurements
Glycated hemoglobin (HbA1c) was measured by high-performance liquid chromatography. The value for HbA1c (%) was estimated as a National Glycohemoglobin Standardization Program (NGSP) equivalent value (%) calculated by the formula HbA1c (%)=HbA1c (the Japan Diabetes Society; JDS) (%)+0.4%, considering the relational expression of HbA1c (JDS) (%) measured by the previous Japanese standard substance and measurement methods and HbA1c (NGSP)25 followed by conversion to HbA1c (the International Federation of Clinical Chemistry). Spot urinary ACR was also determined at least twice a year using the turbidimetric immunoassay to measure the urinary albumin concentration. Serum and urinary creatinine levels were also determined using an enzyme method to calculate creatinine clearance. Since creatinine clearance (Ccr) overestimates real GFR, we used corrected Ccr derived from the formula: Corrected Ccr=Ccr×0.715.26
To evaluate clinical features and histological findings in normoalbuminuric and microalbuminuric patients with renal dysfunction, patients were divided into two groups: chronic kidney disease (CKD) G3-4, corrected Ccr<60 mL/min (n=26); and CKD G1-2, corrected Ccr≥60 mL/min (n=85) according to the GFR categories in CKD in the KDIGO 2012 Clinical Practice Guideline.27 Estimated GFR (eGFR) was calculated using serum creatinine levels and ages according to the MDRD (Modification of Diet in Renal Disease) formula modified for the Japanese population.26 BP was measured during the initial hospitalization and at the outpatient visits. Hypertension was defined as systolic BP (SBP) ≥130 mm Hg, diastolic BP (DBP) ≥85 mm Hg, and/or patients receiving treatment with antihypertensive drugs.
Morphometric analysis of renal biopsies
For light microscopic (LM) morphometric analysis, renal biopsy tissues from patients with diabetes and controls were fixed in 10% buffered formalin and stained with periodic acid-Schiff stain. The mean glomerular volume (MGV) was determined on the LM sections at an approximate magnification of ×150 using the point counting method of Weibel and Gomez.28 Percent global glomerular sclerosis (%GS) was measured as described previously.29 At least 15 glomerular profiles (24±10, mean±SD) for each patient were measured for MGV and %GS. Interstitial volume fraction (Vv(Int/cortex)) was determined on the LM sections at an approximate magnification of ×300 by point-counting images projected onto a white surface with a projection microscope.30 The index of arteriolar hyalinosis (IAH) was obtained by the estimation of the fraction of each arteriolar wall replaced by hyaline in one complete LM section.31
The renal injury patterns of the LM tissues are categorized according to the previous study by Fioretto et al23 as follows.
-
Category I (CI): normal or near-normal renal structure. These patients had biopsies that were normal or showed very mild mesangial expansion, tubulointerstitial changes, or arteriolar hyalinosis in any combination.
-
Category II (CII): typical diabetic glomerulopathy with parallel changes in the tubulointerstitium and vessels. These patients had established diabetic lesions with balanced severity of glomerular, tubulointerstitial, and arteriolar changes.
-
Category III (CIII): atypical injury patterns, absent or mild diabetic glomerulopathy associated with disproportionately severe tubulointerstitial injury, and/or arteriolar hyalinosis, and/or global glomerular sclerosis including: (A) tubular atrophy, tubular basement membrane thickening and reduplication, and interstitial fibrosis (tubulointerstitial lesions); (B) advanced glomerular arteriolar hyalinosis commonly associated with atherosclerosis of larger vessels; and (C) global glomerular sclerosis (>25%) in the presence of absent or mild mesangial expansion.
Categorization was performed by four observers (TM, Sonomi Wakakura, Akinori Hayashi, and Shinichiro Okizaki), who were unaware of the patients’ identities.
The follow-up study
We followed up 37 of the 111 patients for 10.7±4.6 (3.8–20.5) years and measured urinary ACR and eGFR at the baseline and the final observation at the Kitasato University Hospital. These clinical parameters were compared with the histological categories and morphometry. During the follow-up period, patients developing hypertension were prescribed antihypertensives to achieve optimal BP control (under 130/80 mm Hg). The baseline data of these 37 patients followed up were compared with those of the 74 other patients who were not followed up, and gender, proportion of albuminuria type, corrected Ccr, and proportion of CKD G1-2/CKD G3-4, SBP, DBP, HbA1c, %GS, or IAH were not significantly different between the two groups. Age (48±9, 54±11, p<0.01), proportion of histological injury pattern (CI/CII/CIII; 12/14/11, 17/48/9, p<0.05), MGV (3.03±0.86, 2.58±0.98, p<0.05), or Vv(Int/cortex) (0.19±0.04, 0.14±0.05 p<0.05) was significantly different between the cases that were followed up and those that were not.
Statistical analysis
Data are presented as mean±SD. Relationships between renal structure and function were analyzed using regression analysis. Three or more group comparisons were performed using one-way analysis of variance followed by the Tukey-Kramer post hoc test. Frequency among two or three groups was tested using the χ2 analysis. Two-group comparisons (eg, normoalbuminuria vs microalbuminuria) were performed using the t test or non-parametric test. All p values were two-sided, and the significance level was 0.05. All statistical analyses and data management were conducted using JMP V.10 (SAS Institute Inc, Cary, North Carolina, USA).
Results
Regarding the baseline demographic data and clinical characteristics between the three histological categories, there were 29 CI, 62 CII, and 20 CIII patterns among all the patients (table 2).
Demographic data and clinical characteristics of patients divided into three renal structural categories
Age, gender, known duration of diabetes, HbA1c, BP, and Ccr or corrected Ccr were not significantly different among the three groups at the baseline. Analysis of the distribution of renal histological injury patterns revealed that there were 18 CI, 30 CII, and 11 CIII patterns in normoalbuminuric patients and 11 CI, 32 CII, and 9 CIII patterns in microalbuminuric patients. The distribution of injury patterns was not significantly different between the albuminuria stages (χ2, NS). Also, there were 1 CI, 20 CII, and 5 CIII patterns among the CKD G3-4 patients and 28 CI, 42 CII, and 15 CIII patterns among the CKD G1-2 patients. The CII patients had a higher frequency of CKD G3-4 among the three categories (χ2, p<0.05).
The relationships between morphometry and histological injury patterns
MGV was significantly larger than normal control values (p<0.001) with no differences among the three histological categories. Vv(Int/cortex) values were significantly larger than normal control values (p<0.001), and CIII patients had significantly larger Vv(Int/cortex) values than did CI patients (p<0.01). %GS was not different among the three groups and normal controls (table 3).
Morphometric analysis of patients divided into three renal structural categories
However, the IAH was significantly different among the three groups, and the IAH values in the CII and CIII groups were significantly larger than that in the CI group (figure 1).
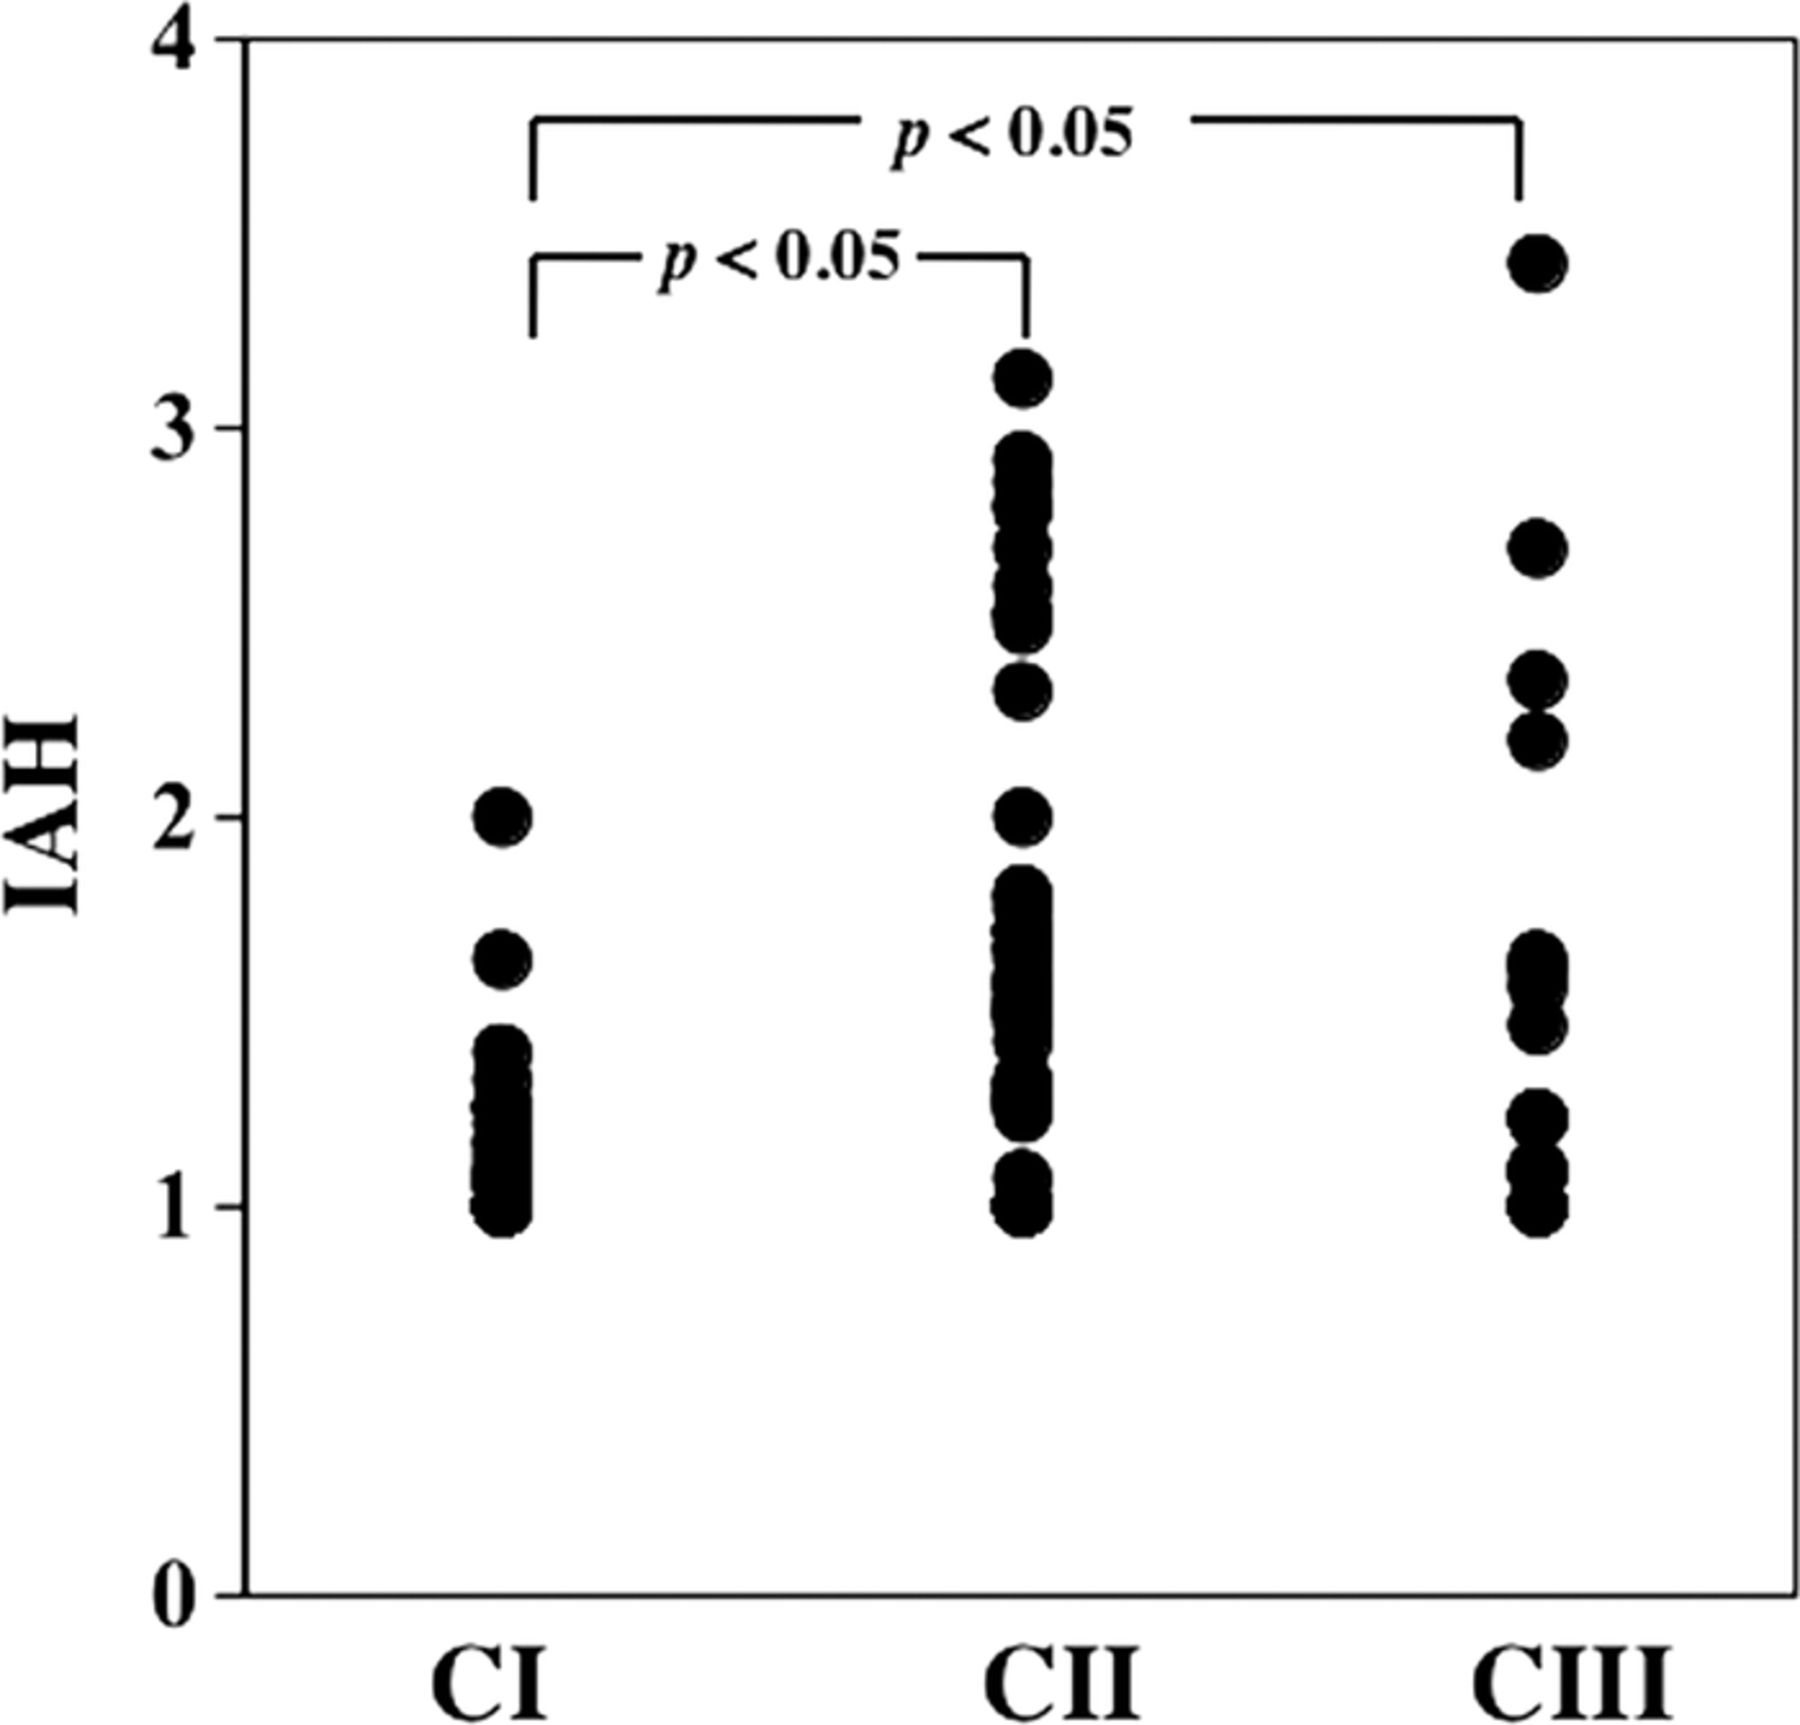
Index of arteriolar hyalinosis (IAH) among the three groups. IAHs in the category II (CII) (1.64±0.61) and category III (CIII) (1.52±0.68) groups were significantly larger than in the category I (CI) group (1.15±0.23) (p<0.05 for both).
Renal structural–functional relationships
In addition, the IAH in microalbuminuric patients was significantly higher than that in normoalbuminuric patients (table 4), and %GS was significantly larger in the CKD G3-4 group compared with that in the CKD G1-2 group (table 5).
Morphometric analysis between the normoalbuminuria and microalbuminuria groups
Morphometric analysis between the CKD G3-4 and CKD G1-2 groups
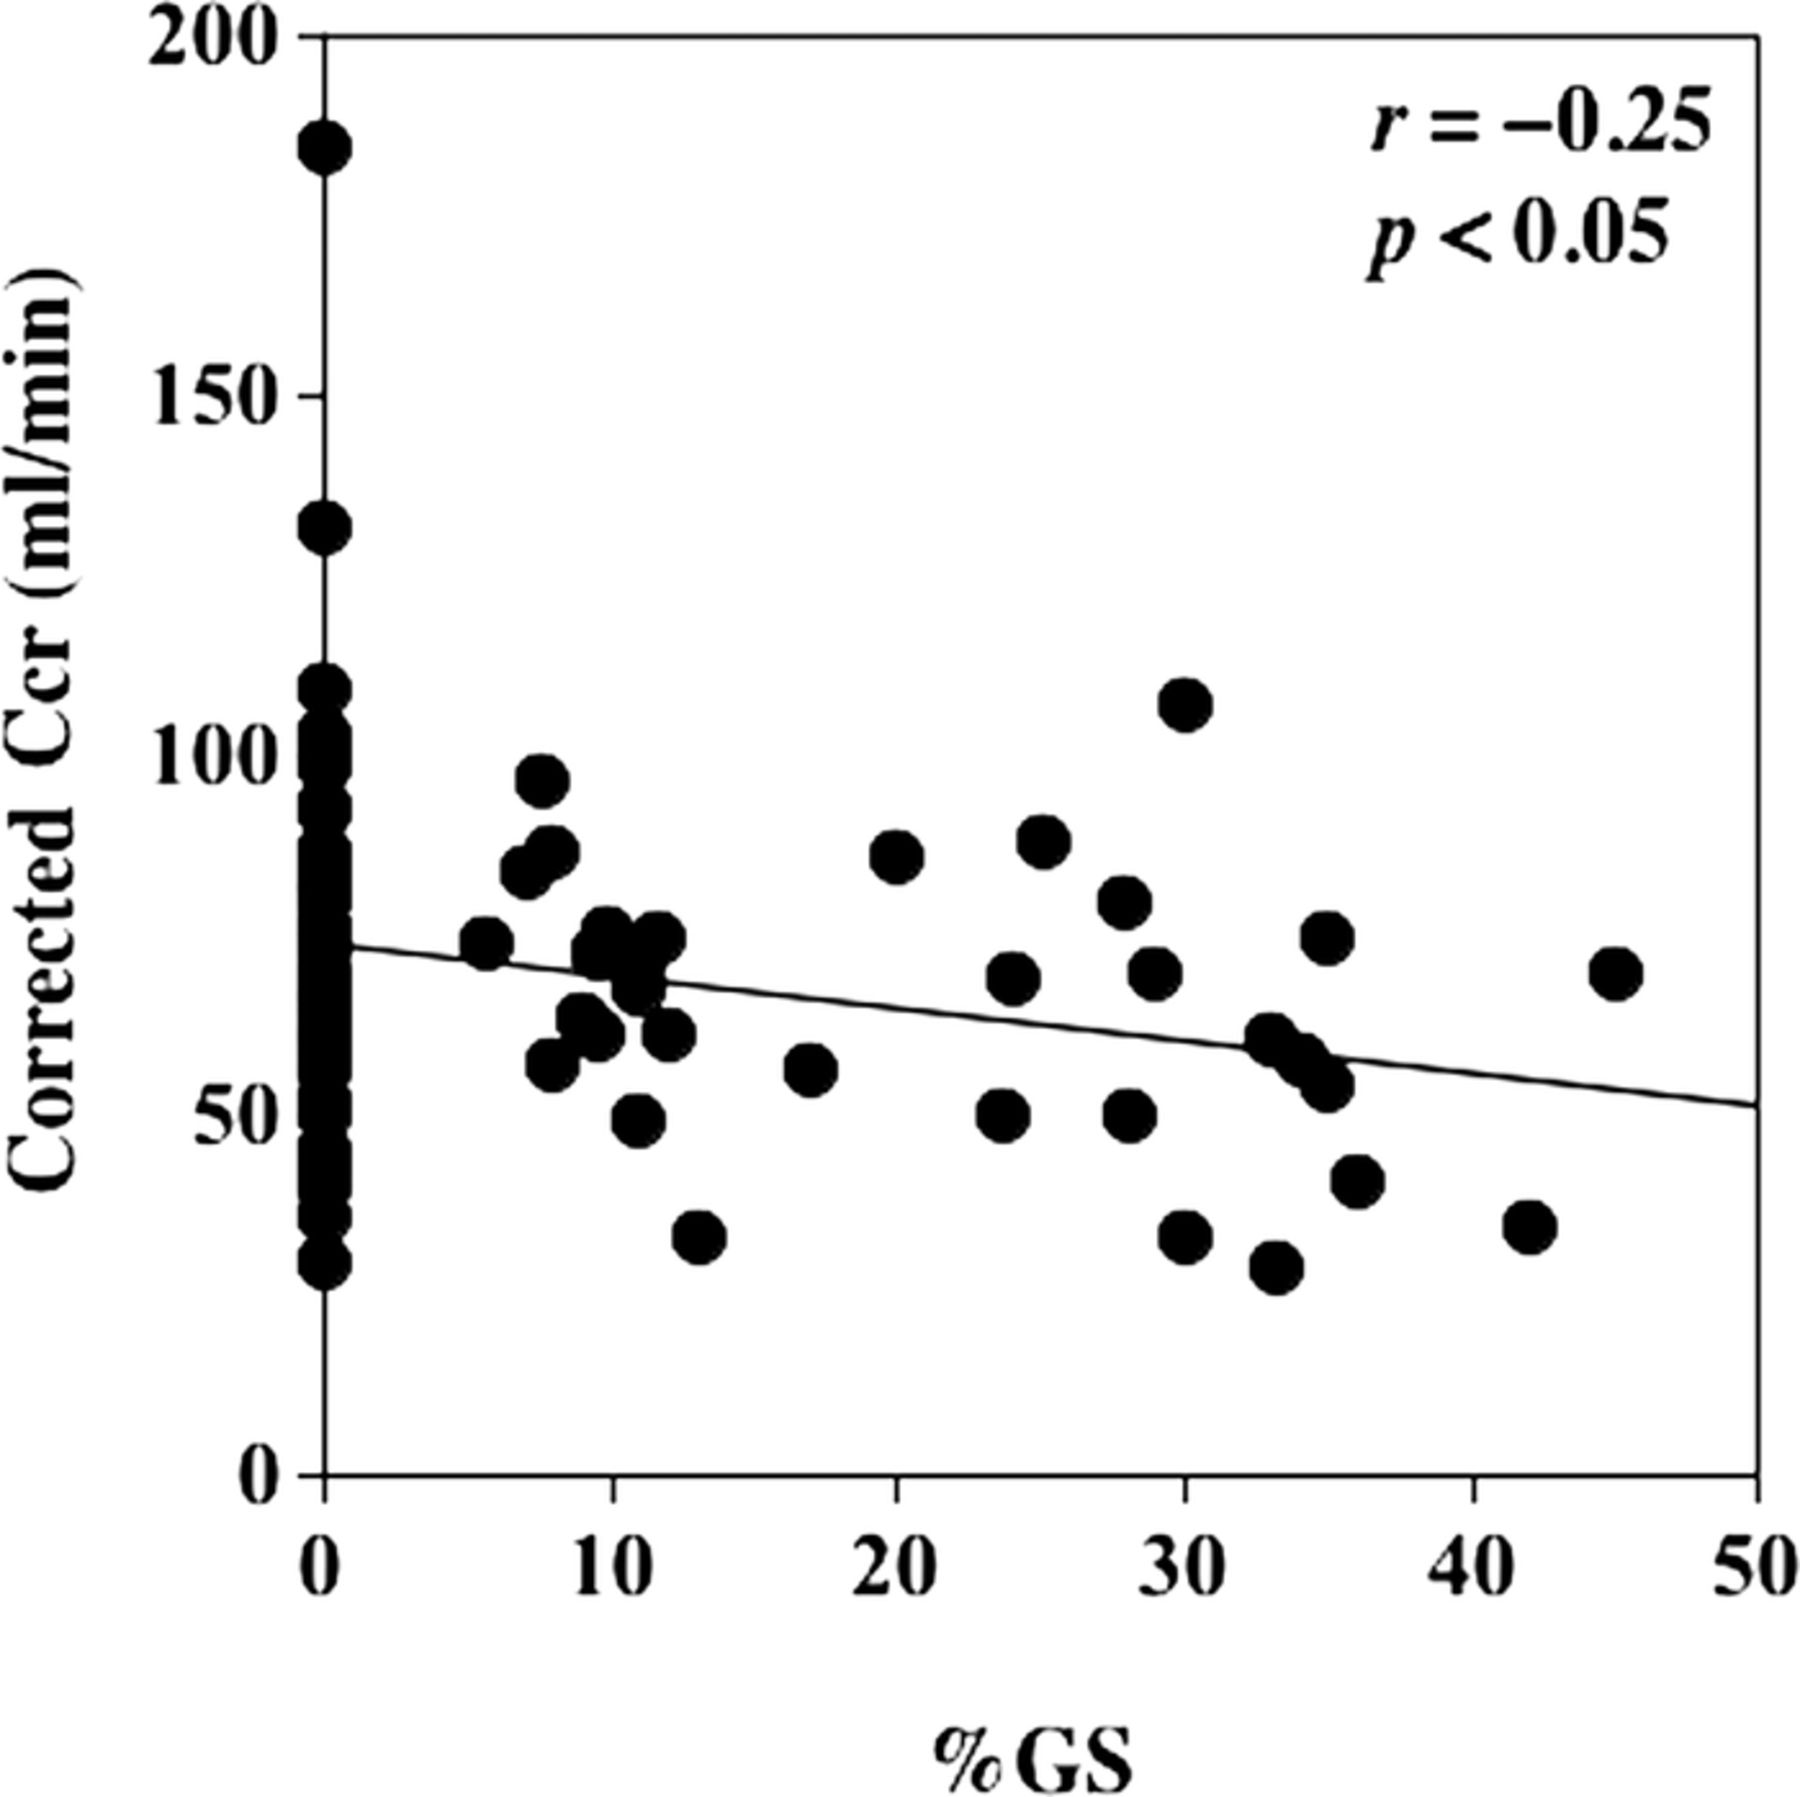
The corrected Ccr was negatively correlated with %GS (figure 2).

The relationship between corrected creatinine clearance (Ccr) and percent global glomerular sclerosis (%GS). Corrected Ccr was significantly correlated with %GS (r=−0.25, p<0.05).
Renal function at the final observation
Baseline and follow-up ACR were not different among the three groups. However, ACR was significantly increased in the CII group at the follow-up and initial and final albuminuria stages were significantly different in the CII group. Baseline and follow-up eGFR did not differ among the three groups. However, the slope of the eGFR decline was significantly greater in CII patients than in the CI patients, while renal function significantly decreased in the CII and CIII patients compared to each baseline eGFR (table 6). The change of ACR did not correlate with the slope of the eGFR among all the patients.
Renal function at the initial and final stages and its change during the 11-year observation period
Discussion
We evaluated the renal histological injury patterns in 111 normoalbuminuric and microalbuminuric Japanese patients with type 2 diabetes and examined the renal function progress in 37 patients during 11 years of follow-up according to the histological injury patterns. It was previously shown that the histological injury pattern was heterogeneous in Caucasian patients with type 2 diabetes in various stages of albuminuria.20–22 ,32 ,33 The present study revealed that histological injury patterns were also strikingly heterogenetic in Japanese patients with type 2 diabetes even in the normoalbuminuric stage, in addition to those in the microalbuminuric stage.23 However, in patients with type 2 diabetes, it had not been clarified whether or not renal functional decline occurs according to the renal histological injury patterns. Among the 111 patients with type 2 diabetes, there were 11 CKD G3-4 patients of 59 normoalbuminuric patients (18.6%) and 15 CKD G3-4 patients of 52 microalbuminuric patients (25.4%), when renal function was evaluated by corrected Ccr. The percentage of normoalbuminuric CKD G3-4 patients was similar or smaller than those in previous studies.34 ,35 The proportions of CKD G3-4 compared with CKD G1-2 were significantly different among the histological categories and were largest in the CII group, showing typical diabetic glomerulosclerosis, compared with those in either the CI or CIII groups. Moreover, the CKD G3-4 group had a higher percentage of global glomerular sclerosis, and %GS was negatively correlated with Ccr. It was previously shown that normoalbuminuric patients with type 1 diabetes with Ccr under 90 mL/min had a more advanced typical diabetic glomerulosclerosis including GBM thickening and mesangial expansion.36 Another study revealed that more advanced mesangial expansions were related to GFR loss in patients with type 1 diabetes.37 A more recent study showed that GBM thickening was a risk factor for the development of macroalbuminuria or end-stage kidney disease in patients with type 1 diabetes.17 Taken together, renal function decline as shown in the CKD G3-4 patients, in the present study, may be related to typical diabetic glomerulosclerosis and increased cases of global sclerosis, but not to interstitial expansion, because the CKD G3-4 patients did not show larger Vv(Int/cortex) compared with CKD G1-2 patients. On the other hand, in the present study, instead of global glomerulosclerosis, CIII patients mainly showed more interstitial expansion compared with CI patients. Thus, it will be necessary to elucidate more detailed renal structural changes using electron microscopic materials in the present cohort for further clarification.
Histological injury patterns were widely distributed among the albuminuria categories but without a significant difference. Therefore, we cannot detect the renal histological injury patterns from the view of urinary albumin categories. The previous study by Fioretto et al23 showed 30% CI, 30% CII, and 40% CIII patterns in microalbuminuric patients with type 2 diabetes with research-related renal biopsies. A more recent study38 using renal biopsies in patients with type 2 diabetes with GFR under 60 mL/min/1.73 m2 showed that there were 2 CI, 3 CII, and 3 CIII in normoalbuminuria; 0 CI, 5 CII, and 1 CIII in microalbuminuria; and all 17 patients with macroalbuminuria had typical glomerular changes, which are comparable with the results in the present study. Taken together, histological heterogeneity is present at an early stage of diabetic nephropathy in patients with type 2 diabetes and there is a limitation using urinary albumin excretion to detect renal histological severity or injury patterns; therefore, more accurate biomarkers that can reflect histological injury patterns more accurately are necessary.
Regarding the renal structural and functional relationships, IAH was higher in microalbuminuric patients and also in the CII and CIII groups than in the CI group. In patients with type 1 diabetes, IAH over 1 showed a more thickened GBM, an enlarged mesangial matrix, and narrowing of the peripheral surface of the GBM than in patients with IAH equal to 1, indicating almost no arteriolar hyalinosis, even though arteriolar disease was rare in patients with type 1 diabetes.31 Arteriolar hyalinosis was more common in type 2 diabetes, as corroborated in the present study. These phenomena suggested that arteriolar hyalinosis may be related to urinary albumin excretion, which may play a role in renal histological heterogeneity in patients with type 2 diabetes; while %GS suggests renal functional decline, which should be clarified by a longitudinal study as shown in patients with type 1 diabetes18 using serial renal biopsies.
The eGFR did not differ at the baseline or the follow-up among the groups. However, the eGFRs in the CII and CIII patients were significantly decreased during the 11-year follow-up. The decrease in eGFR in the CI group was slightly greater than the age-related renal function loss,39 which was under 1.0 mL/min/1.73 m2 per year with no change between baseline and follow-up. Therefore, renal function in patients with a normal or near-normal renal structure remained unchanged during this 11-year follow-up. The risk factors must be determined to detect these kinds of patients. However, the slope of eGFR decline was significantly greater among the CII patients than in the CI patients while the ACR and the proportion of macroalbuminuria increased significantly in the CII patients at follow-up. It had been shown that urinary albumin excretion was significantly increased after 6 years of follow-up in patients with type 2 diabetes with GBM thickening or mesangial expansion.18 The change in mesangial expansion was correlated to urinary albumin excretion during 5 years of observation in patients with type 1 diabetes.13 In addition, a previous report19 showed that GBM thickening and mesangial expansion predicted GFR decline in 108 microalbuminuric and macroalbuminuric patients with type 2 diabetes using research-related biopsies showing the heterogeneity of GFR changes during 2–6 follow-up years. However, currently, there are insufficient longitudinal data to show which structural changes predict the slope of GFR decline in patients with types 1 and 2 diabetes. Therefore, to the best of our knowledge, this is the first study indicating that typical renal structural changes as diabetic glomerulosclerosis predict significant renal dysfunction progress compared with normal structure or atypical injury patterns including those in the normoalbuminuric stage.
The first limitation to this study was that a relatively small number of patients were followed up and a biased sample might influence the renal function and albuminuria stage at the follow-up period because the patients who were followed up were younger and had a short duration, and the histological injury pattern, MGV, and Vv(Int/cortex) were also different between the two groups. Although we observed changes in renal function in the earlier stages of diabetic nephropathy in younger patients with a relatively short duration in the present study, longitudinal analysis of renal function and histology by serial renal biopsies is warranted in a larger study of patients with type 2 diabetes with a longer observational period. Second, renal function in the cross-sectional analysis and longitudinal follow-up were performed using different methods. Renal function at the baseline without Ccr could not be obtained in all the patients; therefore, we used Ccr or corrected Ccr as the baseline data, and the comparison of renal function between baseline and follow-up was performed using eGFR. Finally, we did not use the 2010 classification of diabetic glomerulosclerosis provided by the Research Committee of the Renal Pathology Society (RPS) because electron microscopic materials were not available from all the patients.40 However, based on the histological heterogeneity in type 2 diabetes, shown in previous studies,15 ,20–23 the present study provides useful information regarding the renal functional prognosis related to renal histological findings. A recent study has shown that eGFR loss was related to the histological severity of the RPS classification.41
In conclusion, in normoalbuminuric and microalbuminuric patients with type 2 diabetes, low Ccr could indicate typical diabetic glomerulosclerosis and a high frequency of global glomerular sclerosis. Arteriolar hyalinosis could be related to microalbuminuria. We clarified that patients with typical diabetic glomerulosclerosis showed renal functional decline during the 11 years of observation. However, urinary biomarkers more accurately identifying histological patterns of renal injury are necessary because the GFR decline rates differed according to the histological injury patterns.
References
Footnotes
-
Contributors TM researched the data, contributed to the discussions, and wrote the manuscript. YS, SI, MI, MK, and MH contributed to the discussions and reviewed and edited the manuscript. TM is the guarantor of this work and, as such, had full access to all the data in the study and takes responsibility for the integrity of the data and the accuracy of the data analysis. All of the authors critically revised the article and approved the final version.
-
Funding This research received no specific grant from any funding agency in the public, commercial or not-for-profit sectors.
-
Competing interests None.
-
Ethics approval The protocol for the present study was approved by the Research Ethics Committee of the Kitasato University School of Medicine.
-
Provenance and peer review Not commissioned; externally peer reviewed.
-
Data sharing statement No additional data are available.