Article Text

Abstract
Background CD300LG rs72836561 (c.313C>T, p.Arg82Cys) has in genetic-epidemiological studies been associated with the lipoprotein abnormalities of the metabolic syndrome. CD300LG belongs to the CD300-family of membrane-bound molecules which have the ability to recognize and interact with extracellular lipids. We tested whether this specific polymorphism results in abnormal lipid accumulation in skeletal muscle and liver and other indices of metabolic dysfunction.
Methods 40 healthy men with a mean age of 55 years were characterized metabolically including assessment of insulin sensitivity by the hyperinsulinemic euglycemic clamp, intrahepatic lipid content (IHLC) and intramyocellular lipid content (IMCL) by MR spectroscopy, and β-cell function by an intravenous glucose tolerance test. Changes in insulin signaling and CD300LG mRNA expression were determined by western blotting and quantitative PCR in muscle and adipose tissue.
Results Compared with the 20 controls (CC carriers), the 20 CT carriers (polymorphism carriers) had higher IMCL (p=0.045), a reduced fasting forearm glucose uptake (p=0.011), a trend toward lower M-values during the clamp; 6.0 mg/kg/min vs 7.1 (p=0.10), and higher IHLC (p=0.10). CT carriers had lower CD300LG mRNA expression and CD300LG expression in muscle correlated with IMCL (β=−0.35, p=0.046), forearm glucose uptake (β=0.37, p=0.03), and tended to correlate with the M-value (β=0.33, p=0.06), independently of CD300LG genotype. β-cell function was unaffected.
Conclusions The CD300LG polymorphism was associated with decreased CD300LG mRNA expression in muscle and adipose tissue, increased IMCL, and abnormalities of glucose metabolism. CD300LG mRNA levels correlated with IMCL and forearm glucose uptake. These findings link a specific CD300LG polymorphism with features of the metabolic syndrome suggesting a role for CD300LG in the regulation of common metabolic traits.
Trial registration number NCT01571609.
- Metabolic Syndrome
- Genetics
- Insulin Resistance
- Gene Expression
This is an Open Access article distributed in accordance with the Creative Commons Attribution Non Commercial (CC BY-NC 4.0) license, which permits others to distribute, remix, adapt, build upon this work non-commercially, and license their derivative works on different terms, provided the original work is properly cited and the use is non-commercial. See: http://creativecommons.org/licenses/by-nc/4.0/
Statistics from Altmetric.com
Key messages
An amino acid polymorphism in CD300LG (Arg82Cys), a protein which belongs to the CD300 family of lipid-binding surface glycoproteins in highly vascularized tissues, has in genetic-epidemiological studies been associated with the fasting lipoprotein abnormalities of the metabolic syndrome.
We performed a comprehensive metabolic phenotype characterization of healthy male carriers of the identical polymorphism to test the hypothesis that the polymorphism may associate with additional metabolic phenotypes.
The CD300LG polymorphism was associated with reduced expression of the gene in adipose tissue and skeletal muscle, accumulation of lipid in the skeletal muscle, and abnormalities in glucose metabolism. The findings of the study suggest a role for CD300LG in the regulation of common metabolic phenotypes.
Background
The metabolic syndrome, comprising prediabetes, abdominal obesity, hypertension, and dyslipidemia, is a risk factor for the future development of type 2 diabetes (T2DM) and cardiovascular diseases (CVD).1–3 Accumulation of lipids in muscle and liver is associated with insulin resistance and is also a risk factor for T2DM and CVD.4–6
Epidemiological studies have shown that prenatal and postnatal environmental factors together with genetic factors exert major influences on the risk of metabolic disorders.7–15 Each of the aspects of the metabolic syndrome has been studied in large-scale genetic association studies with a multitude of loci identified and each associated with a subtle effect on disease susceptibility.16–19 The hypothesis that metabolic disorders on top of their phenotype-specific genes share overlapping causative genes was addressed in a three-stage genetic-epidemiological study combining whole exome sequencing of 2000 Danish individuals with genotyping and association studies in Danish and European individuals.20 A low-frequent amino acid polymorphism in CD300LG (c.313 C>T, p.Arg82Cys) with a minor allele frequency of 3.5% was associated with a decreased fasting serum high-density lipoprotein (HDL) cholesterol level and an increased fasting serum triglyceride level, that is, components of the metabolic syndrome. The protein encoded by CD300LG belongs to the CD300 family of membrane-bound molecules, which have broad and diverse immunological actions, including the ability to recognize and interact with extracellular lipids.21 ,22 The CD300LG protein is expressed in a broad range of tissues with highest expression in the placenta, adipose tissue, and skeletal muscle.20 ,23 The biological functions of CD300LG are not well characterized, but the protein has been implicated in lymphocyte interaction with endothelial cells in lymph node capillaries,24 endocytosis of immunoglobulins,23 and binding of polar lipids.22 The biological functions of CD300LG in adipose tissue and skeletal muscle are largely unknown, but with the present study we propose a role for CD300LG in lipid storage in skeletal muscle. It remains a distinct possibility that a genetically determined dysfunction of the CD300LG protein could induce abnormal lipid deposition in insulin-sensitive tissues, such as skeletal muscle contributing to insulin resistance. On the basis of these considerations, we performed a comprehensive metabolic phenotype characterization of male carriers of CD300LG rs72836561.
Our overall aim was to test if there are associations between the Arg82Cys polymorphism in CD300LG and metabolic phenotypes on whole body and tissue levels. More specifically, we aimed at testing whether CD300LG polymorphism carriers display reduced CD300LG mRNA expression in insulin-sensitive target tissues (muscle and fat) and whether any such genetic defects translate into excessive lipid accumulation in muscle and liver, features of insulin resistance, and metabolic dysfunction in a homogeneous group of male participants.
Methods
Study participants were recruited from a Danish biobank of nearly 10 000 participants.20 Members of the biobank had been genotyped for the CD300LG polymorphism as part of the genetic-epidemiological study.20 ,25 Potential participants were invited to participate in the study according to CD300LG genotype. Sixty male CD300LG CT carriers (polymorphism carriers) fulfilled inclusion criteria of age between 18 and 70 years, body mass index (BMI) <30 kg/m2, and normal glucose tolerance and were invited by letter to participate in the study; 20 CT carriers were included in the study, 31 did not respond to the invitation or did not wish to participate, and 9 had a medical condition that was incompatible with study participation. High-performance athletes were not included in the study (marathon runners, etc).
The 20 CD300LG CT carriers were age-matched and BMI-matched with 20 healthy male CC carriers (controls). The participants were examined over 2 days with the aim of assessing the effects of the CD300LG polymorphism on metabolic, cardiovascular, and bone health.25 Only data on metabolic health are included in the present manuscript. Only men were included in the study to avoid the effect of the menstrual cycle in women on metabolic variables. The study participants were healthy as assessed by medical history, a physical examination, and a routine biochemical profile.
All participants provided written informed consent. The study protocol was approved by the Ethical Committee of Region Midt (protocol number 1-10-72-113-12) and the studies were conducted according to the principles of the Helsinki declaration. The study was registered at clinicaltrials.gov (trial number NCT01571609).
Design
After an overnight fast, the examination day started with a whole body DXA scan for evaluation of body composition (Hologic QDR 2000). This was followed by a 2 h basal period with infusion of a glucose and palmitate tracer to assess the rate of endogenous glucose production and free fatty acid (FFA) production. Ninety minutes into the basal period, blood was sampled for a biochemical profile. The basal period was followed by a Botnia clamp26 which combines an intravenous glucose tolerance test (IVGTT; 60 min) with a hyperinsulinemic euglycemic clamp (HEC; for 120 min). Indirect calorimetry was performed during the last 30 min of the basal period and the clamp for assessment of resting energy expenditure (REE) and respiratory quotient (RQ) (Deltatrac monitor, Datex, Helsinki, Finland). Lipid and glucose oxidation was estimated after correction for protein oxidation, which was calculated from the urinary urea excretion during the study day. Muscle and subcutaneous adipose tissue (SAT) biopsies were collected 15 min into the basal period and repeated 50 min into the clamp (figure 1). MR spectroscopy of the liver for estimation of the intrahepatic lipid content (IHLC) and of the left anterior tibial muscle for estimation of the intramyocellular lipid content (IMCL) was completed on the morning of a separate day. IHLC and IMCL are expressed as the arbitrary ratio between the lipid and water signal in the voxel. Study participants were non-fasting on the day of the MR spectroscopy. Study participants had refrained from major physical exercise for 48 h prior to both study days. The study participants arrived by transportation to the research facilities on the morning of the examination days.

Schematic overview of the examination day. The MR spectroscopy was performed on a separate day (IVGTT, intravenous glucose tolerance test).
Intravenous catheters
A catheter was inserted retrogradely in a deep antecubital vein for sampling of venous blood from the forearm. Prior to sampling, a wrist cuff was inflated to suprasystolic blood pressure to ensure that only blood from the deep veins of the forearm was sampled. Regional blood blow was estimated by venous occlusion plethysmography. On the contralateral arm, an intravenous catheter was inserted in a heated superficial dorsal hand vein for sampling of arterialized venous blood and in an antecubital vein for infusions.27
Muscle and adipose tissue biopsies
Muscle tissue was obtained from the lateral vastus muscle 15 cm proximal to the knee joint line by the use of a Bergstrom biopsy needle. SAT was obtained from the periumbilical region by liposuction with a 50 mL syringe. Tissue samples were cleaned from visible blood with sterile RNA-free saline, snap frozen in liquid nitrogen, and stored at −80°C.
Quantitative PCR
Real-time PCR assays were performed in duplicate for assessment of CD300LG mRNA tissue expression in skeletal muscle and SAT and included no-template controls, a calibrator sample, and a standard curve of five serial dilution points of the calibrator sample based on a pool of the sampled cDNAs. Relative expressions were calculated from standard curves using software implemented in the light cycler. Target genes were normalized to endogenous controls, and expressions relative to the calibrator were calculated. For muscle tissue, cyclophilin A (CP) and β-actin were used as internal reference genes, whereas only CP was used in SAT. Further details on the RNA isolation and PCR are provided in the online supplementary material.
Western blotting
Skeletal muscle biopsies obtained under basal conditions and during the clamp were used for western blotting for assessment of dynamic changes in insulin signaling downstream of the insulin receptor. Quantifications of protein phosphorylation are expressed as a ratio of phosphorylated protein to total protein measured on the same membrane for pAKT-threonine308/AKT2. For the ratios of pAS160/AS160, pAKT-serine473/AKT2, pmTOR/mTOR, and pGS/GS, the phosphorylated target and the total target were measured on separate membranes and the ratios were calculated after normalization for total protein of the membranes. Detailed descriptions of the applied methods are provided in the online supplementary material.
Tracers
For the assessment of endogenous glucose production (EGP) during the basal period, a 3-3H-glucose tracer (New England Nuclear Life Science Products, Boston, Massachusetts, USA) was infused for 120 min (0.15 µCi/min). A priming dose 3-3H-glucose (15 µCi) was given as a bolus prior to the constant infusion. Glucose rate of appearance (Ra) was calculated from Steele's equation for non-steady state.28–30 For evaluation of endogenous palmitate production during the basal period, 9.10-3H-palmitate was infused for 60 min (0.3 µCi/min) from time 60 to 120. Blood was sampled for measurement of palmitate concentration and specific activity (SA) at time 0, and at time 100, 110, and 120 for steady-state analyses. Palmitate concentration and SA were analyzed by high performance liquid chromatography using 2H31-palmitate as an internal standard.31 Systemic palmitate flux (µmol/min) was calculated using the 9.10-3H-palmitate infusion rate (dpm/min) divided by the steady-state palmitate SA (dpm/µmol).32 Regional palmitate balances were estimated using blood flow, SA, and palmitate concentrations from arterial and venous samples and calculated as previously described.33
IVGTT and HEC
The Botnia clamp model was used to assess β-cell function and insulin sensitivity on the same study day.26 A bolus of 25 g glucose from a 50% glucose solution was given at time 120 min followed by blood sampling at time 120, 122, 124, 126, 128, 130 for estimation of first-phase insulin release (FPIR) and C-peptide concentrations. Blood was sampled at time 140, 160, and 180 min for assessment of second-phase insulin release (SPIR) and C-peptide concentrations. FPIR was quantified as the time 120–130 and SPIR as the time 130–180 incremental area under the curve (iAUC) insulin concentration.26 The clamp was started at time 180 with an insulin infusion rate of 1 mU/kg/min (Insulin Actrapid, Novo-Nordisk, Copenhagen, Denmark) until time 300. Plasma glucose was clamped at 5 mmol/L by adjusting an intravenous infusion of 20% glucose (200 g/L, SAD, Copenhagen, Denmark) according to plasma glucose measurements every 10 min (Beckmann Instruments, Palo Alto, California, USA). Steady-state serum insulin concentrations were measured at time 280, 290, and 300 min during the clamp. Insulin sensitivity in the two genotype groups was calculated as the mean glucose infusion rates (mg/kg/min) during the last 30 min of the clamp, the M-value.34
MR spectroscopy
1H-MR spectroscopy was used to assess IHLC and IMCL using a Signa Excite 1.5 Tesla Twin Speed scanner (GE Medical systems, Milwaukee, Wisconsin, USA). The MR spectroscopy of the liver and muscle included point resolved spectroscopy sequences as described earlier.35 Spectrum quality was checked by visual inspection during each examination and the mean full width at half maximum was 10.0 (95% CI 9.5 to 10.5) Hz for liver spectra and 10.8 (95% CI 10.0 to 11.6) Hz for muscle spectra. Data processing provided an estimate of the lipid-to-water ratio in the voxel (LC Model, Dr Steven Provencher, Ontario, Canada).36 Three CT carriers were excluded from the analysis of IHLC due to technical difficulties with the liver spectroscopy.
Assays
Plasma lipoproteins and procalcitonin were analyzed in the Department of Clinical Biochemistry, Aarhus University Hospital. Proinsulin (intact proinsulin kit, Dakocytomation, Glostrup, Denmark), insulin (DAKO, Glostrup, Denmark), C-peptide (ALPCO, Salem, New Hampshire, USA), and cortisol (EIA-1887, AH-Diagnostic) were analyzed using ELISA-based kits. FFAs were analyzed with a commercial kit (Wako chemicals, Neuss, Germany). High-sensitive C reactive protein (BAM 17072 and MAB 17071, R&D Systems Europe Ltd, Abingdon, UK) and osteoprotegerin (OPG/TNFRSF11B, R&D Systems Europe Ltd, Abingdon, UK) were analyzed using an in-house ELISA assay. Adiponectin was analyzed using a commercial time-resolved immunofluorometric assay (TR-IFMAs; Autodelfia, PerkinElmer, Turku, Finland). Glucagon was analyzed by an in-house radioimmunoassay.37 Plasma mannose-binding lectin was determined by a TR-IFMA as previously described.38 Blood for analyses of proinsulin was sampled at time 90 min (basal period) and for glucagon at time 100, 110, 120, 180, 280, 290, and 300.
Statistical analysis
Statistical analyses were performed using SPSS V.21.0. Results are presented as mean±95% CI or median±IQR. A Student t test was applied to compare the two genotype groups. Non-parametric data were log-transformed to obtain normality. For data that did not achieve normal distribution on log-transformation, between-group comparisons were performed using a Wilcoxon-Mann-Whitney U test. p-values <0.05 were considered significant. A multiple regression model was applied to adjust the M-value for steady-state serum insulin concentration (clamp). The analyses of FPIR and SPIR included adjustment for the M-value. Linear regression with the log-transformed CD300LG mRNA level as the independent variable was used to test for correlation with relevant outcome measures. A Fisher's exact test was used to test for association between dichotomous variables. A mixed analysis of variance with repeated measurements was used for analysis of data available for both the basal period and the clamp. The between-participant factor was genotype and the within-participant factor was condition (fasting or insulin-stimulated). The within-participant effect of insulin stimulation was evaluated by a paired t test. Main outcomes were also adjusted for mean arterial pressure. Power calculations were based on the glucose infusion rates during the clamp, and with 20 study participants in each genotype group, the statistical power to detect a 20% difference in glucose infusion rates during the clamp was >80%. Box plots were generated using a web tool for generation of box plots (http://boxplot.tyerslab.com/).39
Results
Anthropometrics
Clinical characteristics of the study participants are presented in table 1.
Anthropometric data on the 40 male study participants according to CD300LG rs72836561 CC and CT genotype
Substrate metabolism and insulin sensitivity
Forearm metabolism was evaluated in the basal period by assessing arteriovenous differences of glucose and FFA. Fasting EGP and palmitate kinetics were evaluated using a 3-3H-glucose tracer and a 9.10-3H-palmitate tracer, respectively (table 2). The glucose uptake in the forearm was reduced in CT carriers under basal conditions, but no differences were detected between groups in rates of EGP or in palmitate kinetics.
Various measures of insulin sensitivity and energy expenditure in the 40 male study participants according to CD300LG rs72836561 CC and CT genotype
Insulin sensitivity was assessed by use of an HEC. Arteriovenous substance differences were also evaluated during insulin stimulation. A trend toward lower insulin sensitivity in CT carriers was detected; the M-value in the CT group was 5.96 mg/kg/min (95% CI 4.99 to 6.93) compared with 7.07 (6.08 to 8.05) in the CC group (p=0.10; figure 2). Steady-state insulin concentrations during the clamp was 404 pmol/L (95% CI 358 to 450) in CT carriers compared with 418 (391 to 444) in CC carriers (p=0.58). Adjusting the M-value for serum insulin concentration during the steady state of the clamp had some effect on the results (p=0.08). There was no effect of genotype on arteriovenous balances of glucose or FFA during the HEC. There were no between-group differences in forearm blood flow during the basal period or during the clamp (data not shown).

Box plot representing the median GIRs (mg/kg/min) by CD300LG genotype during the last 30 min of the HEC. The center lines show the medians; box limits indicate the 25th and 75th centiles; whiskers extend 1.5 times the IQR from the 25th and 75th centiles. CC, control; CT, polymorphism carriers; GIR, glucose infusion rate; HEC, hyperinsulinemic euglycemic clamp.
β-cell function
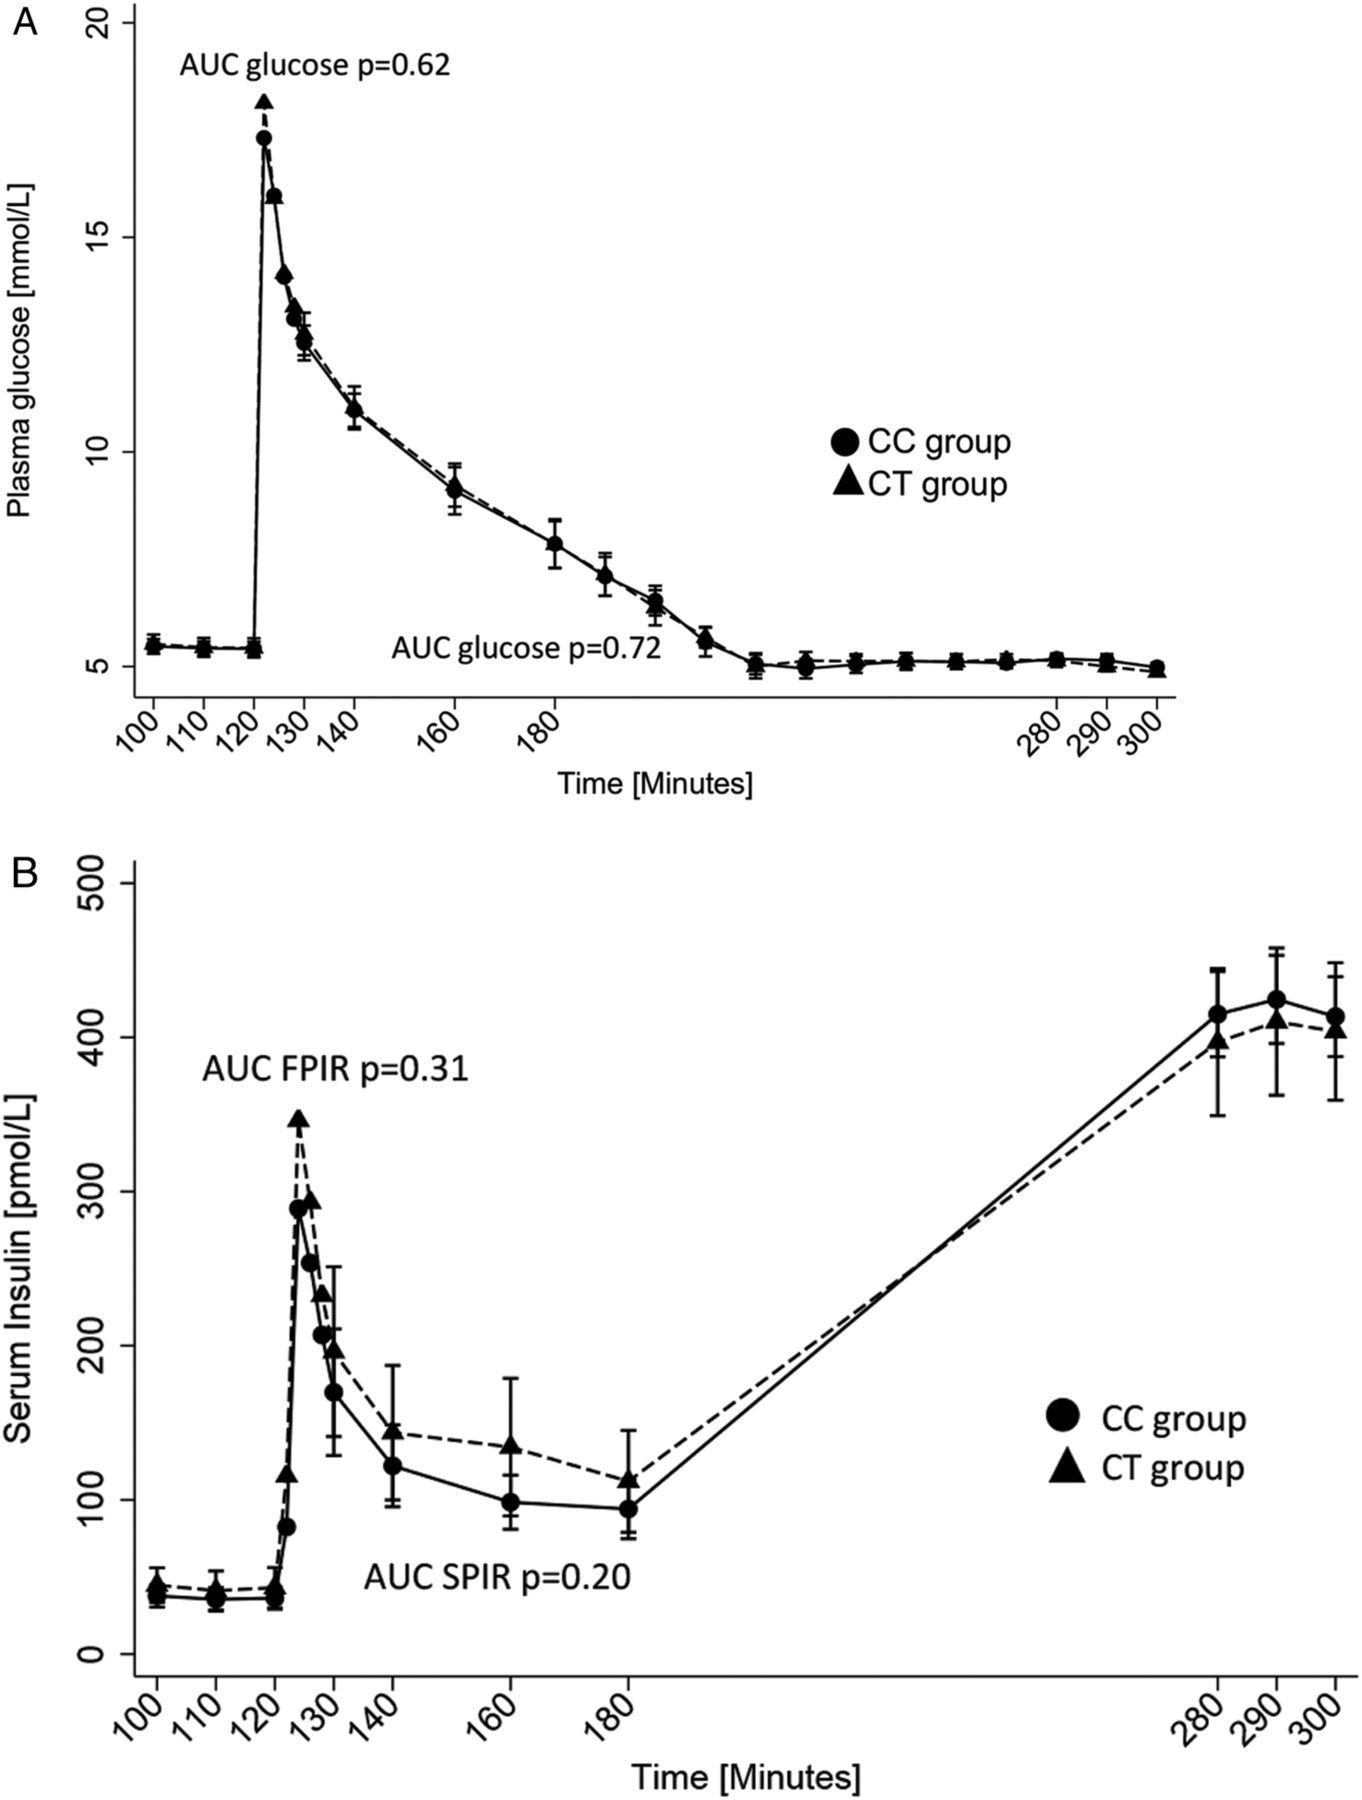
β-cell function was assessed by FPIR and SPIR in response to intravenous administration of 25 g glucose (figure 3). There were no genotype-group differences in the iAUC of glucose, insulin, or C-peptide from time 120–130 (glucose, p=0.97; FPIR, p=0.37; C-peptide, p=0.18) or time 130–180 (glucose, p=0.93; SPIR, p=0.20; C-peptide, p=0.28). Adjusting the data for the M-value did not change the results.

(A–B) Plasma glucose concentration (mmol/L) by CD300LG genotype during the IVGTT (time 120–180) and during the HEC (time 180–300) (A) and FPIR and SPIR (pmol/L) by CD300LG genotype during the IVGTT (time 120–180) and insulin concentrations during the HEC (time 180–300) (B). The CT group is represented by black triangles and the CC group is represented by black circles. The whiskers correspond to 95% CI. AUC, area under the curve; CC, control; CT, polymorphism carriers; FPIR, first-phase insulin release; HEC, hyperinsulinemic euglycemic clamp; SPIR, second-phase insulin release.
Energy expenditure
Fasting and insulin-stimulated REE and RQ were obtained by indirect calorimetry. The genotype of the study participants did not affect basal and insulin-stimulated energy expenditure and substrate oxidation (table 2).
MR spectroscopy
IMCL was 0.005 au (95% CI 0.0038 to 0.0062) in the CT carriers compared with 0.004 in the controls (0.0029 to 0.0044), p=0.045. The median IHLC in CT -carriers was 0.07 (IQR 0.036–0.18) compared with 0.043 (0.024–0.068) in the controls (p=0.10; figure 4A, B).

(A–B) Box plot representing the median IMCL (A) and IHLC (B) as assessed by MR spectroscopy by CD300LG genotype. Other definitions of the plot are described in the legend to figure 2. CC, control; CT, polymorphism carriers; IHCL, intrahepatic lipid content; IMCL, intramyocellular lipid content.
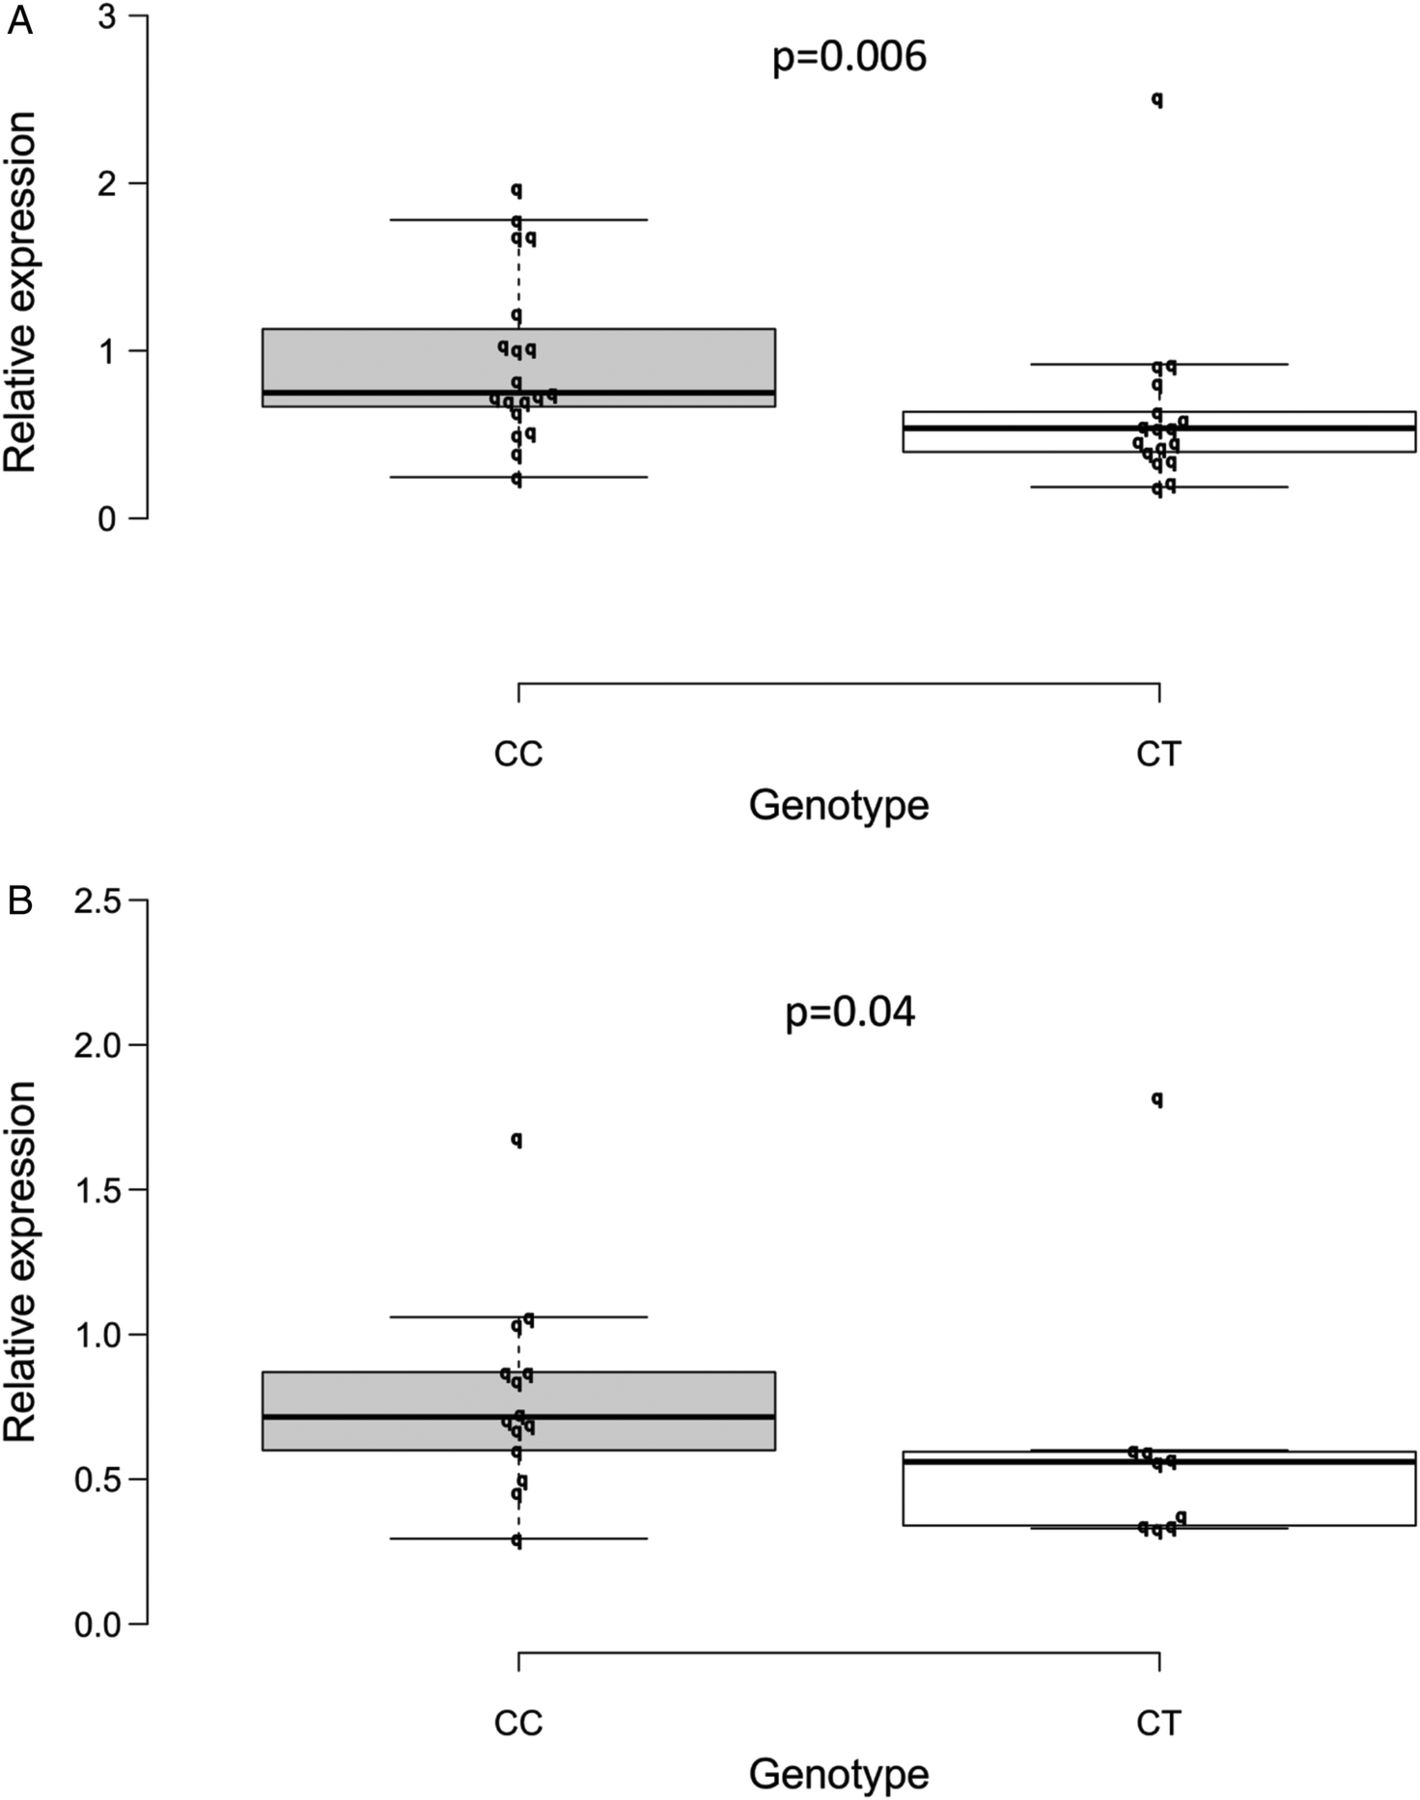
Gene expression
The relative expression of CD300LG mRNA was determined by real-time quantitative PCR of skeletal muscle and SAT. The median relative expression of CD300LG mRNA in skeletal muscle in CC carriers was 0.79 (IQR 0.68–1.34) compared with 0.54 (IQR 0.37–0.72) in the CT carriers (p=0.006; figure 5A). Gene expression analysis in SAT was performed in a subset of study participants (when sufficient SAT for mRNA extraction was available (n=23); figure 5B). The median relative expression of CD300LG in SAT in the CC group was 0.72 (IQR 0.58–0.91) compared with 0.56 (IQR 0.34–0.60) in the CT carriers (p=0.04). The reference genes, β-actin and CP, had similar expression in both genotype groups (data not shown). Independently of the genotype, CD300LG expression in skeletal muscle correlated with IMCL (β=−0.35, p=0.046), M-value (β=0.33, p=0.06), and arteriovenous glucose differences (β=0.37, p=0.03). There was no correlation between IHLC and CD300LG mRNA expression (β=−0.22, p=0.21; see online supplementary figure 1A–C).

(A–B) Box plot representing the median relative expression of CD300LG mRNA in skeletal muscle (A) and in SAT (B) by CD300LG genotype. Other definitions of the plot are described in the legend to figure 2. CC, control; CT, polymorphism carriers; SAT, subcutaneous adipose tissue.
Blood pressure
Office blood pressure and 24 h ambulatory blood pressure (data not shown) were higher in the CT group than in the CC group. Blood pressure levels did not correlate with forearm glucose uptake, IMCL, M-value, or CD300LG mRNA expression in this study (data not shown). There was only a marginal effect on the main outcomes of adjusting for mean arterial pressure: M-value (p=0.11), IMCL (p=0.045), fasting glucose arteriovenous difference (p=0.005), and IHLC (p=0.16).
Western blots
Skeletal muscle biopsies obtained under basal conditions and at 50 min into the HEC were used for western blotting for assessment of dynamic changes in insulin signaling downstream of the insulin receptor. Insulin had a profound effect on the ratio between phosphorylated and total protein levels for AKT2, pAKT-serine473, pAKT-threonine308, AS160, and pAS160-threonine642. Insulin had a clear stimulatory effect on protein and glycogen synthesis as suggested by the increasing pmTOR/mTOR ratio from basal conditions to the clamp and a decreasing pGS/GS in the same time interval. The genotype of the study participants did not affect signaling events in skeletal muscle (data not shown).
Discussion
The protein encoded by CD300LG belongs to a family of membrane-bound proteins which have the ability to recognize and interact with extracellular lipids,21 ,22 and in a recent genetic-epidemiological study, the Arg82Cys polymorphism was found to be associated with the lipoprotein abnormalities of the metabolic syndrome, that is, reduced fasting serum levels of HDL cholesterol and elevated serum levels of triglyceride.20 Our study was designed to test whether the CD300LG polymorphism is associated with decreased mRNA expression in insulin-sensitive tissues, altered intracellular lipid content, and insulin resistance. Our key findings include lower expression of CD300LG mRNA in muscle and fat, higher IMCL, a reduced basal forearm glucose uptake, and a trend toward decreased insulin sensitivity in CT carriers. Our data suggest a gene dosage effect with a significant correlation between CD300LG expression in skeletal muscle and IMCL and fasting forearm glucose uptake. We also observed a significant increase in office blood pressure and 24 h ambulatory blood pressure in CT carriers, but we were not able to replicate this association in a larger external cohort where CD300LG genotype and office blood pressure were available.25
The comprehensive protocol may be viewed as a strength of our study. The protocol allowed for detailed insights into dynamic measures of glucose and lipid turnover on whole body and tissue level and provided in-depth characterization of the metabolic phenotypes of the study participants. In the genetic-epidemiological gene discovery study, despite using a large study cohort, no signal was detected for additional metabolic traits or phenotypes for the CD300LG polymorphism (other than the observed changes in the lipoprotein profile).20 Furthermore, the study participants in this study were heterogeneous with respect to gender and metabolic health, and associations between the CD300LG polymorphism and metabolic traits and phenotypes were tested on fasting levels of glucose and insulin, or using dichotomized data with study participants grouped into diabetic/non-diabetic. Potentially, the effects of the polymorphism on dynamic measures of glucose and lipid metabolism (or on unmeasured variables such as IMCL) could have been missed in the large-scale study. In the present study we aimed at detecting novel associations between the CD300LG polymorphism and metabolic phenotypes through a detailed phenotype characterization of the study participants.
The CT polymorphism induced a significant reduction in CD300LG mRNA expression in adipose tissue and muscle. In SAT, large amounts of tissue were required to extract sufficient mRNA for cDNA synthesis reducing the number of participants available for the analyses. Owing to low yields of RNA from SAT, we were unable to inspect the integrity of the RNA on an agarose gel. On the other hand, yields of mRNA from muscle tissue were high and we were able to evaluate RNA integrity. Consequently, gene expression data from skeletal muscle seem solid, whereas the findings in AT should be interpreted more cautiously. Whether the reduced CD300LG mRNA expression in skeletal muscle and adipose tissue in polymorphism carriers translates into quantitative and/or structural changes in the CD300LG protein is currently unknown. Future studies of the impact of the CD300LG polymorphism on human metabolism could include studies of the effect of the polymorphism on CD300LG protein expression and structure.
Our data show that CT carriers had a higher IMCL and tended to have higher IHLC than controls as evaluated by MR spectroscopy. A considerable body of evidence suggests that excessive accumulation of lipids in muscle and liver in sedentary persons is associated with insulin resistance,4–6 possibly mediated by specific intracellular lipid fractions such as diacylglycerol (DAG) and ceramide.40 It has been shown that in obesity, increased IMLC is associated with increased intracellular DAG and ceramide contents.41 ,42 However, the cause and effect relationship of these associations remains to be finally established. Our data support and expand the concept of IMCL-associated insulin resistance by providing evidence that in humans a specific polymorphism in CD300LG leads to the combination of high IMCL and indices of abnormal glucose turnover. The biological roles of the CD300 group of transmembrane molecules are not well characterized, but it appears that the CD300 receptors exist in activating and inhibitory forms, which engage in specific interactions with major polar lipids of cell membranes;21 ,22 whether and, if so, how CD300LG is involved in lipid turnover in skeletal muscle cells remains elusive. Furthermore, the effect of dysfunction or reduced amounts of the CD300LG protein in polymorphism carriers on this proposed functional relationship is unknown, but it may include intracellular lipid accumulation and insulin resistance as suggested by results from this study.
Although we only saw a tendency towards lower M-values during the HEC in CT-carriers, we observed a lower fasting glucose uptake in the forearm when compared with the controls and skeletal muscle CD300LG mRNA expression correlated well with IMCL, M-value, and forearm glucose uptake when all participants were assessed as a whole. Taken together, these findings strongly suggest the existence of insulin resistance, although the fasting glucose uptake is also determined by insulin-independent mechanisms. We observed no effect of CD300LG genotype on forearm glucose uptake during the clamp, but a trend toward reduced insulin sensitivity in CT carriers. A decreased suppression of EGP during the clamp due to hepatic insulin resistance could have affected the results, but in healthy participants the relatively high insulin dose (1 mU/kg/min) has been shown to suppress the EGP by 98%.43 Unfortunately, EGP was only determined under fasting conditions as the Botnia clamp model has not been validated for simultaneous use of a glucose tracer. Consequently, with the present data, we are unable to assess the role of the liver in glucose turnover during the clamp. In this context, it should be noticed that the experimental procedures of the current investigation are relatively demanding and complex, therefore only allowing for a limited number of participants to be investigated. In addition, many genetic and lifestyle-related environmental factors may introduce biological noise and affect the outcome in an investigation such as ours.
The effect of the CD300LG polymorphism on clinical measures of insulin sensitivity did not translate into changes that were detectable using western blot analysis of signaling pathways downstream of the insulin receptor in skeletal muscle. We did detect a clear dynamic response to insulin when comparing basal conditions with insulin-stimulated conditions, but this response did not differ between genotype groups. We obtained a broad biochemical profile to explore the mechanisms underlying the metabolic changes in CD300LG CT carriers. No differences between genotype groups were detected for the measured endocrine hormones and inflammatory markers.
For practical purposes, we used the Botnia clamp model which combines measures of β-cell function and insulin sensitivity on a single study day.26 Whereas the glucose clamp offers a sensitive and reproducible way of evaluating insulin sensitivity, the IVGTT may be less accurate for determining β-cell function.44 We are not aware of any data linking the CD300LG polymorphism to β-cell function, and we did not detect any effects of CD300LG on any measures of insulin secretion.
As mentioned, the relatively low number of study participants was a limitation to our study as it may reduce the statistical power to draw solid conclusions. The finding of a correlation between CD300LG expression and measures of insulin sensitivity despite the low number of participants therefore suggests the existence of a relatively robust signal and indicates that the findings are not merely reflecting a type 1 error. With the low frequency of the CD300LG polymorphism, it required a large biobank of 10 000 participants to include 20 suitable male CT carriers in the study. We did not include women in the study due to the use of radioactive tracers and the impact of menstrual cycle on metabolic measurements. It would, however, be of interest to include women in a future CD300LG phenotype study as the effects on lipid traits were more pronounced in women in the original genetic-epidemiological study.20
Although the effect of the CD300LG polymorphism on the fasting serum HDL cholesterol and triglyceride level was discrete in the genetic-epidemiological study,20 the effect of the polymorphism on fasting serum HDL cholesterol was marked when compared with previously genome wide association study (GWAS)-identified HDL cholesterol-associated variants.16 The association between the CD300LG polymorphism and lipid traits was detected using several thousand study participants, suggesting that we were underpowered to detect a significant effect on fasting serum HDL cholesterol and triglyceride levels in this study.
Conclusions
Our data point to an effect of the CD300LG rs72836561 polymorphism on IMCL, fasting forearm glucose uptake, and on expression of CD300LG mRNA in SAT and muscle. Independently of the genotype, CD300LG mRNA expression was found to associate with IMCL and measures of glucose turnover. Conclusively, our data link a specific CD300LG polymorphism with features of the metabolic syndrome suggesting a role for CD300LG in the regulation of common metabolic traits.
Acknowledgments
The authors wish to acknowledge laboratory technicians Lisa Buus, Merete Møller, and Lone Kvist from the Medical research laboratories, Institute for Clinical Medicine, Aarhus University, for invaluable assistance with biochemical analyses and assistance during the study days. They would like to acknowledge laboratory technician Helle Zibrandtsen from the Research laboratory for biochemical pathology, Institute for Clinical Medicine, Aarhus University, for introducing JS to western blotting. They would also like to acknowledge laboratory technician Dorthe Bødker Jensen from the Centre for carbohydrate recognition and signaling, Department of molecular biology and genetics, Aarhus University, for assisting with the gene expression analyses and for the use of laboratory equipment for gene expression analyses. They are grateful to the 40 study participants for their participation in the study.
References
Supplementary materials
Supplementary Data
This web only file has been produced by the BMJ Publishing Group from an electronic file supplied by the author(s) and has not been edited for content.
- Data supplement 1 - Online supplement
- Data supplement 2 - Online figures
Footnotes
Contributors All authors were responsible for the conception and design of the study described in the manuscript, drafting of the manuscript, and its critical revision for intellectual content. All authors approved the version to be published.
Funding The study was conducted by LuCamp investigators (http://www.lucamp.org) funded by the Lundbeck Foundation and a full scholarship for JS from Aarhus University. The Novo Nordisk Foundation Center for Basic Metabolic Research is an independent Research Center at the University of Copenhagen partially funded by an unrestricted donation from the Novo Nordisk Foundation.
Competing interests None declared.
Ethics approval The study protocol was approved by the Ethical Committee of Region Midt (protocol number 1-10-72-113-12), Denmark.
Provenance and peer review Not commissioned; externally peer reviewed.
▸ Additional material is available. To view please visit the journal online (http://dx.doi.org/10.1136/bmjdrc-2015-000095).