Article Text

Abstract
Background The association between physical activity (PA), sedentary behavior, and incident diabetes has been assessed in whites but is less well investigated in multiethnic populations.
Objective To assess the association between PA, sedentary behavior, and incident diabetes in the Multi-Ethnic Study of Atherosclerosis.
Research design and methods Incident diabetes was assessed among adults without prevalent baseline diabetes (2000–2002) at 5 in-person examinations between 2002 and 2012. Baseline PA (moderate, vigorous, and exercise-specific; metabolic equivalents of task-hours/week) and sedentary behaviors (television watching, reading; hours/day) were assessed by questionnaire. HRs were estimated using Cox proportional hazard models.
Results Among 5829 adults (mean age 61.8 years, 54% female, 42% white, 12% Chinese-American, 26% African-American, 21% Hispanic-American), there were 655 incident diabetes cases (median follow-up 11.1 years). After adjustment, diabetes risk was lower in those with brisk or striding compared with none or casual walking pace (HR 0.67; 95% CI 0.54 to 0.84), higher levels of exercise PA (HR for highest vs lowest quartile 0.79; 95% CI 0.63 to 0.98), and any compared with no vigorous PA (HR 0.79; 95% CI 0.66 to 0.95). Race/ethnicity influenced the association of walking pace, exercise PA, and any vigorous PA on diabetes risk, which was only significant among whites. Total leisure sedentary behaviors (HR for highest vs lowest quartile 1.65; 95% CI 1.26 to 2.14) and television watching (HR for highest vs lowest quartile 2.68; 95% CI 1.38 to 5.21) were significantly associated with diabetes risk in multiethnic analyses and were influenced by race/ethnicity.
Conclusions These results confirm the importance of PA and sedentary behavior on diabetes risk in a multiethnic population and demonstrate potential variations across race/ethnic groups.
- Type 2 Diabetes
- Physical Activity Epidemiology
- Sedentary Behaviors
- Racial Differences
This is an Open Access article distributed in accordance with the Creative Commons Attribution Non Commercial (CC BY-NC 4.0) license, which permits others to distribute, remix, adapt, build upon this work non-commercially, and license their derivative works on different terms, provided the original work is properly cited and the use is non-commercial. See: http://creativecommons.org/licenses/by-nc/4.0/
Statistics from Altmetric.com
Key messages
Higher physical activity and lower leisure sedentary behaviors were inversely associated with incident type 2 diabetes in this multiethnic analysis.
The associations between physical activity/sedentary behaviors and incident type 2 diabetes may vary by race/ethnicity with most associations only being significant in non-Hispanic whites.
The associations between physical activity and incident type 2 diabetes may vary by family history of diabetes, with most associations being only significant in stratified analysis in participants without a family history of diabetes, although formal interaction testing was non-significant except for television viewing time.
Introduction
The prevalence of type 2 diabetes has been increasing worldwide reaching epidemic proportions in the USA.1 Several trials demonstrate that lifestyle modification combining weight loss and physical activity (PA) reduces the short-term and long-term incidence of type 2 diabetes in high-risk participants (ie, those with impaired glucose tolerance).2–5 The beneficial effect of PA on the incidence of type 2 diabetes has also been demonstrated in observational studies, as detailed in a meta-analysis demonstrating the protective influence of several types of moderate intensity PA.6 Epidemiological evidence also suggests that sedentary behavior (eg, television watching) is associated with increased risk of type 2 diabetes.7 ,8 Many prior studies either were conducted solely in men or women, or did not include or stratify by the different US racial/ethnic groups: which is of concern given the prevalence of type 2 diabetes is substantially higher in non-white US populations.1 We therefore explored the association of different measures of PA and sedentary behaviors with incident type 2 diabetes in a large, contemporary multiethnic population. Given the racial/ethnic differences in diabetes prevalence and mechanisms linking PA and improved glucose metabolism including muscle fiber type, fatty acid oxidation, and cardiorespiratory fitness,9 we hypothesized that the association of PA and sedentary behavior with incident type 2 diabetes varies by race/ethnicity. We also assessed the extent to which this association is similar across categories of body mass index (BMI), dietary intake, and family history of diabetes.
Methods
The Multi-Ethnic Study of Atherosclerosis (MESA) is a population-based sample of 6814 men and women from four racial/ethnic groups (38% non-Hispanic white (NHW), 28% African-American (AA), 22% Hispanic-American (HA), and 12% Chinese-American (CA)) aged 45–84 years without clinical cardiovascular disease (CVD) prior to recruitment. Details regarding MESA's design and objectives have been published.10 The study was approved by the Institutional Review Boards of each site, and all participants gave written informed consent.
Briefly, persons interviewed by phone who reported a history of CVD were excluded and those eligible were invited to a clinic for examination. During the baseline examination (2000–2002), standardized questionnaires and calibrated devices were used to obtain demographic data, tobacco usage, medical conditions, current prescription medication usage, weight, waist circumference, and height. BMI was calculated as weight (kilos)/height2 (meters). Resting seated blood pressure was measured three times using a Dinamap automated oscillometric sphygmomanometer (model Pro 100, Critikon, Tampa, Florida, USA); the last two measurements were averaged for analysis. Education was classified into the following five categories: <high school, high school, some college/technical school certificate or associate degree, bachelor's degree, and graduate or professional school. Current occupation status was classified into 10 categories: homemaker, employed (full time, part time, or on leave due to ill health, or on leave due to non-health related issues), unemployed (<6 or >6 months), and retired (not working, working, or volunteering). Participants were asked about current or former cigarette smoking. Family history of diabetes was assessed by questionnaire at examination 2 and was unavailable for participants who missed that examination. Dietary intake was assessed by the MESA food frequency questionnaire, a self-administered modified-block-style, 120-item questionnaire adapted from the Insulin Resistance Atherosclerosis Study instrument.10 We created a modified American Heart Association (AHA) Ideal diet score11 ,12 with five components including fruits and vegetables ≥4.5 cups/day, fish ≥2 3.5 ounce servings per week (non-fried), fiber-rich whole grains ≥3 1 ounce-equivalent servings/day, sodium <1500 mg/day, and sugar-sweetened beverages ≤450 kcal (36 ounces)/week. Participants were given 1 point per ideal component and the score was categorized: 0–1 (poor), 2–3 (intermediate), and 4+ (ideal) levels of dietary intake. Intermediate and ideal dietary intakes were collapsed into one category due to the limited number of participants with ideal dietary intake.
Physical activity
The MESA Typical Week Physical Activity Survey (TWPAS), adapted from the Cross-Cultural Activity Participation Study, was designed to identify the time and frequency spent in various PAs during a typical week in the past month.13 The MESA TWPAS had the following summary measures: total minutes/week and total metabolic equivalents of task (MET)-hours/week at three intensity levels (light, moderate, vigorous). The survey also inquired about the typical pace at which participants walked in five categories ranging from very slow to brisk. We excluded participants who did not fill out the survey (n=19). We used the following derived variables: moderate–vigorous PA (sum of moderate and vigorous MET-hours/week), intentional exercise variable (sum of walking for exercise, sports/dancing, and conditioning MET-hours/week) that have been used in prior analyses.9 We also considered vigorous PA alone, typical walking pace, total leisure sedentary behavior (sum of sedentary behaviors including reading and television), and television watching alone. We categorized activity variables into quartiles where appropriate (moderate–vigorous, leisure, and exercise). Too few participants reported sufficient vigorous activity to construct quartiles, thus a dichotomous variable was created (any vigorous activity vs none). The walking pace variable was collapsed from five to three levels as few persons reported the extremes. In addition to each PA variable considered individually, we placed several PA constructs in the same model. Preliminary analyses suggested PA measures and sedentary behaviors were associated with type 2 diabetes incidence independent of each other (see online supplementary table S1 & figure S1). Thus, an activity score was created by reverse ordering sedentary quartiles (from 0 to 3: 0=most sedentary and 3=least sedentary) and adding this to moderate–vigorous PA quartiles (range 1 (least MVPA) to 4 (highest MVPA)) to create a score ranging from 1 to 7, with 7 representing participants with the most MVPA and least sedentary activity.
Supplemental material
Laboratory assessment
Fasting blood samples were drawn and processed using a standardized protocol and sent for measurement of glucose and inflammatory markers to central laboratories.14 Serum glucose was measured by rate reflectance spectrophotometry using thin film adaptation of the glucose oxidase method on the Vitros analyzer (Johnson & Johnson Clinical Diagnostics). Insulin was determined by a radioimmunoassay method using the Linco Human Insulin Specific RIA Kit (Linco Research). The homeostasis model assessment of insulin resistance (HOMA-IR) was calculated as insulin mU/L×(glucose mg/dL×0.055)/22.5.15
Diabetes definition
Participants with type 2 diabetes at baseline, defined as using hypoglycemic drugs or fasting blood glucose ≥7.0 mmol/L (126 mg/dL), were excluded from these analyses. Persons were considered to have impaired fasting glucose (IFG) if they did not have type 2 diabetes by the preceding criteria and their fasting blood glucose was ≥5.6 and <7.0 mmol/L (>100 and <126 mg/dL) in accordance with the ADA definition.16 Persons newly using hypoglycemic medication (per the medication inventory) or having fasting glucose ≥7 mmol/L (126 mg/dL) at one of four subsequent examinations (the last follow-up visit occurring in 2010–2012) were considered to have incident type 2 diabetes. We defined time of incident type 2 diabetes as the midpoint between last examination without type 2 diabetes and the examination at which type 2 diabetes developed.17
Statistical analysis
Descriptive statistics were used to compare the baseline characteristics of participants (table 1) using appropriate parametric or non-parametric tests for continuous variables, and the χ2 test for categorical variables. Unadjusted incidence rates by activity category and activity score were calculated using person-time analysis assuming a Poisson distribution. Participants who did not develop type 2 diabetes were censored at the last attended follow-up examination. Incidence rate ratios were assessed using the Mantel-Cox method. Cox proportional hazards modeling was used to estimate HRs associated with quartiles of activity. We conducted sequential modeling with model 1 including the activity variable of interest, study site, age, race/ethnicity (except for in race/ethnicity-stratified analysis), sex, education, occupation status, systolic blood pressure, antihypertensive medication use, and smoking. The subsequent model (model 2) included model 1 variables plus BMI, which was considered as a potential mediator of the association of PA with incident type 2 diabetes. All covariates were defined as their value at the baseline visit. The p for trend was calculated using the log-rank test. Potential interactions between activity variables and age, race/ethnicity, sex, or family history of DM were tested by the insertion of an interaction term in the model and calculation of the p value using the likelihood-ratio test. Statistical significance was defined as two-sided α<0.05. Analyses were performed using Stata V.13.1 (Statacorp, College Station, Texas, USA).
Characteristics of participants by race/ethnicity in the Multi-Ethnic Study of Atherosclerosis 2000–2012*
Results
Univariate analyses
Our final study sample included 5829 individuals, after excluding 903 participants with diabetes at baseline, 34 missing diabetes status at their last follow-up, 47 with missing data on baseline covariates, and 1 without PA data. The baseline characteristics of participants, stratified by race–ethnicity, are presented in table 1. Most characteristics were different across race–ethnicity including higher BMI, systolic blood pressure, IFG, and family history of diabetes in AA/HA. Only one-third of participants reported any vigorous PA in a typical week; NHW were more likely to report vigorous PA and a faster walking pace compared with non-whites. Exercise PA was lower among HA and CA participants compared with NHW and AA.
There were 655 participants with incident type 2 diabetes during a median follow-up time of 11.1 years (incidence rate 11.4 per 1000 person-years). The incidence was highest among HA and AA (table 1, p<0.0001). Participants who developed type 2 diabetes were heavier (BMI 31.0 vs 27.6 kg/m2), with higher waist circumference (105.0 vs 96.1 cm), systolic blood pressure (130.2 vs 125.0 mm Hg), fasting glucose (101.1 vs 88.1 mg/dL), HOMA-IR (3.3 vs 2.0), and family history of diabetes (48.6% vs 32.5%; all comparisons p<0.0001, see online supplementary table S2). Individuals were less likely to develop type 2 diabetes if they reported some (n=1914) versus no (n=3915) vigorous activity (9.5% vs 12.4%, p<0.05) and if they had a walking pace >4 vs <2 mph (9.0% vs 15.3%; p<0.001; table 2). In contrast, total moderate–vigorous PA (MET-hours/week) was not different between those who did and did not develop type 2 diabetes, 98.5 vs 97.0 (p=0.72). Leisure sedentary behavior and television watching were greater in those who developed, compared with those who did not develop type 2 diabetes 3.7 vs 3.3 hours/day (p<0.001) and 2.3 vs 2.0 hours per day (p<0.0001), respectively. In addition, the activity score was lower, 3.9 vs 4.0 (p=0.02), among those who developed type 2 diabetes (online supplementary table S2).
The association between PA/sedentary behaviors categories and baseline prevalence of obesity, impaired fasting glucose (2000–2002), and T2DM incidence from 2002 to 2012 in MESA
Table 2 shows the distribution of obesity and IFG, as well as type 2 diabetes incidence rates across activity categories. Higher levels of exercise PA and walking pace were associated with less obesity and IFG, and lower rates of incident type 2 diabetes, while increasing amounts of sedentary behavior were associated with more obesity, IFG, and higher incident type 2 diabetes. Increasing activity score was also associated with more favorable parameters.
Multivariable analyses
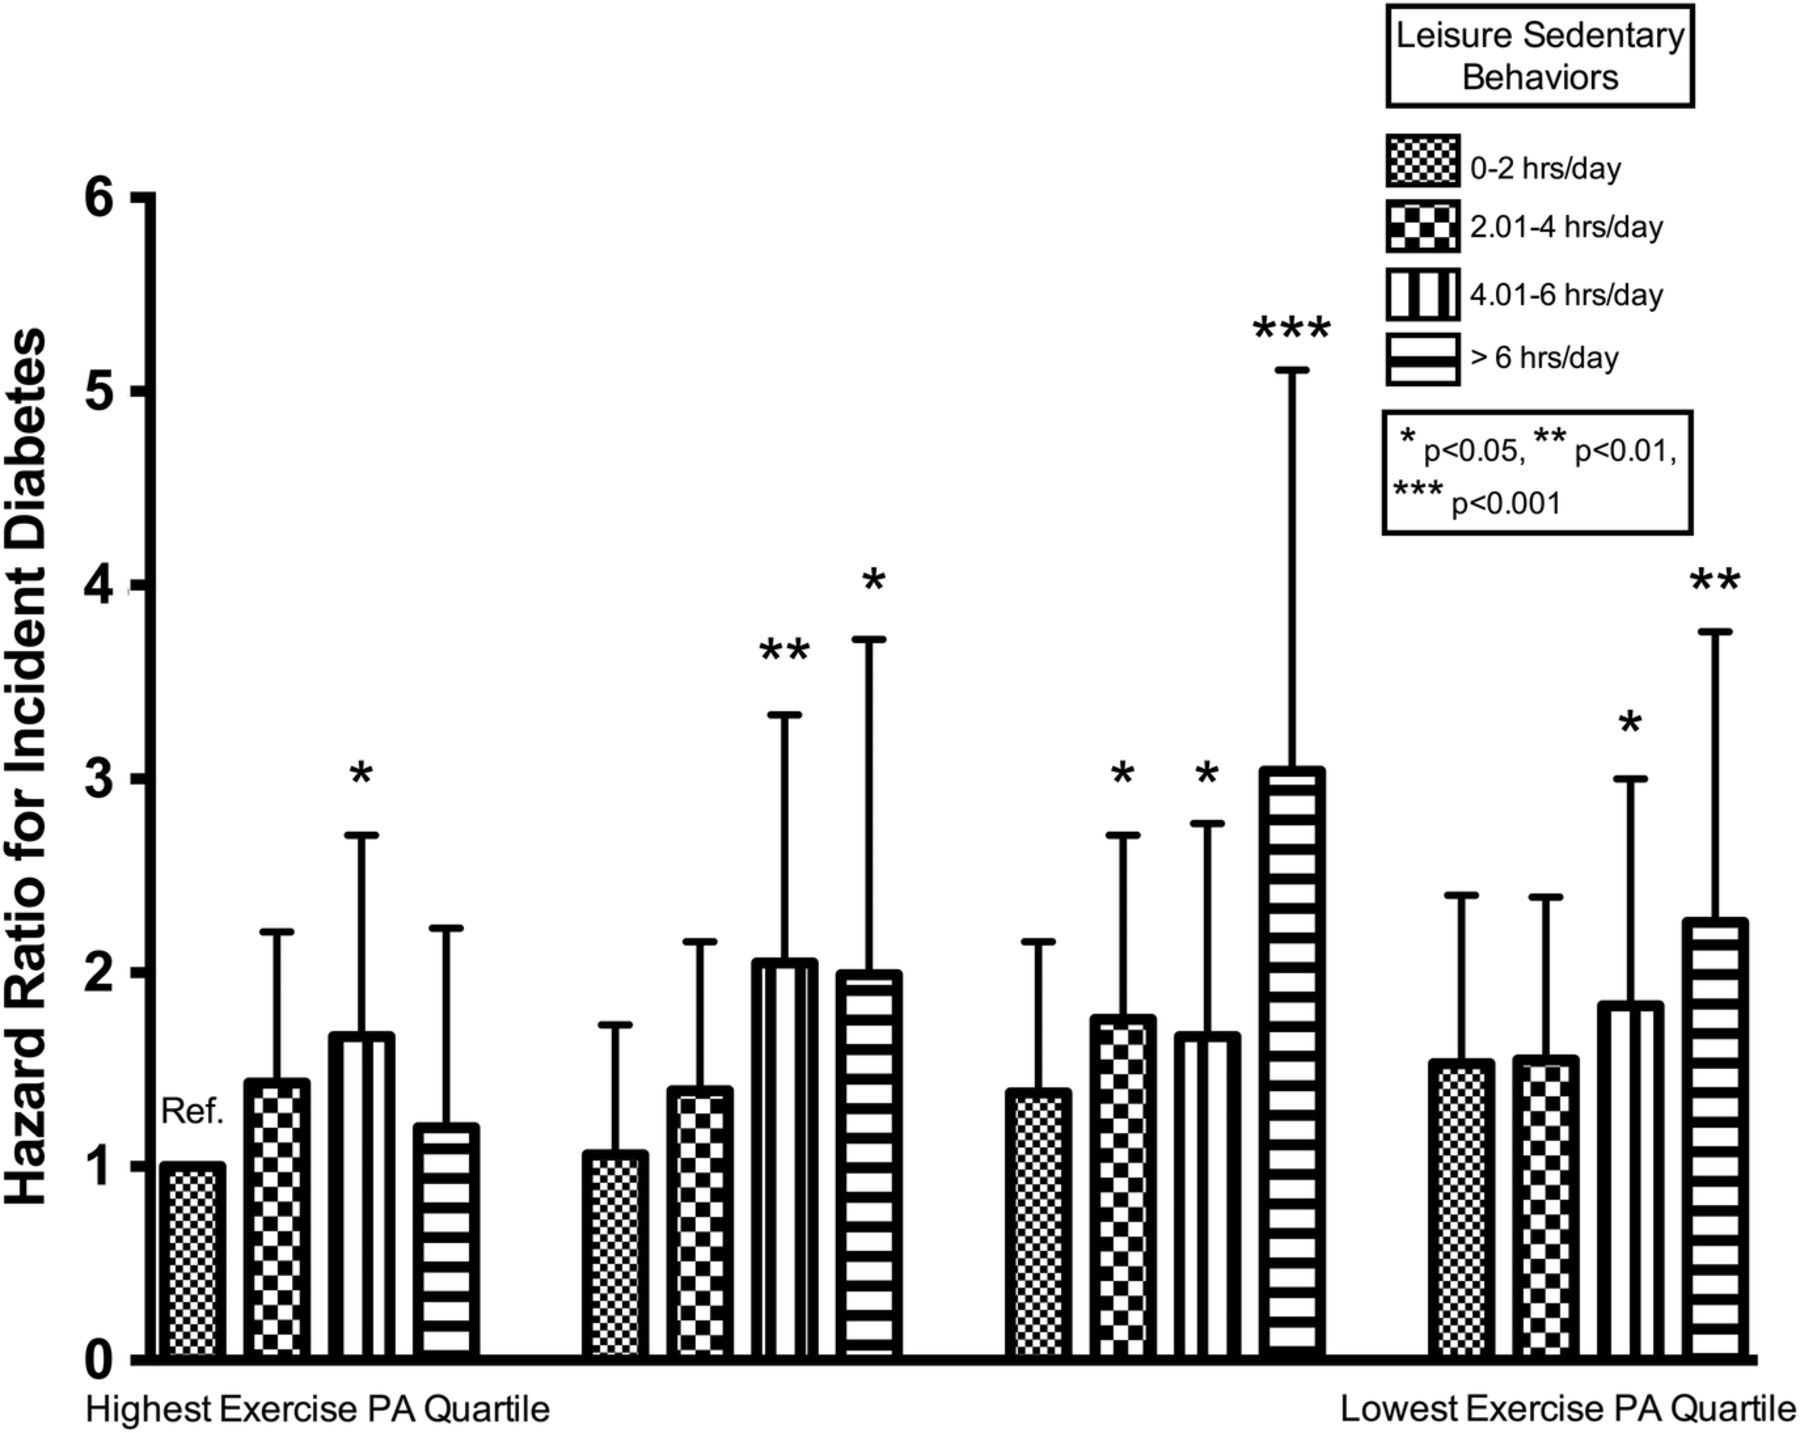
The HRs for type 2 diabetes associated with activity categories are presented in table 3 and online supplementary figure S2. After adjustments for model 1 variables, a brisk walking pace (HR 0.67, 95% CI 0.54 to 0.84), exercise PA (HR for highest vs lowest quartile 0.79, 95% CI 0.63 to 0.98), and any vigorous PA (HR for any vs none 0.79, 95% CI 0.66 to 0.91) were inversely associated with type 2 diabetes risk, whereas increased leisure sedentary behavior (HR for 0 to 2 vs > 6 hours/day 1.65, 95% CI 1.26 to 2.14) and television watching time (HR for 0–2 vs > 6 hours/day 2.68, 95% CI 1.38 to 5.21) were positively associated with type 2 diabetes risk. With further adjustment for BMI (model 2), the inverse association between any vigorous PA and type 2 diabetes risk (HR 0.82, 95% CI 0.68 to 0.98), additionally, the positive association between leisure sedentary behavior and type 2 diabetes risk (HR 1.39, 95% CI 1.06 to 1.81), remained statistically significant. The association between activity score modeled as a categorical variable and incident type 2 diabetes is presented in table 3 and online supplementary figure S2. Participants in the most favorable categories, activity score 6 or 7 (high exercise, low sedentary behavior), was associated with a 45–50% reduction in type 2 diabetes risk after adjustment for model 1 variables, and a 36–42% reduction after accounting for BMI. The joint relationship between exercise and sedentary behavior is presented in figure 1.
Association between activity measures and incident type 2 diabetes in all participants (A) and (B) stratified by race/ethnicity

Exercise PA in MET-hours/week versus total leisure sedentary behavior in hours/day and incident type 2 diabetes mellitus from 2000 to 2012. Data are included for 5829 participants followed for a median of 11.1 years. Using Cox proportional hazards modeling, we calculated the hazard ratios using the highest exercise, lowest sedentary behavior category as the referent group. The model included the exercise–sedentary behavior category, study site, age, race, sex, education, current occupation status, systolic blood pressure, antihypertensive medication use, and smoking. *p<0.05, **p<0.01, and ***p<0.001 versus the referent category. MET, metabolic equivalents of task; PA, physical activity.
In quartiles of exercise PA highest to lowest, an independent deleterious association of increasing sedentary behavior is apparent in each quartile of exercise PA. We found no consistent evidence for interactions between PA variables and age or sex. There were significant interactions between television viewing time, BMI, and family history of diabetes. Stratifying our analysis by BMI status, PA, and sedentary behaviors exhibited a trend toward greater associations in overweight participants with a significant difference (p<0.05) for television viewing time (overweight, HR 4.98 (95% CI 1.8 to 13.7) vs obese, HR 1.74 (95% CI 0.71 to 4.24)). Stratification by AHA ideal diet score (poor category vs intermediate/ideal category) revealed an association of PA and activity score with type 2 diabetes risk reduction in those with an intermediate/ideal diet with no differences with sedentary behaviors, but formal effect modification testing was non-significant (see online supplementary tables S3 and S4).
PA and incident type 2 diabetes by race/ethnicity
We found evidence of modification by race/ethnicity for the association of total leisure sedentary behaviors and risk of type 2 diabetes (p<0.05; see online supplementary table S4). Vigorous PA was associated with a reduction in type 2 diabetes risk in NHW by 35% (HR 0.65, 95% CI: 0.48, 0.89), whereas there were smaller non-significant reductions in CA (6%), AA (12%), and HA (13%; table 3). There was a graded association of leisure sedentary behavior and incident type 2 diabetes in NHW (HRs for 0 to 2, 2.01 to 4, 4.01 to 6, and >6 hours categories vs referent group 0 to 2 hours: 2.03 (95% CI 1.38 to 2.98), 2.11 (95% CI 1.34 to 3.34), and 3.04 (95% CI 1.85 to 5.00), respectively, p for trend <0.0001), which was not seen in CA, AA, or HA (table 3). There was a significant monotonic trend on the association of activity score with incident type 2 diabetes (p for trend <0.01) in NHW (see online supplementary figure S3 and table S5 (incident rates)), with the largest decreases in type 2 diabetes incidence of 65–70% at activity scores of 6 and 7 compared with activity score of 1. CA, HA, AA showed similar trends in reduction of type 2 diabetes risk at activity scores of 6 and 7 but of a lower magnitude 51–55% among CA (p for trend=0.49), 26–29% among AA (p for trend=0.56), and 16–28% among HA (p for trend <0.05).
PA and incident type 2 diabetes by family history of diabetes
In family history of diabetes stratified analyses, participants with no family history of diabetes had a greater inverse association in type 2 diabetes incidence with PA (walking pace, exercise, and moderate–vigorous PA), whereas total leisure sedentary behavior was positively associated with incident type 2 diabetes in participants with a family history of diabetes (see online supplementary table S6). Increasing activity score in participants with no family history of diabetes was inversely associated with diabetes incidence (activity score 6, HR 0.51 (95% CI 0.32 to 0.81) and activity score 7, HR 0.47 (95% CI 0.27 to 0.83), p for trend <0.01). Testing for interaction revealed significant interaction for television viewing time (p=0.049; see online supplementary table S4), where TV watching >6 vs 0 to 2 hours was associated with a HR 3.55 (95% CI 1.66 to 7.60) among those with no family history of diabetes, but was non-significant among those with a family history of diabetes.
Discussion
In this large contemporary multiethnic cohort study, the incidence rate of type 2 diabetes was 11.4 per 1000 person-years with variation of the incidence rate across racial/ethnic groups consistent with contemporary analysis in US middle-aged populations.18 ,19 Vigorous PA, exercise PA and faster walking pace are inversely associated with incident type 2 diabetes and leisure sedentary behaviors are positively associated with type 2 diabetes, consistent with previous studies in predominantly NHW cohorts.7 ,20–22 The independent protective associations of vigorous PA and activity score, along with the deleterious associations of leisure sedentary behavior on type 2 diabetes risk remained after full adjustment including BMI. A key finding is that the magnitude of the associations varied by race/ethnicity, and the statistical significance of the associations in the overall cohort is mainly driven by the NHW subgroup, as the AA, HA, and CA groups only achieved p<0.05 among AA for TV watching and HA for activity score. The duality of these findings combined with the greater burden of type 2 diabetes in racial/ethnic minority populations1 suggests other factors that vary by race/ethnicity may play important roles in the development of type 2 diabetes in non-NHW populations including diet,23 social determinants of health,24 ,25 chronic stress/allostatic load,25–27 sleep insufficiency,25 ,28 and inflammation.29–31 While our findings of potential racial/ethnic differences in the association of activity measures with type 2 diabetes incidence should be considered with some caution due to sample size variation in race/ethnic groups, there are some plausible biological mechanisms that may explain these findings. The response of glucose metabolism to PA has been measured in NHW populations with relatively consistent improvements in insulin sensitivity, even without weight loss, although this is debated.32 There are limited data on the glucometabolic response to PA in AA and HA. In the HERITAGE Family Study, a 20-week trial of thrice weekly exercise in AA and NHW, AA had a greater increase in fasting glucose with exercise versus NHW, although there were reductions in fasting insulin in both groups.33 Potential components of improved glucose metabolism with PA include skeletal muscle mitochondrial mass, function, and aerobic capacity.34 ,35 Aerobic capacity was tested in a 6-month trial of aerobic exercise training in AA and NHW postmenopausal women. The NHW women had a greater increase in cardiorespiratory fitness with sustained resting metabolic rate (RMR), whereas in AA women, RMR declined over the course of the trial.36 ,37
Among HA, non-obese, non-diabetic individuals have greater insulin resistance versus NHW, which persists even after accounting for chronic exercise, acute exercise, total and abdominal fat distribution.38 ,39 HA have higher levels of tumor necrosis factor-α (TNF-α) than NHW or AA, with increasing TNF-α being correlated with insulin resistance.40 ,41 The improvement in insulin sensitivity with a short-term diet–exercise intervention is similar in HA and NHW. However, because at the outset HA are less insulin sensitive compared with NHW, the ethnic gap in insulin sensitivity remained.42 Our study reflects these findings, with ethnic minorities having no statistically significant inverse associations with PA and incident type 2 diabetes.
Family history is a known risk factor for type 2 diabetes, functioning through gene–environment interactions.43 In this study, participants with no family history of diabetes had a trend toward greater inverse associations of PA, faster walking pace, and a higher activity score with type 2 diabetes incidence, whereas sedentary behavior increased type 2 diabetes risk irrespective of the family history of diabetes (see online supplementary table S5), although formal effect modification testing was only significant for television viewing time. Thus, sedentary behavior may function independent of gene–environment interactions. Studies of the relationship between PA and gene variants associated with worsened glucose metabolism and type 2 diabetes have been mixed with PA-specific analysis showing no interaction44 or diminished interactions,45 although lifestyle interventions, including diet and exercise with weight loss, have shown positive interactions.46 ,47
Mechanisms of PA, walking pace and sedentary behavior, and incident type 2 diabetes
PA reduces blood glucose acutely and chronically through insulin-dependent and insulin-independent actions including increased GLUT-4 mediated uptake of glucose into muscle; reduced insulin resistance; and reduction in body weight, adiposity, and inflammation, which have been extensively reviewed previously.48 ,49 Walking pace has been cross-sectionally associated with insulin resistance independent of obesity in non-diabetic older men.50 Equivalent energy expenditures from walking or vigorous PA result in comparable magnitudes of reduction in type 2 diabetes risk.20 Sedentary behavior has been associated with adiposity;7 adiposity-associated inflammation;51 and reduced lipoprotein lipase activity, clearance of triglycerides, clearance of an oral glucose load, and glucose-stimulated insulin secretion.52 Thus, sedentary behavior and vigorous PA have opposing effects on glucose metabolism. Lifestyle interventions such as the Diabetes Prevention Program (DPP) not only increase PA but also reduce sedentary behaviors including television watching,53 which is beneficial in improving glucose metabolism. In the lifestyle intervention of the DPP, all ethnicities had similar reductions in type 2 diabetes, which was significantly associated with the degree of weight loss.54 Weight loss is strongly associated with caloric reduction, whereas PA has a greater association with weight loss maintenance.55 The high correlation between weight loss and lower diabetes risk may explain some of our findings, given that AA and HA had higher BMI and waist circumference.
Strengths and limitations
There are several strengths of our study including a socioeconomically diverse, multiethnic US population with over a decade of follow-up, allowing broad generalizability of our findings, as well as use of a validated PA questionnaire with calculation of metabolic equivalents, and documentation of type 2 diabetes with fasting glucose, medication use, and physician diagnosis, unlike some prior studies that rely on self-reported diabetes. Despite the strengths of this study, there are several potential limitations. PA and sedentary behaviors were self-reported, and the time frame queried about was their typical activities within the last month. Therefore, discrepancies with actual activity levels may exist, and depending on the season in which participants were examined, the prior month may not be representative of customary activities. There is also potential discordance in PA measured using self-report versus objective instruments among assorted race/ethnic groups compared with NHWs. AAs self-report less PA,56 ,57 but AA men and women have similar levels of objectively measured PA.57 ,58 HAs self-report lower PA levels compared with NHWs, but have higher objectively measured levels compared with NHWs, which may be due to differences in work PA.59 ,60 Two UK-based diabetes prevention studies found that South Asians and NHW groups undertook similar levels of objectively measured PA despite self-reported estimates being ∼40% lower in the South Asian group.61 Overall, objective measures minimize the differences in moderate–vigorous PA among racial/ethnic groups.59 ,62 In our study, the only large differences in PA measure were for any vigorous activity and greater walking pace among NHWs. Another potential bias is the variation in sample size for the race/ethnic groups with potential power implications for detecting significant race/ethnic interactions in stratified analyses. Because of multiple comparisons, there is the potential for type II error. Thus, we accounted for multiple comparisons using a Bonferroni correction, which did not fundamentally alter the significance of our findings. We were unable to distinguish between type 1 and type 2 diabetes, but incident type 1 diabetes is extremely uncommon in older adults, so we assume a predominance of type 2 diabetes. The distinction of using metformin for prediabetes versus diabetes was not made. It is important to note that although prediabetes is an indication for metformin, not all patients with prediabetes would be eligible for this medication and the medication is rarely prescribed to those eligible in real-world practice. Only about 3.7% of 17 352 insured patients with prediabetes and eligible for metformin during the 2010–2012 period were actually prescribed the medication.63 Such a proportion is remarkably low; it is therefore reasonable to assume the majority of metformin was prescribed for diabetes.
Implications
The strong association between sedentary behavior and type 2 diabetes risk indicates that interventions may benefit from including components that specifically address reducing sedentary behavior. For example, sitting interspersed with short breaks of low-intensity activity (such as walking) or standing may prevent the deleterious effects of prolonged sitting but requires further study.64–66 Lifestyle interventions with PA and caloric intake reduction with subsequent weight loss are shown to be beneficial for type 2 diabetes risk reduction,54 but the independent association of activity measures and type 2 diabetes reduction remains unclear in minority ethnic populations. Given AA and HA have a higher risk of developing type 2 diabetes compared with NHWs, further study of increased PA and reduced sedentary behavior as methods of prevention are warranted to better understand the independent impact of these interventions in US racial/ethnic minority groups.
Conclusion
The incidence of type 2 diabetes was significantly inversely associated with exercise PA, vigorous PA, typical walking pace, and conversely positively associated with sedentary behaviors. The magnitude of these associations potentially varies by race/ethnicity, family history of diabetes and BMI, which should be evaluated in studies with larger sample sizes. Further tailoring of programmes to increase exercise PA, vigorous PA, walking pace, and decrease sedentary behaviors may lead to reductions in incident type 2 diabetes in all ethnicities. Further investigation into complementary risk reduction strategies may be especially relevant for ethnic minorities and those with a family history of diabetes.
Acknowledgments
The authors thank the other investigators, the staff, and the participants of the MESA study for their valuable contributions. A full list of participating MESA investigators and institutions can be found at http://www.mesa-nhlbi.org.
References
Footnotes
Contributors JJJ was involved in data analysis and wrote manuscript. JBE-T was involved in data analysis, contributed to methods and discussion, reviewed/edited manuscript. SHG, NSJ, DJ, GLB and DV reviewed/edited manuscript. HC contributed to methods, reviewed/edited manuscript. MRC contributed to methods and discussion, reviewed/edited manuscript. PO contributed to discussion, reviewed/edited manuscript, and AGB researched data, contributed to methods and discussion, reviewed/edited manuscript.
Funding This work was supported by National Institutes of Health, National Heart Lung and Blood Institute grant numbers N01-HC-95159 through N01-HC-95165 and N01-HC-95169. JJJ was supported by the National Institute of Diabetes, Digestive, and Kidney Diseases institutional training grant T32 DK062707.
Competing interests None declared.
Ethics approval The study was approved by the Institutional Review Boards of each MESA site.
Provenance and peer review Not commissioned; externally peer reviewed.
Data sharing statement Data from MESA Examinations 1-5 are available on the NIH-NHLBI Biologic Specimen and Data Repository Information Coordinating Center (BioLINCC).