Article Text

Abstract
Objective To describe the natural history of glycemia (as measured by glycated hemoglobin (HbA1c)) over 12 years using group-based trajectory modeling (GBTM), and to examine baseline predictors of trajectory.
Research design and methods HbA1c data collected at ages 26, 32 and 38 in the long-running, prospective Dunedin Multidisciplinary Health and Development Study were used to assign study members (n=893) to trajectories applying GBTM. A generalization of the model allowed the statistical linking of baseline demographic, smoking and anthropometric characteristics to group membership probability.
Results Mean HbA1c increased with age, as did prevalence of prediabetes, diabetes and dysglycemia. The greatest increase occurred between ages 26 and 32. Glycemic health status at age 26 predicted glycemic health status at age 38. 3 HbA1c trajectory groups were identified: ‘low’ (n=98, 11.0%); ‘medium’ (n=482, 54.0%); and ‘high’ (n=313, 35.0%) with mean HbA1c of 29.6, 34.1, and 38.7 mmol/mol, respectively, at age 38. High waist circumference (≥880 mm for women and ≥1020 mm for men), high waist-height ratio (≥0.50), and being a smoker at age 26 predicted membership of the least favorable trajectory over the next 12 years. High body mass index (≥30) at age 26 did not predict of trajectory.
Conclusions Trajectories of HbA1c are established relatively early in adulthood. HbA1c levels, waist circumference, waist-height ratio, and smoking status at age 26 are valid clinical predictors for future dysglycemic risk. The identification of HbA1c trajectories and their predictors introduces the possibility of an individualized approach to prevention at an earlier stage than is currently done.
- HbA1c
- BMI
- Smoking
- Waist Circumference
This is an Open Access article distributed in accordance with the Creative Commons Attribution Non Commercial (CC BY-NC 4.0) license, which permits others to distribute, remix, adapt, build upon this work non-commercially, and license their derivative works on different terms, provided the original work is properly cited and the use is non-commercial. See: http://creativecommons.org/licenses/by-nc/4.0/
Statistics from Altmetric.com
Key messages
A greater risk of poor metabolic outcomes is established by the mid-20s.
Waist circumference, waist-height ratio, and smoking status in the mid-20s are valid clinical predictors for future dysglycemic risk.
Public health intervention/prevention efforts should be targeted early in the life course.
Introduction
Several developmental trajectory modeling techniques—including linear modeling, latent class growth analysis, linear mixed modeling and group-based trajectory modeling (GBTM)1–6—have been used to track glycated hemoglobin (HbA1c) over time. However, that research has focused on populations with type 1 diabetes;3–6 on older populations;2 or on populations with type 2 diabetes.1 There is no developmental trajectory research following initially healthy populations from young adulthood into early middle age, a potentially important time for intervention aimed at preventing progression to type 2 diabetes.
This study had two objectives. We aimed first to describe the natural history of glycemia, as measured by HbA1c over 12 years—between the mid-20s and late-30s—using GBTM to identify latent HbA1c trajectory groups. The second aim was to examine associations between trajectory group membership and sociodemographic characteristics, anthropometric covariates of dysglycemia and smoking.
Research design and methods
This study involved data collected during the ages 26, 32 and 38 assessments of the Dunedin Multidisciplinary Health and Development Study (DMHDS), and the usage of novel and advanced statistical techniques to analyze these data. The DMHDS is a longitudinal epidemiological study of a birth cohort of 1037 children born at the Queen Mary Hospital, Dunedin, New Zealand between 1 April 1972 and 31 March 1973.7 These 1037 children represent 91% of the 1139 eligible children. Those included were no different from those not included.7 The Study has a very high retention rate and a wealth of physical, mental and psychosocial data. A total of 980, 972 and 961 individuals participated in the ages 26, 32 and 38 assessments, respectively; this represents over 95% of the surviving cohort at each age. Ethics approval for the study was granted by the Otago Research Ethics Committee, and participants gave informed consent.
Outcome variable
HbA1c was measured during assessments at ages 26, 32, and 38. Blood samples collected at ages 26 and 32 were assayed using ion-exchange high-performance liquid chromatography on a BioRad Variant II, and at age 38 on a BioRad Variant II Turbo (Bio-Rad, Hercules, California, USA). No data were collected for pregnant women, and four individuals with known type 1 diabetes were excluded from all analyses. In New Zealand, HbA1c is now exclusively reported using the International Federation of Clinical Chemistry (IFCC) SI units of mmol/mol.8 The prevalence of diabetes and prediabetes was defined according to the American Diabetes Association guidelines, whereby diabetes was defined as ≥48 mmol/mol HbA1c, and prediabetes was 39–47 mmol/mol; dysglycemia was defined as ≥39 mmol/mol, and encompassed both prediabetes and diabetes.9
Covariates
Anthropometric parameters were assessed at ages 26, 32, and 38. Height and weight were determined (to the nearest 1 mm and 0.1 kg, respectively) using calibrated scales, and body mass index (BMI; kg/m2) was computed. Waist circumference (WC) was recorded by measuring girth to the nearest 1 mm at the level of the noticeable waist narrowing (approximately halfway between the costal border and the iliac crest). Hip girth was taken as the perimeter at the level of the maximal gluteal protuberance. Measurements were taken twice and the mean of two readings was calculated. Waist-hip ratio and waist-height ratio were recorded as the ratio of the WC to that of the hips, and to that of the person’s height, respectively.
In addition to these outcome covariates being used as continuous variables, BMI, WC, waist-hip ratio and waist-height ratio were also dichotomized according to established guidelines for greater risk of cardiometabolic complications. The WHO classifies BMI≥30 as obese.10 ,11 Guidelines for WC differ according to sex, ethnicity, country and organizations, but women and men are generally considered to be at a much higher risk at ≥880 and ≥1020 mm, respectively.11 Abdominal obesity is defined as a waist-hip ratio ≥0.85 for females, and ≥0.90 for males.12 A waist-height ratio ≥0.50 is generally regarded as being of higher cardiometabolic risk for both sexes.13 ,14
Measures of socioeconomic status (SES) at ages 26, 32 and 38 were obtained from study members using an occupationally based classification of SES.15 On the basis of this scale, individuals were assigned to the ‘high’, ‘medium’, or ‘low’ SES group. Study members were questioned on their smoking history at ages 26, 32 and 38. Those who gave a positive response to the question ‘Have you smoked every day for one month or more of the previous 12 months?’ were categorized as current smokers, and those who had never smoked were categorized as non-smokers.
Data analysis
Analyses were undertaken using Stata IC V.12.0 for Windows (StataCorp 2011, Stata Statistical Software: Release 12, College Station, Texas, USA). Descriptive analyses were carried out first. Then HbA1c measures at ages 26, 32 and 38 were used to assign study members to trajectories applying GBTM. GBTM is a specialized application of finite mixture modeling, and is a valuable method for describing developmental trajectories.16 It identifies (rather than assumes a priori) groups of distinctive trajectories by gathering individuals into a small number of groups that show statistically similar trajectories.16 Trajectory groups are latent strata; that is, they are groups of individuals following approximately the same developmental course. Individuals do not actually belong to trajectory groups; rather, they are assigned a probability of group membership. GBTM can also be used to link baseline characteristics to the probability of group membership with this association being estimated simultaneously with the estimation of the trajectories themselves.16 Detailed information on the GBTM procedure is included in the online supplementary material.
Supplementary material
GBTM was undertaken using a Stata Plugin for estimating GBTMs.17 HbA1c was modeled using the censored normal distribution.16 ,17 GBTM handles missing data under the assumption that data are missing at random. We excluded participants who were missing HbA1c data at more than one data point. We used the Bayesian information criterion (BIC) as the criterion for model selection. When choosing between competing models, the model with the highest (least negative) value of BIC is preferred. However, this was moderated by: (1) a preference for a useful parsimonious model which fitted the data well; (2) close correspondence between each group's estimated probability and the proportion of study members classified to that group according to the maximum posterior probability assignment rule; (3) an average posterior probability value >0.7; (4) adequate sample numbers in each group; (5) reasonably narrow CIs; and (6) the odds of correct classification based on the posterior probabilities of group membership >5.16
Attrition analyses were conducted, and associations between trajectory groups and anthropometric covariates were tested for statistical significance using χ2 tests for proportions and Kruskal-Wallis tests for means. Statistical tests were two-tailed and the threshold for statistical significance was set at p<0.05.
GBTM allowed the statistical linking of covariates to group membership by relating individual baseline or ‘time-invariant’ characteristics to group membership probability. This enabled us to examine the associations between different baseline anthropometric measures and HbA1c trajectory group membership, while controlling for sex and low SES at baseline.
Results
Descriptive and attrition analyses
A total of 836, 858 and 891 participants had HbA1c assays at ages 26, 32 and 38, respectively. Mean HbA1c increased with age, as did the prevalence of prediabetes, diabetes and dysglycemia (table 1). There was an overall relative increase of 15.6% in mean HbA1c between ages 26 and 38, with the greatest increase between ages 26 and 32 (10.7% between ages 26 and 32, and 4.4% between ages 32 and 38). Almost one-fifth of the cohort was dysglycemic by age 38. The prevalence of dysglycemia by age 38 was strongly associated with mean HbA1c at age 32 (36.7 mmol/mol for those dysglycemic by age 38 vs 33.3 mmol/mol for those not dysglycemic by age 38, p<0.001; Mann-Whitney U test) and with mean HbA1c at age 26 (33.1 mmol/mol for those dysglycemic by age 38 vs 30.1 mmol/mol for those not dysglycemic by age 38, p<0.001; Mann-Whitney U test).
Demographic characteristics, smoking status, HbA1c measures and anthropometric measures at ages 26, 32 and 38. Proportions or SD in parentheses
Anthropometric measures (except for height) all increased over the 12 years; there were increases of 9.0%, 8.8%, 7.9%, 7.5% and 6.4%, respectively, for mean weight, mean BMI, mean WC, mean waist-hip ratio and mean waist-height ratio between ages 26 and 38 (table 1). Generally, the greatest increases were between ages 26 and 32, with smaller increases between ages 32 and 38. Likewise, the proportion of study members in the high-risk anthropometric groups increased steadily over the 12 years, more than doubling in the case of the high BMI group and high waist-height groups, almost tripling in the case of the high WC group, and increasing more than fivefold in the case of the high waist-hip group (table 1).
HbA1c was measured at two or more ages for 897 study members. The four most extreme outliers were removed because they gave rise to an analytically intractable four-person group. This left 893 study members included in the GBTM analysis. An attrition analysis found no differences between those included and those excluded with respect to sex, ethnicity, low SES, or smoking at ages 26, 32 or 38.
Identification of the GBTM groups
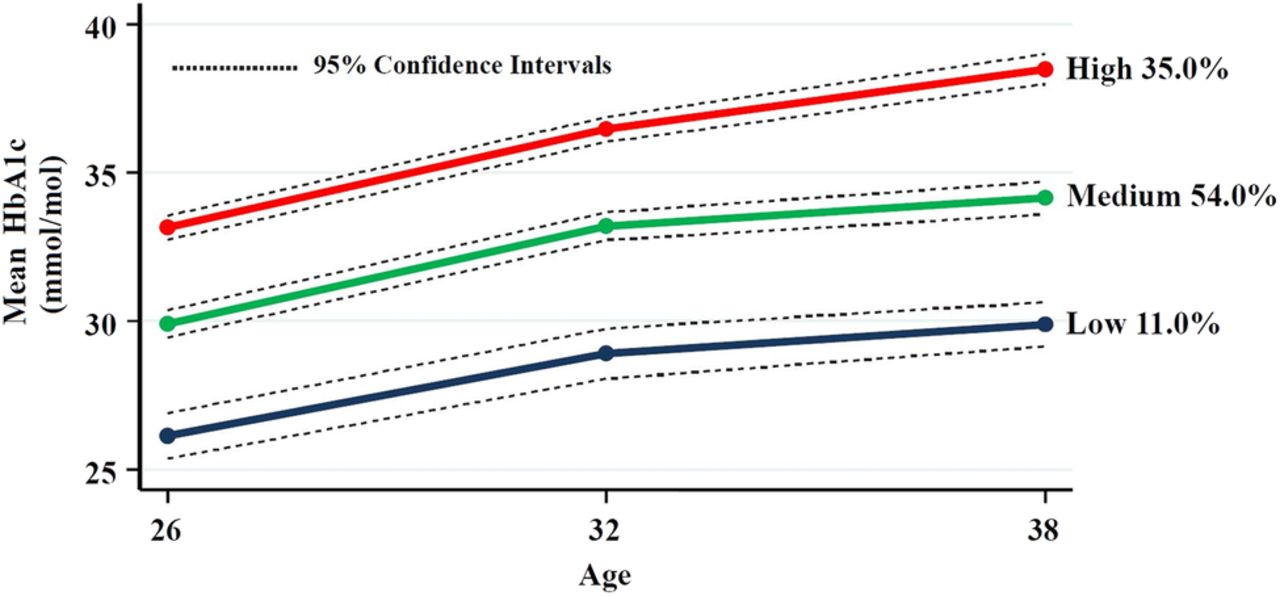
The outcome of GBTM using mean HbA1c measures at ages 26, 32 and 38 is presented in figure 1. A three-group model with quadratic specifications for all three groups was chosen: ‘low’ (n=98, 11.0%); ‘medium’ (n=484, 54.0%); and ‘high’ (n=313, 35.0%; figure 1). The matrix of the observed and predicted values showed that the model fitted the data well. The average posterior probability value was 0.84 or more for each group, and there was very close correspondence between each group's estimated probability and the proportion of study members assigned to it according to the maximum posterior probability assignment rule. CIs were reasonably narrow for each group, and the odds of correct classification based on the posterior probabilities of group membership indicated that the model had good assignment accuracy.
GBTM using mean HbA1c measures at ages 26, 32 and 38. GBTM, group-based trajectory modeling; HbA1c, glycated hemoglobin.
Natural history of HbA1c using GBTM
The three HbA1c trajectory groups had a statistically significantly different mean HbA1c at age 26 (as evidenced by non-overlapping CIs at age 26), and followed similar rising trajectories to age 32, with absolute increases in mean HbA1c of 2.8, 3.3, and 3.3 mmol/mol for the ‘low’, ‘medium’, and ‘high’ groups, respectively, over the 6 years (figure 1). While the trajectories for all three groups rose less steeply between ages 32 and 38, the ‘high’ group followed a steeper trajectory than the other two groups with absolute increases in mean HbA1c of 1.0, 1.0, and 2.0 mmol/mol for the ‘low’, ‘medium’, and ‘high’ groups, respectively. While the differences in the mean HbA1c values at ages 26 and 32 were statistically significant for all three groups, the differences in the mean HbA1c values at ages 32 and 38 were significant for the ‘high’ group only.
Higher proportions of males, those of low SES at ages 26 and 38, and those who were smokers at ages 26, 32 and 38, were in the high HbA1c trajectory group (table 2). Mean HbA1c and the prevalence of dysglycemia at ages 32 and 38 showed clear upward gradients across the three groups from ‘low’ to ‘high’. There was little difference between the ‘low’ and the ‘medium’ groups with respect to the mean anthropometric measures, but those in the ‘high’ trajectory group had higher mean weight, higher mean WC, and higher mean waist-hip ratio at all three ages, and a higher mean waist-height ratio at age 38. Generally, clear upward gradients across the groups were seen for the high-risk anthropometric groups with statistically significant associations found for the high BMI group at ages 32 and 38, the high WC group at all three ages, the high waist-hip group at age 38 only, and the high waist-height group at age 26 only.
HbA1c trajectory group by demographic characteristics, smoking status, HbA1c measures and anthropometric measures at ages 26, 32 and 38. Proportions or SD in parentheses
Time-invariant predictors of HbA1c group membership
A generalization of the GBTM model was used to link different baseline (age 26) anthropometric measures with HbA1c trajectory group membership while controlling for sex, low SES and smoking at baseline. Five different generalizations of the GBTM model were fitted, with the low trajectory group as the reference (table 3). Model 1 linked trajectory group membership with sex, low SES and smoking at age 26. To examine the individual effects of anthropometric risk factors, models 2(a), 2(b), 2(c) and 2(d) added high BMI group, high WC group, high waist-hip group and high waist-height group membership, respectively, to model 1. All models showed a gradient in ORs for sex and smoking across the three trajectory groups, with the risk of high trajectory group membership being significantly greater for males, and the risk of medium and high trajectory group membership being significantly greater for smokers. The high WC group and the high waist-height group showed a similar gradient in ORs across the trajectory groups, whereby both high WC group and high waist-height membership increased the odds of being in the ‘high’ trajectory. There was an overall improvement of 7.8% in model fit from BIC=−6311.47 for the unadjusted model to BIC=−5852.70 and −5853.31 for models 2(b) and 2(d), respectively. Finally, it was considered whether models 2(b) and 2(d) were improved by the addition of high BMI group membership (data not shown). This addition did not improve the BIC for either model.
Adjusted ORs for HbA1c trajectory group membership
Wald tests were conducted to test the equality of the time-invariant factor estimates across the trajectories. The effect of sex, smoking, and high WC group membership differed for the ‘medium’ and ‘high’ trajectories in the high WC group model (χ²=12.0, p<0.001 for sex; χ²=6.5, p<0.05 for smoking; and χ²=7.1, p<0.01 for high WC group membership). The effect of sex, smoking and high waist-height group membership differed for the ‘medium’ and ‘high’ trajectories in the high waist-height group model (χ²=9.7, p<0.005 for sex; χ²=7.7, p<0.01 for smoking; and χ²=7.5, p<0.01 for high waist-height group membership).
Discussion
This paper provides unique insights into the natural history of HbA1c in a birth cohort as it moved from young adulthood toward early middle age. To the best of our knowledge, this is the first time GBTM has been used to describe HbA1c trajectories during this stage of life. Three trajectories of HbA1c were identified through ages 26, 32 and 38. HbA1c levels at age 26 may have an important role in identifying those most at risk for dysglycemia 12 years later. Moreover, examination of baseline demographic, smoking and anthropometric characteristics found that membership of the high WC group and high waist-height ratio group at age 26, and being a smoker at age 26, predicted membership of the least favorable trajectory over the next 12 years.
The strengths of this study include: (1) the use of a birth cohort with a very high retention rate; (2) comprehensive objective data on glycemia and anthropometric covariates at three points over 12 years; and (3) the application of GBTM to identify latent HbA1c trajectory groups. The former means that the findings remain generalizable to the source population (South Island of New Zealand). The question of whether it is appropriate to generalize DMHDS findings to populations other than New Zealand must be considered. The prevalence of dysglycemia in our sample is consistent with estimates from the USA18 and the UK,19 and it is therefore likely that our findings are generalizable to these populations. The principal advantage of GBTM over other trajectory modeling techniques is that it does not assume a priori the existence of trajectories of a specific form. Rather, it allows distinctive latent developmental trajectories to emerge from the data.16 It facilitates the examination of factors that may determine trajectory group membership, and it enables the dissemination and communication of complex findings in a form which is readily understood by non-technical audiences, public health funders, politicians, general practitioners and the public. While any attempt to categorize risk must be regarded as somewhat arbitrary, GBTM differs from the practice of defining thresholds for normoglycemia, prediabetes and diabetes; essentially, those are stages in the natural history of dysglycemia rather than separate diseases. GBTM instead characterizes risk in terms of a subpopulation's development trajectory, and it provides a different perspective on identifying those most at risk. Some limitations must be recognized. Although the proportion (7.5%) who self-identify as Māori at age 26 in the cohort does match the proportion of Māori in the South Island, Māori are under-represented with respect to the total New Zealand population. In addition, the DMHDS data are right-censored. Data to age 38 have been gathered, but we have no information on what will happen beyond this age.
Tracking
Our findings suggest that the path toward dysglycemia can be identified much sooner than previously assumed; the implications of this for our understanding of its natural history are important. That mean HbA1c increased steadily with age is not surprising because this phenomenon has been seen elsewhere.20 ,21 However, most other studies focusing on HbA1c and age have examined older populations, and the magnitude of the change (an increase of 16.0% between ages 26 and 38) in this relatively young age group is noteworthy. What is remarkable is that most of this change happened at a very young age indeed, between ages 26 and 32. This implies that the roots of this disease may be established earlier in life than was previously thought.
Moreover, the prevalence of dysglycemia in the sample is of great concern. While few study members were diabetic at age 38, almost one in five were categorized as prediabetic by that age; these individuals are at high risk of developing diabetes within a decade.22 Our findings are consistent with those of a recent New Zealand population-based survey which found the prevalence of prediabetes to be 25.5% for the total NZ population over the age of 15, with a prediabetes prevalence of 18.9% for the 25–44 age group.23 What our study adds is that three distinctive patterns of glycemia experience were able to be identified from age 26 through to age 38. These three trajectories did not start from the same age 26 HbA1c level and then diverge; rather, they were apparent at age 26 (25.9, 29.9 and 33.4 mmol/mol for the low, medium and high trajectory groups, respectively). Although these three starting levels are within a normoglycemic range, the risk of being in an unfavorable trajectory by age 38 was associated with the higher initial HbA1c level 12 years earlier.
Prediction
That clear gradients of mean weight, mean WC, and mean waist-hip ratio at all three ages—and mean waist-height ratio at age 38—were seen between the low and high trajectories in the bivariate analysis is not surprising. There is convincing evidence that excessive body weight and central adiposity are risk factors for dysglycemia.24 WC, waist-hip ratio and waist-height ratio correlate with central adiposity, a known risk factor for type 2 diabetes.25 Waist-hip ratio attempts to better quantify risk by accounting for variation in fat accumulation patterns with abdominal fat being riskier than fat around the hips. Waist-height ratio accounts for different heights which minimizes the requirement to have different thresholds for the different sexes and ethnic groups. However, debate continues as to which characteristic is most closely linked to metabolic risk.13 ,14 ,25–30
We found the high WC and high waist-height groups at age 26 to be most strongly associated with high HbA1c trajectory group membership, independently of sex, SES and smoking at age 26. These findings are relevant from the clinical and public health perspectives; they underline the importance of the central adiposity measures—WC and waist-height ratio—for patients, and reinforce the ‘keep your waist circumference to less than half your height’ public health message.13 Clinicians and epidemiologists would welcome clear guidelines as to which measure (preferably a quick and easy one with minimal potential for error) will most reliably predict risk in their patients and study participants. The wide 95% CIs for the high WC group may indicate a degree of imprecision for this finding. Adding height to WC substantially narrowed the CIs; thus, a high waist-height ratio had greater precision. It is particularly noteworthy that the addition of BMI did not enhance the predictive utility of these measures of central adiposity (although this may change as the cohort ages).
Mean HbA1c at ages 26 and 32 strongly predicted the prevalence of dysglycemia at age 38. These findings have important health policy implications. Until fairly recently, the recommended age at which to start routine screening for prediabetes or diabetes in asymptomatic populations ranged between 40 and 45 years.31 ,32 The recent National Institute for Health and Care Excellence (NICE) guidelines suggest screening high-risk individuals from age 25.33 Our data confirm that routine screening during the mid-20s (or possibly even earlier) may identify a normoglycemic group which is more likely to follow an unfavorable future HbA1c trajectory. Identification of such a group would allow for earlier prevention and/or intervention.
The greater odds for smokers at age 26 of belonging to the medium or the high HbA1c trajectories are consistent with current research.34 ,35 Whether smoking has a direct impact on glycemia, or represents a marker for other causal factors (such as physical inactivity and/or poor diet) is currently unclear. Our data suggest that inclusion of a question on smoking may improve metabolic risk assessment protocols. The German Diabetes Risk Score and the Australian Type 2 Diabetes Risk Assessment tools do include an item on smoking;36 ,37 however, the American Diabetes Association, the Diabetes New Zealand and the Diabetes UK assessment tools currently do not.38–40
Conclusions
This paper has used a novel statistical approach to report complex longitudinal data, and supports the notion that earlier life experience sets the scene for later health outcomes. It has demonstrated that trajectories of HbA1c begin relatively early in adulthood with a greater risk of poor outcomes being established by the mid-20s. The public health implications of this are important. It is possible that the identification of those most at risk can be achieved earlier in life than the guidelines have suggested. This would enable timely targeting of preventive measures to those who need it most, facilitate the best use of public health resources, and help to minimize the future burden of disease and suffering, and the cost of the diabetes epidemic. The debate over the best anthropometric measure of assessing metabolic risk is ongoing. Our study confirms the central adiposity measures, WC and waist-height ratio, and smoking status to be valid clinical predictors for future dysglycemic risk. We suggest that routine screening using these measures from early adulthood may help identify those most at risk of unfavorable future outcomes. The replication of these findings by other researchers in diverse settings is welcomed. We hope that our study will contribute to ongoing research in this field, help to inform policy on future health strategies, and may justify public health intervention/prevention efforts targeted earlier in the life course than currently recommended.
Acknowledgments
The authors thank the Dunedin Multidisciplinary Health and Development Study (DMHDS) members, and their families and friends, for their continuing participation in the Dunedin Study. The authors also thank Unit research staff and the Study founder, Dr Phil Silva. They are grateful to Professors Terrie Moffitt and Avshalom Caspi (Departments of Psychology and Neuroscience and Psychiatry and Behavioural Science, and Institute for Genome Sciences and Policy, Duke University, Durham, North Carolina) for their support and collection of the glycated hemoglobin data.
References
Footnotes
Contributors DMS analyzed the data and drafted the manuscript. WMT, JMB, JM and RP guided the work, provided critical intellectual input and reviewed the manuscript. RM reviewed and contributed to the manuscript. DMS is the guarantor of this work and, as such, had full access to all the data in the study and takes responsibility for the integrity of the data and the accuracy of the data analysis.
Funding The Dunedin Multidisciplinary Health and Development Research Unit is supported by the Health Research Council of New Zealand. This work was also supported by the following grants: the UK Medical Research Council (grants G0100527, G0601483 and MR/K00381X), the National Institute of Mental Health (grants MH45070 and MH49414), the US National Institute of Health/National Institute on Aging (grants AG032282, R01AG032282 and R01AG048895), and the UK Economic and Social Research Council grant ES/M010309/1.
Competing interests None declared.
Ethics approval Otago Research Ethics Committee.
Provenance and peer review Not commissioned; internally peer reviewed.
Data sharing statement No additional data are available.