Article Text

Abstract
Objective To evaluate whether visual acuity impairment was an independent predictor of mortality in patients with type 2 diabetes.
Research design and methods This is a 19-year follow-up of a cohort of 1241 patients newly diagnosed with type 2 diabetes and aged 40 years or over. Visual acuity was assessed by practicing ophthalmologists both at diabetes diagnosis and after 6 years. The logarithmic value of the visual acuity (logMAR) was the exposure. Multivariable Cox regression models were adjusted for multiple potential confounders including cardiovascular disease, and censored for potential mediators, that is, fractures/trauma. Primary outcomes were from national registers: all-cause mortality and diabetes-related mortality.
Results Visual impairment at diabetes diagnosis was robustly associated with subsequent 6-year all-cause mortality. Per 1 unit reduced logMAR acuity the incidence rate of all-cause mortality increased with 51% (adjusted HR: 1.51; 95% CI 1.12 to 2.03) and of fractures/trauma with 59% (HR: 1.59; 95% CI 1.18 to 2.15), but visual acuity was not associated with diabetes-related mortality. After censoring for fractures/trauma, visual acuity was still an independent risk factor for all-cause mortality (HR: 1.68; 95% CI 1.23 to 2.30). In contrast, visual acuity 6 years after diabetes diagnosis was not associated with the subsequent 13 years’ incidence of any of the outcomes, as an apparent association with all-cause mortality and diabetes-related mortality was explained by confounding from comorbidity.
Conclusions Visual acuity measured by ophthalmologists in patients newly diagnosed with type 2 diabetes was an independent predictor of mortality in the short term.
- vision impairment
- mortality
- type 2 diabetes
This is an open access article distributed in accordance with the Creative Commons Attribution Non Commercial (CC BY-NC 4.0) license, which permits others to distribute, remix, adapt, build upon this work non-commercially, and license their derivative works on different terms, provided the original work is properly cited, appropriate credit is given, any changes made indicated, and the use is non-commercial. See: http://creativecommons.org/licenses/by-nc/4.0/.
Statistics from Altmetric.com
Significance of this study
What is already known about this subject?
Visual acuity loss is a common consequence of type 2 diabetes, and may complicate diabetes self-management.
Using data from a sample of 1381 patients newly diagnosed with type 2 diabetes, this study aimed to assess whether visual acuity loss was an independent risk factor for mortality in this population.
What are the new findings?
Impaired visual acuity at diagnosis was associated with increased all-cause mortality, independent of other risk factors for mortality.
How might these results change the focus of research or clinical practice?
Practitioners in primary care should consider screening patients with type 2 diabetes for visual acuity loss soon after diagnosis.
Introduction
Visual impairment is a common consequence of type 2 diabetes, affecting about 4%–16% of patients.1–3 The global epidemic of type 2 diabetes has led to an increase in the number of microvascular and macrovascular conditions related to vision loss. For example, between 1990 and 2010 the worldwide prevalence of visual impairment caused by diabetic retinopathy increased by 64% for moderate to severe visual impairment and 27% for blindness.4 Current clinical guidelines recommend annual or biannual screening of patients with diabetes in order to prevent or delay the onset of sight-threatening conditions.5
Patients with both diabetes and visual impairment could be at risk of entering a ‘vicious cycle’ of worsening health. Visual impairment has a huge impact on the performance of self-care activities, including preparing healthy meals, exercising, and taking insulin and medications that help patients to maintain a steady blood glucose level.6 7 In addition, past research has shown that vision impairment may amplify the adverse effects of diabetes, in which patients with both diabetes and visual impairment are at greater risk than sighted patients of experiencing long-term diabetes complications, functional limitations, accidents, mental distress, loneliness, and social disadvantages such as unemployment and poorer access and utilization of healthcare services.6–10 Diabetes and its associated complications could also affect people’s ability to manage and adjust to their vision loss.6
Results from meta-analytic reviews show that the presence of type 2 diabetes doubles the risk of premature mortality from all causes11 12 and cardiovascular diseases.11 While health conditions like hyperglycemia and hypertension have been identified as independent predictors of mortality in patients with type 2 diabetes,13 little is known about visual impairment as a possible mortality risk factor of diabetes.14–17 Of the published studies on this subject, few have controlled for important mortality risk factors of diabetes, such as diabetes status and chronic conditions.16 In addition, the former studies have either sampled patients with visual impairment caused by diabetic retinopathy14–16 or blind people with early-onset type 1 diabetes,17 typically patient groups with long diabetes durations. It is well known that diabetes duration predicts both diabetes complications18 and excess risk of death.13 Hence, to understand the complex interplay between visual impairment and type 2 diabetes on morbidity and mortality, there is a need for studies on patient groups being early in the course of the disease.
Visual acuity can easily be accessed in the clinic and it would be of general clinical interest to uncover whether this information carries any prognostic information in itself. The objective of the present study was to evaluate whether visual acuity impairment was an independent risk factor for mortality in patients with type 2 diabetes, and thereby to clarify whether such relation was explained by confounding, notably from cardiovascular disease, or by mediation through concurrently increased incidence of fractures/trauma.
Methods
Patients
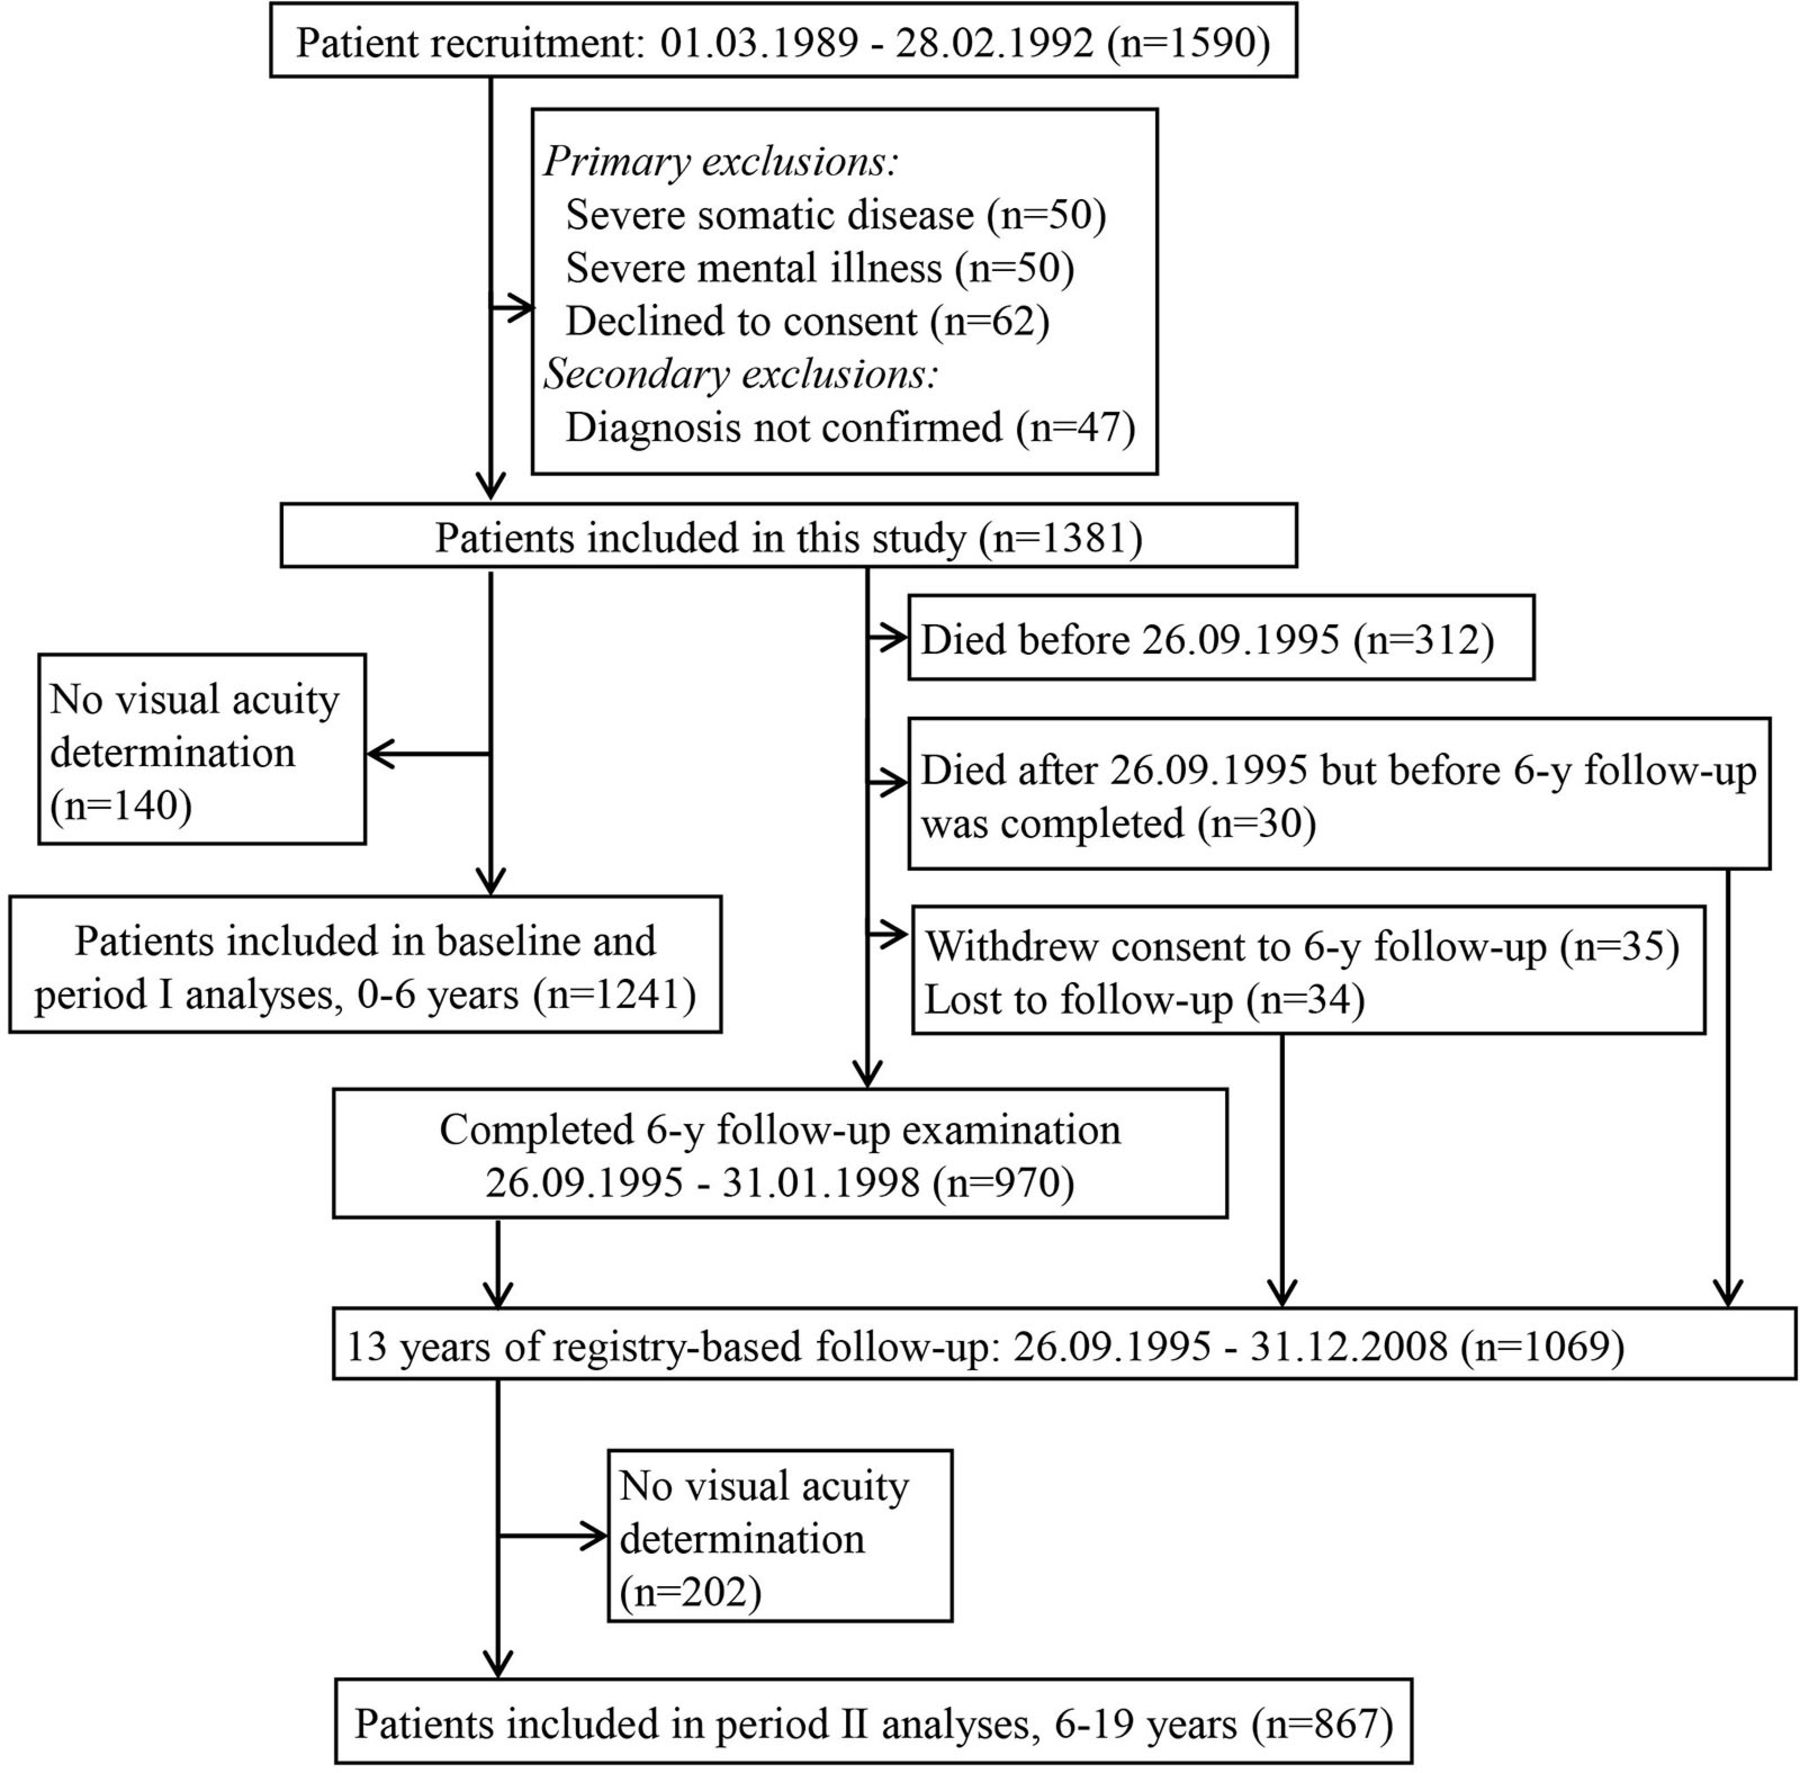
For the Diabetes Care in General Practice study (DCGP),19 474 primary care physicians in Denmark volunteered to recruit all of their patients who were aged 40 years or older and diagnosed with diabetes during the 3-year inclusion period in 1989–1992 (figure 1). Following recruitment, the diabetes diagnosis was confirmed by a single fasting whole blood/plasma glucose concentration (≥7.0/8.0 mmol/L) measured at a major laboratory. The protocol-based exclusion criteria were life-threatening somatic disease, severe psychiatric disease, or unwillingness to participate. Previous to the inclusion period, the physicians were randomized to give either personal, structured care or routine care to the included patients until a 6-year follow-up which started on 26 September 1995.

Patient flow through study.
Assessments and definitions
After the diabetes diagnosis and in connection with the 6-year follow-up examination, the patients were referred to a practicing ophthalmologist who did a standard eye examination and funduscopy. Visual acuity (the eye’s ability to resolve fine details) and visual field are the two visual functions assessed in the classification of visual impairment.20 Visual acuity with the best correction for each eye was estimated with an optotype chart, usually a Snellen chart, at 6 m (20 feet). Visual acuity was recorded as decimal digits which, according to usual clinical and administrative practice in Denmark, categorizes the patients, according to the visual acuity in the best seeing eye, into normal vision (≥0.5), moderate to severe visual impairment (<0.5 and >0.1) or blind (≤0.1). For adequate analysis, this visual acuity was converted to logMAR: minus one times the logarithm of visual acuity of the best seeing eye21; increments of 1 logMAR unit from 0 to 3 are approximately equivalent to decimal visual acuity values of 1.00, 0.35, 0.15, and 0.05, respectively. The result of the funduscopy was recorded as one of six response categories1: no diabetic lesions, microaneurysms only, background retinopathy without or with maculopathy, and proliferative retinopathy without or with new vessels on the optic disc. Concurrently, information about other retinal pathologies such as eye operations, glaucoma, presence of cataract and reasons for impaired vision was obtained. In 69% of the patients the same ophthalmologist did the eye examination at diagnosis and at 6-year follow-up.
Primary outcomes were all-cause mortality and diabetes-related mortality and a secondary outcome was the incidence of fractures/trauma, each over the period from diagnosis to the 6-year follow-up and over the period from the 6-year follow-up until 31 December 2008. Vital status and emigration status of the participants were obtained from The Danish Civil Registration System.22 Causes of death were taken from The Danish Register of Causes of Death.23 Incidence of somatic disease was taken from The Danish Register of Causes of Death and The Danish National Patient Register, which includes all inpatient and outpatient hospital contacts, but no primary care contacts.23–25 Diabetes-related deaths were defined as fatal myocardial infarction, stroke, renal disease, hyperglycemia, hypoglycemia, peripheral vascular disease and sudden death.26 Fractures/trauma was defined as all diagnoses beginning with 8, 90–98, 991, 992, or 996 (International Classification of Diseases Eighth Revision, ICD-8), or all S-diagnoses and diagnoses beginning with T0–T2, T30–T35, T51–T59, T61–T65, T79, or T90–T98 (ICD-10).
In questionnaires filled in at diabetes diagnosis and 6-year follow-up patients gave information about familiar disposition to diabetes, education, residence, physical activity, smoking habits, and whether they lived alone. The general practitioners recorded clinical information on the patients including body height and weight, blood pressure, heart rate, and history of hypoglycemic events, cardiovascular disease, peripheral neuropathy, amputations and cancer. A more detailed description of the variables and definitions has previously been published.26 Cardiovascular disease was defined as history of myocardial infarction and/or history of stroke and/or angina pectoris and/or intermittent claudication and/or absent arterial pulses on both feet and/or amputation on the lower extremities; peripheral neuropathy was defined as lack of a sense of pinprick and/or touch of cotton wool on at least one foot and/or absent patellar reflex on at least one knee; and cancer was defined as self-report of any cancer except benign skin cancers.
Assays
Fasting blood samples and urine samples were collected at diabetes diagnosis and 6-year follow-up. Measurements of HbA1c (reference range 36–57 mmol/mol (5.4%–7.4%); using the method created by the Diabetes Control and Complications Trial (DCCT), the interval may be translated into 29–50 mmol/mol (4.8%–6.7%)), total cholesterol, triglycerides, serum creatinine and urinary albumin were centralized.1
Statistical analyses
The increase in incidence of the outcomes attributable to visual impairment was assessed with hazard ratios (HRs) for a unit increase in logMAR acuity estimated from a multivariable Cox regression model on time to death/event. Two sets of analyses were performed: (1) one for outcomes in the period from diabetes diagnosis to year 6 (period I), and (2) one for outcomes in the period from year 6 to year 19 after the diabetes diagnosis (period II). Visual acuity at diagnosis was the exposure for period I, and visual acuity at year 6 was the exposure for period II. Risk times were censored at the end of the follow-up period or emigration. The analysis was split in these two periods in order to investigate whether visual impairment had a different role at diagnosis than at a later stage of the disease.
The multivariable analyses were adjusted for groups of possible confounders which were (A) background variables: sex, age; (B) sociodemographics: familial disposition to diabetes, living alone, education, residence; (C) biochemical risk factors: (diagnostic) plasma glucose (for period I), HbA1c (for period II), total cholesterol, fasting triglycerides, urinary albumin, serum creatinine; (D) clinical risk factors: height (in interaction with sex), weight (in interaction with sex), hypertension, resting heart rate; (E) lifestyle variables: smoking, physical activity, trial arm; (F) chronic conditions: peripheral neuropathy, cardiovascular disease, cancer (former or present); (G) eye pathologies: age-related macular degeneration (AMD), cataract, diabetic retinopathy, other retinopathy, eye pressure.
The combination of the groups of confounders presented in the final multivariable model was determined by sequential backward elimination of the groups for which the p value of the corresponding likelihood ratio test was higher than 0.05, until all remaining tests had p<0.05. For each regression model the validity of the proportional hazard assumption was assessed by including an interaction with log(time) and each covariate in the model; a joint test for these interactions tested the assumption. In none of the models the proportional hazard assumption was violated. Patients with missing values were omitted from the analysis. A p value <0.05 indicated statistical significance. The statistical analyses were performed by the use of SAS V.9.3.
Results
Of the 1381 included patients, 1241 and 867 had visual acuity measured at diagnosis and at 6-year follow-up examination, respectively. A small number started insulin treatment within 180 days of diagnosis, so 97.6% of the patients were considered to have type 2 diabetes. Of the patients assessed at the time of the diabetes diagnosis the prevalence of moderate to severe visual impairment and blindness was 5.4% (95% CI 4.1 to 6.7) and 0.9% (95% CI 0.4 to 1.4), respectively. Among the patients alive and with a valid determination of visual acuity 6 years after the diagnosis, the prevalence of moderate to severe visual impairment and blindness was 6.7% (95% CI 5.0 to 8.4) and 2.4% (95% CI 1.3 to 3.4), respectively. The median time between the first and the second eye examination was 5.6 years (IQR: 5.0–6.3).
At diabetes diagnosis and compared with patients with normal vision, patients with moderate to severe visual impairment or blindness were on average older, more often female, and living alone (table 1). They also had a higher prevalence of hypertension, peripheral neuropathy and cardiovascular disease and they were less physically active. The same pattern was present at diabetes diagnosis and 6 years later. The most commonly diagnosed eye pathologies were AMD and cataract at both diagnosis (12.4% and 27.5%, respectively) and follow-up (11.7% and 33.9%, respectively). Diabetic retinopathy was seen in 4.1% at diagnosis, and in 13.7% 6 years later.
Patient characteristics at diabetes diagnosis and 6 years later according to visual acuity
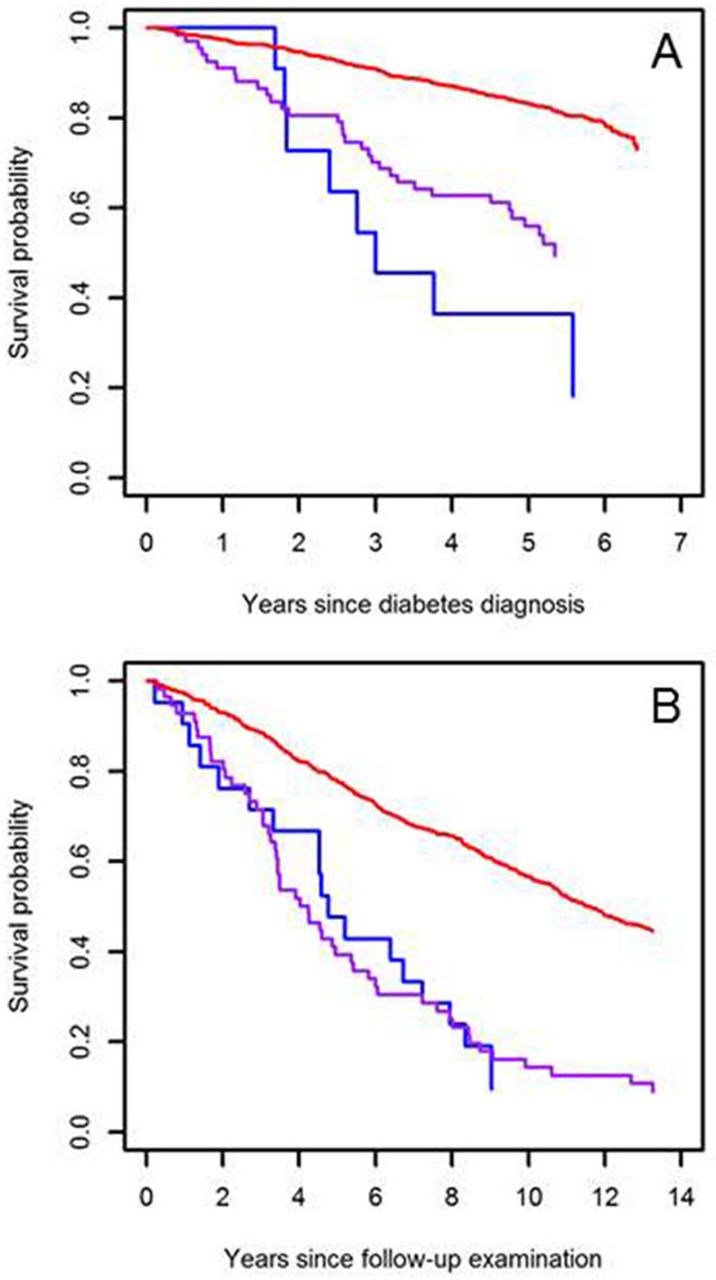
All-cause mortality according to visual acuity is presented in Kaplan-Meier plots in figure 2. Figure 2A displays a dose–response relationship between visual acuity at diagnosis and all-cause mortality, whereas the death rates were equally high in patients who were blind or had moderate to severe visual impairment at the 6-year examination (figure 2B).
Kaplan-Meier plot of all-cause mortality from diabetes diagnosis (A) and from follow-up after 6 years (B) in categories of visual acuity: normal vision (red), impaired vision (blue), and blind (purple).
Table 2 shows that reduced visual acuity (1 unit increase in logMAR) at the baseline examination was significantly associated with all-cause mortality after adjustments for age and sex, after adjustments for various groups of possible confounding factors, as well as after intensive confounder control. However, we did not find any significant associations for diabetes-related mortality in the adjusted models. At the 6-year examination, reduced visual acuity was only associated with all-cause and diabetes-related mortality in some models. The observed unadjusted association was mainly explained by confounding from biochemical risk factors (C), lifestyle variables and trial arm (type of diabetes care) (E), and disease severity (F).
The predictive value of visual acuity at diabetes diagnosis and 6 years later for the two primary outcomes: all-cause death and diabetes-related death
The results on the secondary outcome fractures/trauma are shown in table 3. Also here reduced visual acuity at diagnosis was seen associated with an increased incidence of fractures/trauma, but visual acuity at the 6-year examination was not. A supplementary analysis of all-cause death where patients were censored for fractures/trauma (in order to compare mortality for those without trauma and thereby effectively correct for the higher mortality in patients who experience trauma) found that visual acuity was still an independent risk factor for all-cause mortality even when patients experiencing a trauma were removed from the analysis (HR: 1.68; 95% CI 1.23 to 2.30).
The predictive value of visual acuity at diabetes diagnosis and 6 years later for the secondary outcome: fractures/trauma
Conclusions
The current study showed that poor visual acuity was associated with increased risk of all-cause mortality in patients newly diagnosed with type 2 diabetes, and the association remained similar or slightly weaker after controlling for possible confounding factors. Moreover, patients with visual impairment at diabetes diagnosis had more accidents but the increased number of fractures and trauma did not explain the excess mortality. At the 6-year examination, visual acuity did not predict mortality or accidents. From a clinical point of view, our results indicate that poor visual acuity could be of particular importance in the clinical decision-making shortly after diabetes diagnosis (period I), while being of less relevance in decisions at a later stage of the disease (period II).
Our findings of higher all-cause mortality risk with reduced baseline levels of visual acuity are consistent with previous studies.14–17 For example, Rajala et al 14 found an HR of 5.1 (95% CI 2.6 to 11.0) for all-cause mortality in patients with visual impairment caused by diabetic retinopathy compared with a group of age and gender-matched adults without diabetes, while sighted patients with diabetes who had been treated previously for retinopathy had an HR of 2.4 (95% CI 1.1 to 5.6). Our study extends the evidence by demonstrating a relationship between visual impairment and all-cause mortality in a sample of patients with newly diagnosed type 2 diabetes, and hence reducing the possibility of confounding from long-term diabetes complications such as diabetic retinopathy.
In the present study, we observed that patients with both diabetes and visual impairment were more likely than sighted patients to have fractures/trauma, poor lifestyle behaviors, hypertension, neuropathy, and cardiovascular diseases at the baseline examination. Nonetheless, our data do not support a mediating role of these factors in the relation between reduced visual acuity and all-cause mortality. This is in line with the results of a study of 3711 patients with type 2 diabetes, in which diabetes complications accounted for only 10%–18% of the higher mortality risk of impaired visual acuity.16 Given the advanced age of our study population and the high proportion of people with age-related eye diseases and cardiovascular conditions at baseline, the higher mortality risk of patients with reduced visual acuity at the baseline assessment may be related to biological ageing.27 Indeed, age-related eye diseases, such as AMD and cataract, are considered markers of biological ageing28 and might accelerate ageing.27 Reduced visual acuity could also reflect ageing changes in the structures of the eyes, as the eye changes shape, the lens loses elasticity, and the number of retinal ganglion cells decreases with advanced age.29
The weak adjusted associations of visual impairment assessed 6 years after diabetes diagnosis (period II) with all-cause and diabetes-related mortality were unexpected because of the observed increase in prevalence in visual impairment and diabetic retinopathy during the study period. In the multivariable model the apparent associations were mainly explained by (E) lifestyle variables (smoking, physical activity and trial arm) and (F) chronic conditions (peripheral neuropathy, cardiovascular disease, and cancer). An interpretation of our findings is that the disease severity leading to cardiovascular morbidity and diabetic retinopathy could have been the main cause of visual impairment in the individuals with highest mortality in the following years after diagnosis. Even at diabetes diagnosis the patients with visual impairment had a significantly higher prevalence of hypertension and cardiovascular disease indicating higher mortality risk. Another possible interpretation is that the diabetes intervention (E) reduced mortality particularly for individuals with visual impairment in period II.30 The aim of the intervention with structured personal care was exactly to optimize follow-up and self-care and improve long-term glycemic control reducing morbidity and mortality risks. Lastly, because a high number of participants died during the follow-up period, we cannot rule out the possibility of a healthy worker survivor bias.31
Strengths and limitations
Compared with earlier studies it is a strength that the multivariable analyses were adjusted for disease severity, and that the results were robust after censoring for fractures/trauma. However, and in resemblance with all observational studies, we cannot rule out the possibility of residual confounding. One factor of concern is related to socioeconomic status.7 9 Although we adjusted for education, living arrangements and residence, these are only basic socioeconomic indicators, and we did not have access to data on, for example, occupational status, income and wealth. We expect that the observed associations would have been slightly weaker if we had included a more detailed measure of socioeconomic status in our analyses.
The study population was a representative sample of patients with diabetes in the background population. Yet, the results can only be generalized to adult patients with clinical type 2 diabetes in a western world setting as the etiology of visual acuity loss might differ between high and low-income countries.28
Visual acuity was measured twice by an ophthalmologist. Our results were based on best corrected visual acuity at the better seeing eye, while other studies have used presenting, binocular or self-reported visual acuity. Unlike logMAR charts, the Snellen chart, however, has a large-scale increment resulting in a relatively high measurement error. Another factor contributing to measurement variability was differing routines for taking account of visual field loss. The lower precision of the exposure variable, that is, visual acuity, will however only contribute to weaken the strength of the association between vision impairment and mortality.
The involvement of almost all Danish ophthalmologists in the study increased the inter-rater variability, and 10%–40% of sight-threatening eye disease may have been overlooked,32 although it can be assumed that the detection rate for eye disease was higher in patients with low visual acuity. Still, in 69% of the patients the two eye examinations were carried out by the same ophthalmologist. Nonetheless, this measurement error may have reduced our ability to adjust for confounding of the relation between visual acuity and mortality, as the presence of eye diseases is associated with both visual loss and increased mortality.
In conclusion, visual impairment at diabetes diagnosis was an independent risk factor for all-cause mortality during the following 6 years. This association was not explained by cardiovascular disease, disease severity, or fractures/trauma. The visual acuity of a patient with diabetes is an easily accessible clinical measure, also for the primary care practitioner. In order to identify and intensify the treatment of high-risk patients in the daily clinical work, visual acuity can thus be regarded as a risk factor in line with other clinical tests like microalbuminuria, blood pressure and plasma glucose.
Acknowledgments
The authors thank the patients, general practitioners and ophthalmologists who participated in the study.
References
Footnotes
Contributors VS, AB and NdFO developed the research question and wrote the protocol for this follow-up study. NdFO was responsible for the original study design and data collection. NdFO and VS were responsible for data collection from the registries. VS performed the statistical analyses. All authors made substantial contributions to the analysis and interpretation of data. The paper was written by VS, AB, RKR and CB, and revised by NdFO critically for important intellectual content. NdFO obtained funding and is the guarantor of the study. All authors have approved the final version of the manuscript.
Funding This work was supported by grants from The Danish Medical Research Council, The Danish Research Foundation for General Practice, The Danish Ministry of Health, The Health Insurance Foundation, The Pharmacy Foundation and the Novo Nordisk Farmaka Denmark.
Competing interests NdFO reports grants from The Danish Medical Research Council, grants from The Danish Research Foundation for General Practice, grants from The Danish Ministry of Health, grants from The Health Insurance Foundation, grants from The Pharmacy Foundation and grants from the Novo Nordisk Farmaka Denmark, during the conduct of the study.
Patient consent for publication Not required.
Ethics approval The approval of the study by the Copenhagen and Frederiksberg Research Ethics Committee (V.100.869/87) included that oral informed consent was mandatory for all patients.
Provenance and peer review Not commissioned; externally peer reviewed.
Data availability statement Data are available upon reasonable request.
Author note Part of the study data are from a clinical trial of diabetes patients (the DCGP Study) while another part is provided by a third party. SAMBA is a unit at Copenhagen University that stores and shares data from epidemiological research in general practice. Anonymized data from the DCGP study can be provided through application to SAMBA by presenting a methodologically sound study protocol and statistical analysis plan. Interested researchers can contact the SAMBA coordination group at tjs657{at}sund.ku.dk with request for DCGP study data.