Article Text

Abstract
Objective Activin A, an inflammatory mediator implicated in cellular senescence-induced adipose tissue dysfunction and profibrotic kidney injury, may become a new target for the treatment of diabetic kidney disease (DKD) and chronic kidney diseases. We tested the hypothesis that human DKD-related injury leads to upregulation of activin A in blood and urine and in a human kidney cell model. We further hypothesized that circulating activin A parallels kidney injury markers in DKD.
Research design and methods In two adult diabetes cohorts and controls (Minnesota, USA; Galway, Ireland), the relationships between plasma (or urine) activin A, estimated glomerular filtration rate (eGFR) and DKD injury biomarkers were tested with logistic regression and correlation coefficients. Activin A, inflammatory, epithelial-mesenchymal-transition (EMT) and senescence markers were assayed in human kidney (HK-2) cells incubated in high glucose plus transforming growth factor-β1 or albumin.
Results Plasma activin A levels were elevated in diabetes (n=206) compared with controls (n=76; 418.1 vs 259.3 pg/mL; p<0.001) and correlated inversely with eGFR (rs=−0.61; p<0.001; diabetes). After eGFR adjustment, only albuminuria (OR 1.56, 95% CI 1.16 to 2.09) and tumor necrosis factor receptor-1 (OR 6.40, 95% CI 1.08 to 38.00) associated with the highest activin tertile. Albuminuria also related to urinary activin (rs=0.65; p<0.001). Following in vitro HK-2 injury, activin, inflammatory, EMT genes and supernatant activin levels were increased.
Conclusions Circulating activin A is increased in human DKD and correlates with reduced kidney function and kidney injury markers. DKD-injured human renal tubule cells develop a profibrotic and inflammatory phenotype with activin A upregulation. These findings underscore the role of inflammation and provide a basis for further exploration of activin A as a diagnostic marker and therapeutic target in DKD.
- adipocytokine
- clinical aspects of diabetes
- clinical nephrology
- renal fibrosis
This is an open access article distributed in accordance with the Creative Commons Attribution Non Commercial (CC BY-NC 4.0) license, which permits others to distribute, remix, adapt, build upon this work non-commercially, and license their derivative works on different terms, provided the original work is properly cited, appropriate credit is given, any changes made indicated, and the use is non-commercial. See: http://creativecommons.org/licenses/by-nc/4.0/.
Statistics from Altmetric.com
Significance of this study
What is already known about this subject?
Activin A is an inflammatory mediator that contributes to cellular senescence-induced adipose tissue dysfunction and profibrotic kidney injury fueling chronic kidney disease progression.
What are the new findings?
Circulating activin A is increased in human diabetic kidney disease and directly correlates with reduced kidney function, proteinuria and kidney injury markers.
How might these results change the focus of research or clinical practice?
In individuals with diabetic kidney disease and other chronic kidney diseases, activin A may serve as a diagnostic marker for increased cellular senescence burden and/or kidney fibrosis and, importantly, as a therapeutic target for kidney repair.
Introduction
Diabetes mellitus, the most common cause of end-stage kidney failure worldwide, is associated with chronic inflammation and cellular senescence.1–3 Markers of cellular senescence and inflammatory cytokines are elevated in blood, adipose and kidney tissues of individuals with diabetes.2–8 Senescent cells acquire a senescence-associated secretory phenotype (SASP) and induce tissue damage, which contribute to the pathogenesis of diabetes, chronic kidney disease (CKD) and other age-associated conditions.9–15 Moreover, the uremic milieu fuels injury via a CKD-associated SASP. Activin A, a member of the transforming growth factor-β (TGF-β) superfamily, is a SASP component that promotes low-grade sterile inflammation and a profibrotic microenvironment.12 We recently demonstrated that reducing senescent cell abundance in obesity-induced diabetes abrogated the diabetes-related increase in activin A, improved metabolic and adipose tissue function and alleviated podocyte dysfunction.15
In the kidney, activin A is expressed during embryonic development but not in maturity.16–18 However, activin A becomes abundantly expressed in the injured kidney in experimental models of acute kidney injury (AKI),19 20 glomerulonephritis and CKD.21–23 Circulating activin A levels doubled in unilateral ureter obstruction (UUO) rats while levels remained unchanged in unilateral nephrectomized controls with similar kidney function, suggesting the obstructed kidney as the source.24 Renal tubular cells release activin A, which acts as a paracrine factor that promotes fibroblast proliferation, contributing to kidney fibrosis and CKD progression.17 19 25 Beyond the kidney microenvironment, circulating activin A levels are 10-fold higher in a high fat-fed, lipoprotein receptor deficient (Ldlr–/–) CKD mouse model and elevated fivefold in a mouse model of Alport syndrome compared with wild types.22 Urinary activin A concentrations are higher in individuals with AKI compared with controls and in those with prerenal AKI, suggesting potential utility as a biomarker of AKI severity.19 Anti-activin A therapy via follistatin or RAP-011, a ligand trap for its receptor, ActRIIA, is associated with decreased kidney inflammation, reduced fibrosis and improved function.22 Furthermore, we demonstrated in diet-induced obese (DIO) mice that circulating activin A correlated with adipose tissue senescent cell abundance and was reduced after senescent cell clearance.15 In sum, activin A may be a marker of senescent cell abundance and kidney fibrosis with diagnostic and therapeutic potential in diabetic kidney disease (DKD). Despite these recent studies, information about activin A in DKD is incomplete, with little known about the relationship between circulating activin A and kidney function in individuals with DKD.
We began by testing the hypothesis that plasma activin A concentrations are higher with lower kidney function and parallel other markers of kidney injury in individuals with DKD. Additionally, we tested the hypothesis that in vitro DKD-related injury upregulates activin A expression in human kidney cells in concert with other pro-inflammatory, profibrotic and senescence markers. To that end, we compared plasma (and urine) activin A, kidney function and kidney injury markers in two cohorts with diabetes with and without DKD as well as controls without diabetes or CKD. We also conducted DKD-related injury studies in kidney cells to explore these relationships further.
Methods
Study participants
Diabetes cohorts
Study participants consisted of individuals enrolled in two separate prospective studies at Mayo Clinic in Rochester, Minnesota, USA and Galway University Hospitals/National University of Ireland in Galway, Ireland. Mayo Clinic participants, accrued January 2016–February 2019, were adults (≥18 years) with diabetes treated with pharmacological (antidiabetes) therapy and informed consent. Participants with reduced kidney function (or DKD) were oversampled to generate a DKD cohort undergoing blood, urine and adipose tissue sampling for stem cell harvest. To minimize interference of underlying conditions on study findings (bias), exclusion criteria included: active glomerulonephritis, polycystic kidney disease, known renovascular disease, nephrotic syndrome, solid organ transplantation, dialysis, pregnancy, active immunosuppression therapy, chronic infection or active malignancy. Both studies banked blood (and/or urine) specimens at study enrollment. Galway participants were accrued February 2016–December 2018 by convenience consecutive sampling at routine diabetes and nephrology clinics.26 Inclusion criteria were diabetes, age ≥18 years and signed informed consent. Exclusion criteria were active management for acute medical problems (infection, cancer, acute cardiovascular event or hematological conditions) other than anemia, hemoglobin <10 g/dL (<100 g/L) in the 3 months prior to study enrollment, known CKD 5, kidney transplantation or dialysis.
Control cohorts
Plasma samples were collected from controls to compare activin A levels in a cohort without diabetes or CKD. Mayo controls were generated from biobanked plasma samples from individuals approved for kidney donation. Galway controls were individuals specifically screened for metabolic health and preserved kidney function, as previously described.27
Biomarker measurements
Circulating activin A was measured in stored plasma by an ELISA (R&D DAC00B); sensitivity of 3.67 pg/mL and intra-assay and interassay coefficients of variation range between 4.27% and 5.87%, respectively. In a subgroup of Mayo diabetes participants, stored urine activin A was measured by ELISA (Sigma-Aldrich RAB0324); assay sensitivity is 15 pg/mL and intra-assay and interassay coefficients of variation range between <10% and<12%, respectively. To assess associations between circulating activin A and other variables, activin A levels were categorized into low, medium and high tertiles.
Kidney injury biomarkers associated with DKD progression28–30 were measured in plasma by ELISA, including tumor necrosis factor receptor-1 (TNFR-1; R&D DRT100), TNFR-2 (R&D DRT200) and kidney injury molecule-1 (KIM-1; R&D DSKM100). A urine biomarker of kidney injury, monocyte chemoattractant protein-1 (MCP-1; R&D DCP00), was measured by ELISA. Urine MCP-1 and urine activin A were normalized to urine creatinine (Arbor Assays K002-H1).
Clinical laboratory studies
Clinical testing was performed on blood and urine samples for assessment of kidney function, proteinuria, CKD-associated tests and diabetes control including urine albumin-to-creatinine ratio (UACR), glucose, hemoglobin A1c, parathyroid hormone (PTH), serum albumin and blood urea nitrogen (BUN). Kidney function measures were assessed using creatinine-based estimated glomerular filtration rate (eGFR) equations, including: CKD-EPI,31 modification of diet of renal disease equation32 33 and cystatin C34 (clinical; Mayo diabetes cohort only).
In vitro studies in DKD injury models
Additional exploratory studies examined the in vitro relationship between activin A, markers of inflammation and epithelial-to-mesenchymal transition (EMT) programme in renal cells exposed to hyperglycemic and profibrotic states. An immortalized human proximal tubule epithelial cell line (HK-2; CRL-2190 American Type Culture Collection)35 was cultured in keratinocyte serum-free medium (Invitrogen) plus 5 ng/mL epidermal growth factor and 0.05 mg/mL bovine pituitary extract in T25 flasks (Corning) at 37°C/5% CO2 until 80% confluent as per the manufacturer’s protocol. HK-2 cells were seeded at a density of 7×10⁵ cells/flask until 70% confluent. To induce a DKD injury, HK-2 cells were incubated with high glucose (HG, D-glucose 20 mmol/L (with 5 mmol/L in HK-2 medium; totaling 25 mmol/L]) R&D 5504) plus recombinant human TGF-β1 protein (5 ng/mL; R&D 240-B) at 37°C/5% CO2.36 To observe the direct effect of albumin with and without glucose, HK-2 cells were incubated with 5 mg/mL human serum albumin (Sigma-Aldrich, A9511). Exposed HK-2 cells and supernatant were collected at baseline, 12, 24 and 48 hours. HK-2 cell lysates were used for gene (mRNA) expression level analyses. EMT programme, a source of interstitial myofibroblasts responsible for kidney fibrosis,37 including epithelial (E-cadherin) and mesenchymal (type I collagen) markers, profibrotic (activin A), pro-inflammatory factor (MCP-1 (ie, CCL2)) and senescence marker (p16) gene expression was quantified by relative quantitative real-time PCR (RT-PCR) and protein expression was evaluated by immunofluorescent staining. RT-PCR used the following primers from Thermo Fisher Scientific (E-cadherin Hs01023895; type I collagen Hs00164004; activin A Hs00426835; MCP-1 Hs00234140; p16 Hs00923894 relative to housekeeping gene GAPDH Hs02786624). E-cadherin (1:200; Stem Cell Technologies 60157), type I collagen (1:100; Abcam ab6308), activin A (1:100; Thermo Fisher PA5-21939) and MCP-1 (1:100; Abcam ab9669) were used for immunofluorescent studies. HK-2 supernatant was used for activin A protein expression analysis by ELISA (R&D DAC00B).
Statistical analysis
Descriptive characteristics of study participants were summarized as number (percentage) for categorical variables and as mean (SD) for continuous variables. Comparisons between groups were performed with χ2 test (categorical variables) and Kruskal-Wallis test (continuous variables). Spearman’s correlations tested the direction of association between plasma activin A and clinical characteristics, eGFR and kidney injury markers in the diabetes cohorts. Logistic regression was used to compare the high and medium tertiles of plasma activin A, individually, to the lowest tertile. Initially, univariate logistic models were run to determine which clinical characteristics and labs were predictive of activin A tertile. In clinical characteristics and labs with statistically significant univariate logistic results (p<0.05), eGFR-adjusted logistic models were run, where the adjustment covariate was CKD-EPI eGFR. Results of these analyses were reported as ORs and 95% CIs. Missing data were not included in logistic models. Missing data represented <10% of reported variables. Statistical significance was defined as p<0.05. Analyses were completed using SAS V.9.4 (SAS Institute, Cary, North Carolina, USA).
Results
Comparison of plasma activin A levels in participants with diabetes and controls
Circulating levels of activin A were evaluated in study participants with diabetes (with or without DKD) and compared with controls without diabetes or CKD. To ensure generalizability, two separate cohorts were studied; their demographic and clinical characteristics are summarized in table 1. The Mayo cohort comprised 46 diabetes cases and 12 controls, while the Galway cohort contributed an additional 160 cases and 64 controls. Controls were significantly younger (particularly in the Galway cohort) and had a higher proportion of women. Cases had significantly lower eGFR than controls by study design. Given oversampling for DKD in Mayo cases and subsequent age-matching of controls, both cases and controls in the Mayo cohort had lower eGFRs than corresponding cases and controls in the Galway cohort. All laboratory studies related to CKD differed among the cases and controls. Overall, circulating activin A concentrations were higher in cases than controls in each cohort, although they were generally higher in the Mayo than Galway cohorts (figure 1A). This relationship persisted after the cohorts were combined (418.1 vs 259.3 pg/mL; p<0.0001). Activin A levels were inversely correlated with eGFR, particularly among cases, but this inverse relationship was observed across all study participants (Spearman’s correlation (rs)=−0.61; p<0.0001, figure 1B).
Demographic characteristics and clinical laboratory tests in participants with diabetes and controls at Mayo and Galway sites
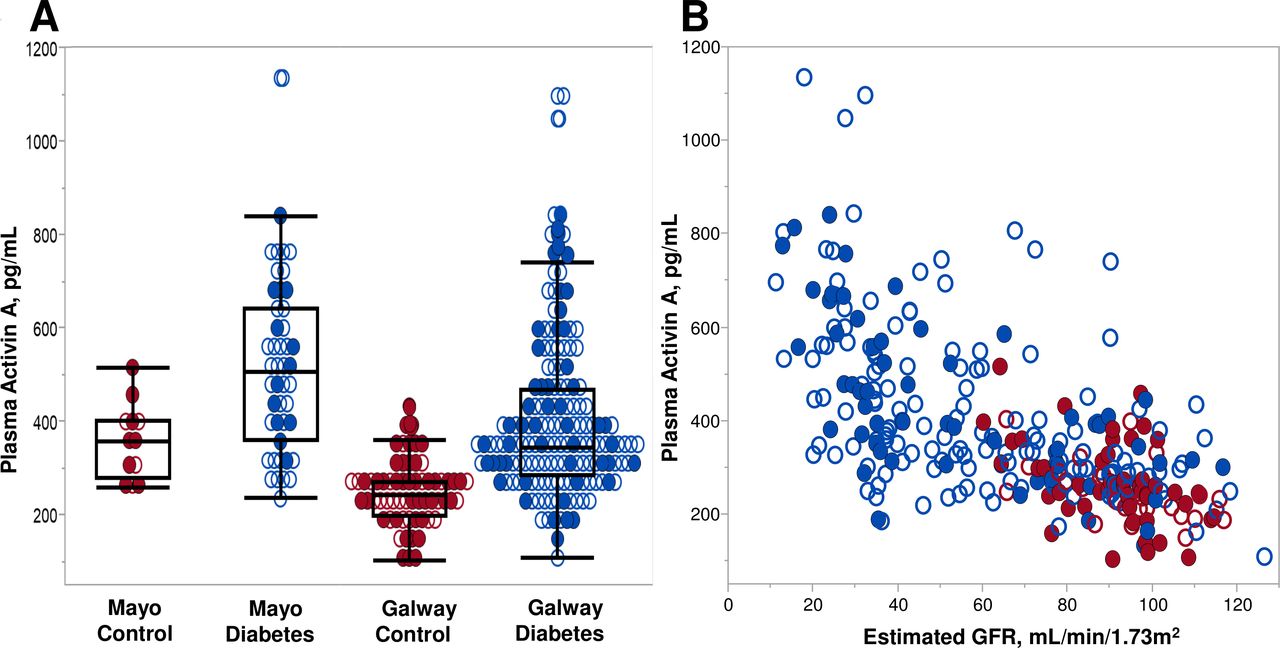
(A) Distribution of plasma activin A concentrations by controls and diabetes (case) status in Mayo and Galway cohorts. Circulating activin concentrations were higher in the diabetes cases compared with controls (p=0.007 Mayo; p<0.0001 Galway). Sex distribution is shown for each group. (B) Individual plasma activin A concentrations by estimated glomerular filtration rate (eGFR) for diabetes cases and non-diabetes, non-chronic kidney disease (CKD) controls in Mayo and Galway cohorts. Spearman’s correlation (rs=−0.61; p<0.0001) for plasma activin A with eGFR. Sex distribution is shown for each group. Red: controls, individuals without diabetes mellitus or CKD; blue: cases, participants with diabetes mellitus with and without CKD; closed circles: female participants; open circles: male participants.
Circulating activin A, kidney function and CKD-related laboratory testing among participants with diabetes
The relationship between circulating activin A, clinical characteristics and kidney injury biomarkers among diabetes cases (the primary population of interest) is shown in online supplementary table 1. In both cohorts, kidney function and CKD-related clinical laboratory values (hemoglobin, serum albumin, BUN, PTH) were closely related to circulating activin A. Levels of hemoglobin, serum albumin and eGFR were inversely related to activin A concentrations. Hemoglobin A1c control did not relate to activin A. In the overall cohort (n=206), the relationship between activin A and eGFR (rs=−0.61; p<0.0001) and other variables remained significant. To increase the power to define the effect of kidney function on activin A, overall diabetes cohorts were stratified by eGFR levels (online supplementary table 2). Over half (55%; n=114) had an eGFR <60 mL/min/1.73 m2 and mean eGFR was 41.4 mL/min/1.73 m2. The highest activin A concentrations were found in the lowest eGFR groups and did not appear to differ by sex, body mass index (BMI) or hemoglobin A1c.
Supplemental material
To assess the relationship between activin A and clinical characteristics further, activin A concentrations, ranging from 240.71 to 1133.35 pg/mL, were stratified into tertiles for each diabetes cohort (online supplementary table 3) and the overall cohorts (table 2). There were no differences in age, female sex, race or BMI among tertiles for the Mayo cohort. Contrarily, in the Galway cohort, the low activin tertile comprised younger individuals and those with lower BMI compared with the medium and high tertiles. A graded and inverse relationship was noted between activin A tertiles and kidney function, assessed by eGFR equations, in both diabetes cohorts. When CKD-related laboratory values were compared, those in the highest activin A tertile had the lowest hemoglobin and serum albumin, as well as the highest BUN, PTH and UACR in both cohorts. C reactive protein (CRP) was not associated with activin tertiles in either cohort. In the Galway cohort, comprising a larger number of participants and a higher overall eGFR compared with the Mayo cohort, additional differences were observed across tertiles that were also found in the combined cohort analyses.
Demographic characteristics and clinical laboratory tests by tertiles of activin A in the combined cohorts with diabetes
Logistic regression was used to examine further these clinical characteristics and laboratory tests with activin A tertile status. In unadjusted analyses, eGFR was associated with medium and high activin A tertiles (figure 2). For every 10 mL/min/1.73 m2 increase in eGFR, there was a 44% (and 54%) reduction in likelihood of being in the medium (and high tertile) compared with the low activin tertile for the Mayo diabetes cohort. Findings were similar in the Galway cohort (medium vs low tertile OR 0.67, 95% CI 0.56 to 0.81; p=0.001 and high vs low tertile OR 0.56, 95% CI 0.46 to 0.69; p=0.001). On combining the diabetes cohorts and after adjustment for CKD-EPI eGFR, which used age, sex and race variables, only lower serum albumin and higher UACR remained associated with the high versus low and medium versus low activin A tertiles (table 3 and figure 3).
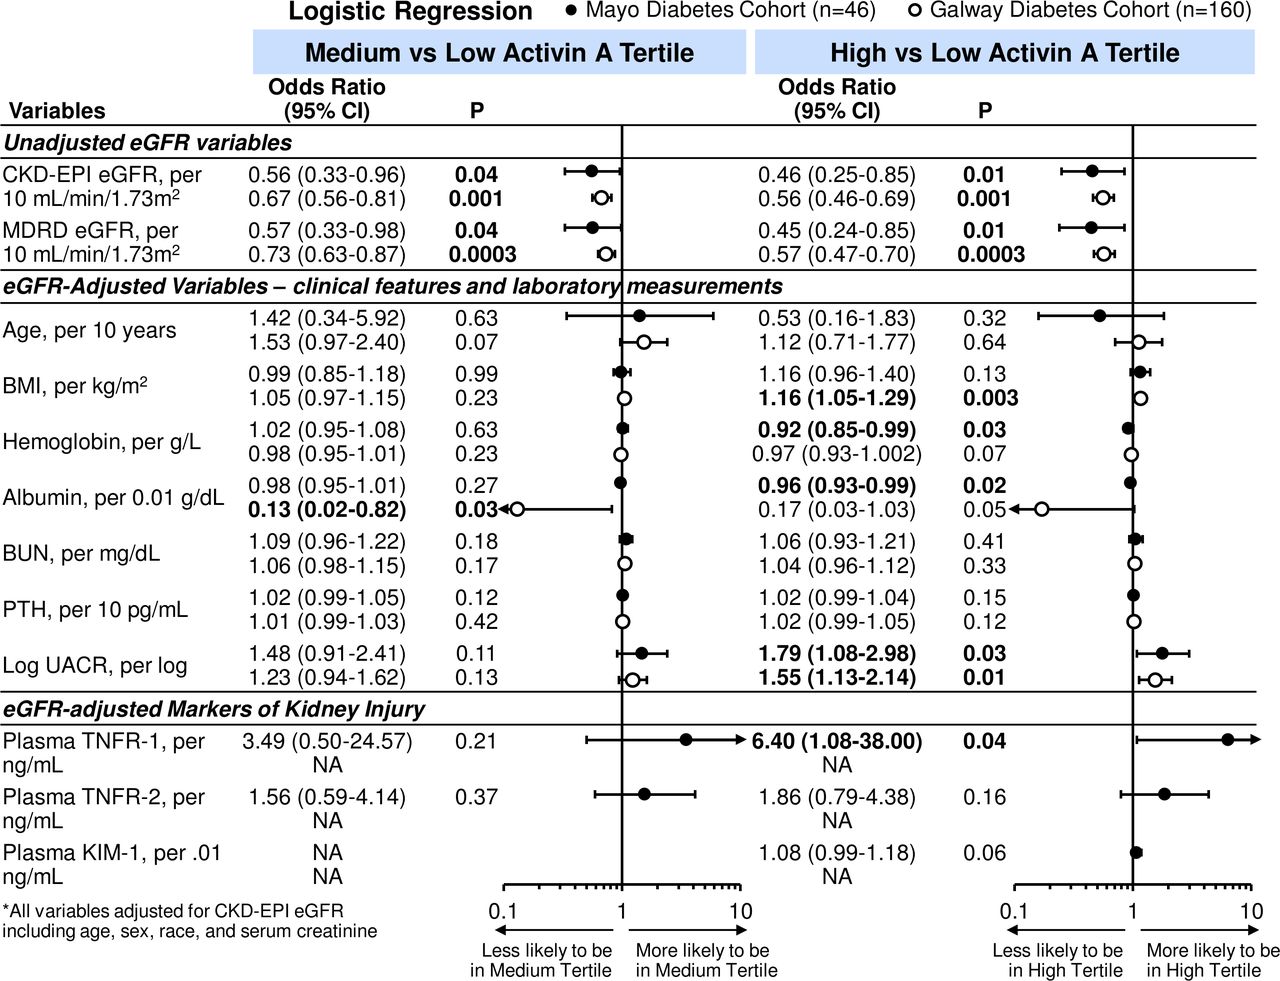
Unadjusted and eGFR-adjusted ORs (95% CIs) for tertiles of activin A per clinical characteristics and laboratory tests in Mayo and Galway cohorts with diabetes. Closed circles: OR for Mayo diabetes cohort; open circles: OR for Galway diabetes cohort. BMI, body mass index; BUN, blood urea nitrogen; CKD, chronic kidney disease; eGFR, estimated glomerular filtration rate; KIM-1, kidney injury molecule-1; MDRD, modification of diet renal disease; NA, not available; PTH, parathyroid hormone; TNFR, tumor necrosis factor receptor; UACR, urine albumin-to-creatinine ratio (Mayo diabetes cohort n=42; Galway n=160).
ORs (95% CIs) for tertiles of activin A per clinical characteristics and laboratory tests in combined cohorts with diabetes
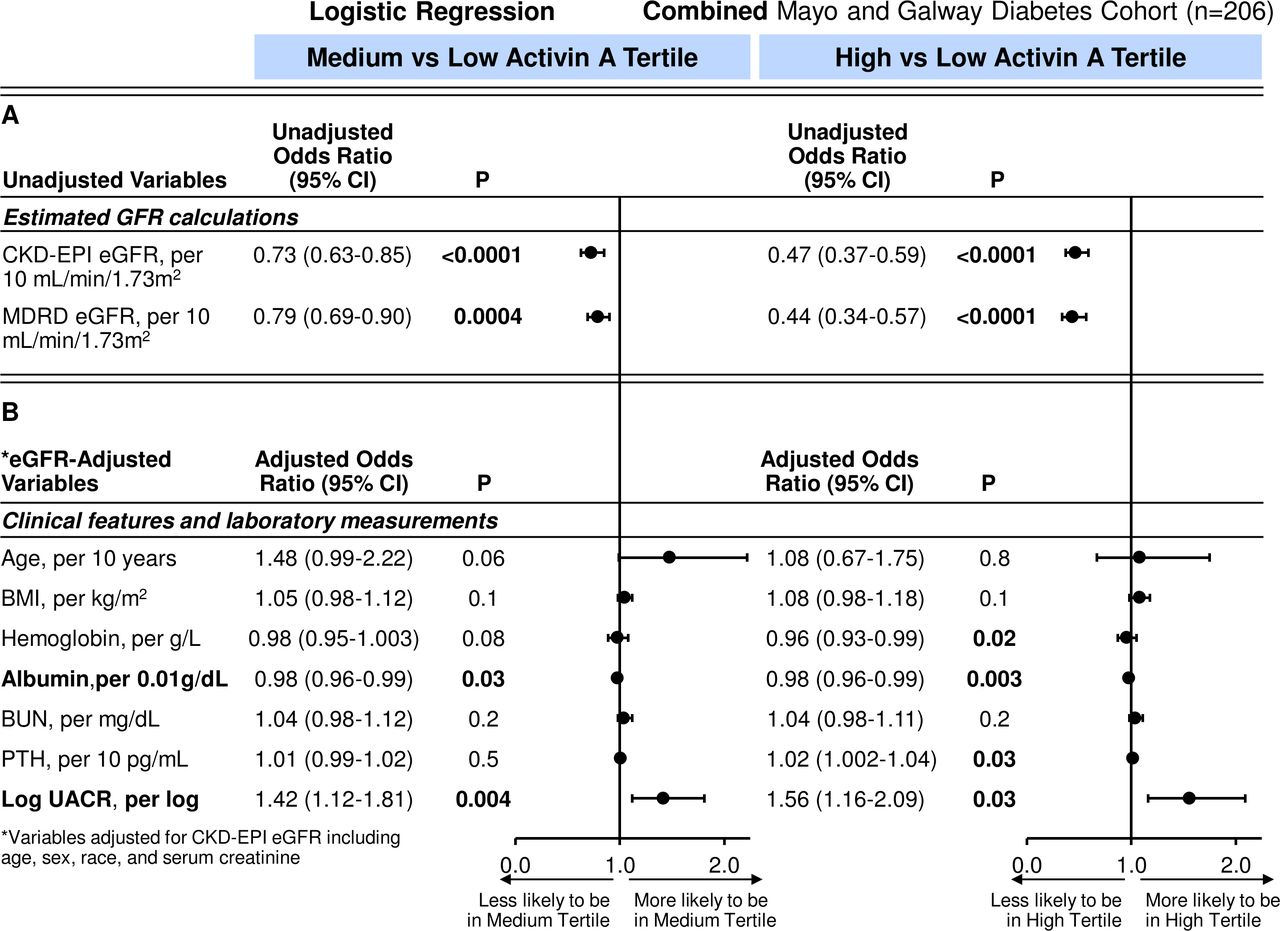
(A) Unadjusted and (B) eGFR-adjusted ORs (95% CIs) for tertiles of activin A per clinical characteristics and laboratory tests in combined cohorts with diabetes. BMI, body mass index; BUN, blood urea nitrogen; CKD, chronic kidney disease; eGFR, estimated glomerular filtration rate; KIM-1, kidney injury molecule-1; MDRD, modification of diet renal disease; NA, not available; PTH, parathyroid hormone; UACR, urine albumin-to-creatinine ratio (Mayo diabetes cohort n=42; Galway n=160).
Circulating activin A and biomarkers of kidney injury
The diabetes cohorts had substantial albuminuria, a key characteristic of DKD injury, which positively correlated with activin A. In an exploratory analysis, biomarkers of kidney injury and DKD progression28 30 were measured in urine (n=37) and plasma (n=38) samples in the Mayo diabetes cohort. The relationship between plasma activin A (or urine activin A/creatinine), eGFR groups and albuminuria were further explored. Albuminuria was higher in the lower eGFR groups and correlated with activin A concentrations in plasma (rs=0.48; p<0.0001) and urine (rs=0.65; p<0.0001) (figure 4). Notably, while plasma activin A levels appeared to have a continuous relationship with UACR, urinary activin A was higher only in those with significant proteinuria. Among kidney biomarkers, a direct relationship was identified between activin A and plasma TNFR-1 (rs=0.63; p≤0.0001), TNFR-2 (rs=−0.44; p=0.006), KIM-1 (rs=0.55; p=0.0003) and urinary MCP-1 normalized to creatinine (rs=0.34; p=0.04). The ratio of urinary levels of activin A, a potential biomarker of kidney injury19 and creatinine correlated directly with plasma activin A (rs=0.48; p=0.003). Logistic regression was again used to examine kidney injury biomarker levels with activin A tertile status at which point urine MCP-1/creatinine and urine activin A/creatinine had non-significant relationships with tertile status. Following eGFR adjustment, among the kidney injury biomarkers, only plasma TNFR-1 (OR 6.40, 95% CI 1.08 to 38.00; p=0.04) was independently associated with the high activin A tertile.

(A) Individual plasma activin A and (B) urine activin A/creatinine concentrations by log urine albumin-to-creatinine ratio (UACR) for Mayo (and Galway; plasma only) diabetes cohort. Estimated glomerular filtration rate (eGFR) group distribution is shown for each. Spearman’s correlations: log UACR with plasma activin A (rs=0.48; p<0.0001) and log UACR with urine activin A/creatinine (rs=0.65; p<0.0001) concentrations. Closed circle: eGFR ≥60 mL/min/1.73 m2; closed diamond: eGFR 45–59 mL/min/1.73 m2; open rectangle: eGFR 30–45 mL/min/1.73 m2; open triangle: eGFR ≤30 mL/min/1.73 m2.
Activin A expression in in vitro models of DKD
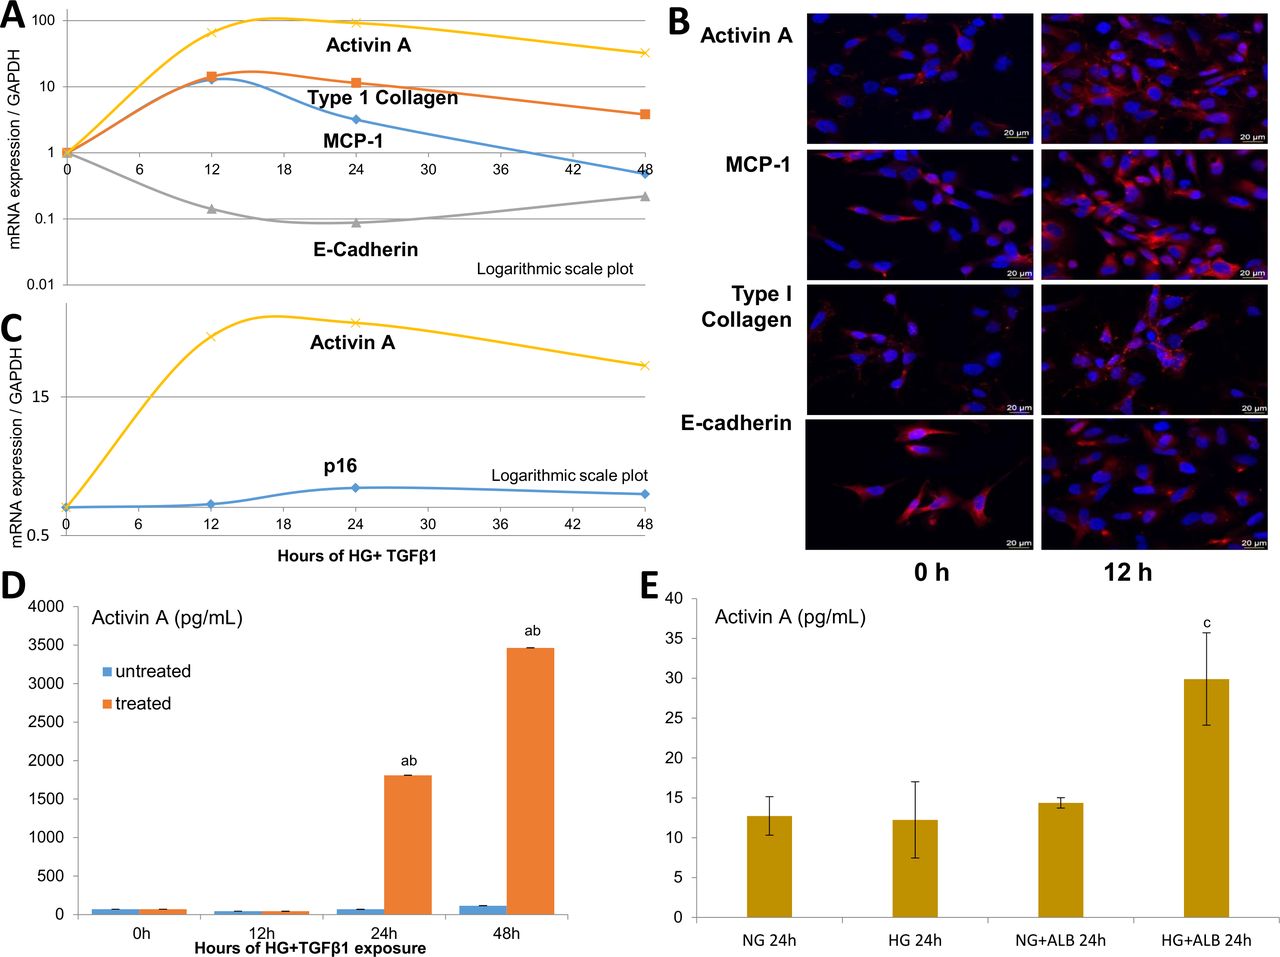
To determine if injured kidney cells express activin A in parallel with other markers of injury and senescence, human proximal tubule epithelial cells (HK-2s) were exposed to HG+TGF-β1 in vitro for 48 hours. The time-dependent expression of MCP-1, E-cadherin, type I collagen and activin A was assessed using RT-PCR (figure 5A). Following injury, gene expression of EMT programme markers suggested a transition from epithelial (a fall in E-cadherin) to mesenchymal (a rise in type I collagen) phenotypes. Furthermore, gene expression of MCP-1 (pro-inflammatory) and activin A (likely profibrotic) increased, peaking at 12 and 24 hours following exposure to HG+TGF-β1 insults, respectively. These findings were confirmed by immunofluorescent staining (figure 5B). Additional studies of senescence markers revealed a rise in p16 gene expression, compared with activin A at 24 and 48 hours (figure 5C).

In vitro models of DKD-related injury. HK-2 studies following incubation with high glucose (HG, 25 mmol/L), transforming growth factor-β1 (TGF-β1; 5 ng/mL) and albumin (ALB, 5 mg/mL). Time-dependent effect of HG+TGF-β1 on the mRNA/gene expression of activin A, monocyte chemoattractant protein-1 (MCP-1; an inflammatory marker), type I collagen (mesenchymal marker) and E-cadherin (epithelial marker) in injured HK-2 cells (A) Immunofluorescent staining of HK-2 cells injured by HG+TGF-β1 at 12 hours (h) compared with baseline (B) Time-dependent effect for activin A and p16 expression in injured HK-2 cells (C) Protein levels of activin A in the supernatant of HK-2 treated with HG+TGF-β1 (D) and combinations of HG with or without ALB (E) at 24 hours. Values are mean±SEM. aP<0.05 compared with untreated HK-2 groups; bp<0.05 compared with the previous group; cp<0.05 compared with all prior groups. Scale bars: 20 µm.
Given the relationship between UACR and plasma activin A levels in human diabetes, we tested the effect of HG alone and with human serum albumin on HK-2 cells. While HG had minimal effect on activin A release by HK-2, addition of albumin to culture medium induced a robust increase in supernatant activin A levels at 24 hours (figure 5E), although more modest than induced by the combination of HG+TGF-β1 (figure 5D).
Discussion
This study is the first comprehensive study we are aware of focused on the relationship between circulating activin A levels and kidney function in adults with diabetes and metabolically healthy controls. Importantly, an inverse relationship was identified between activin A concentrations and kidney function in two independent diabetes cohorts over a wide eGFR range. Low serum albumin levels, but not metabolic status (eg, hemoglobin A1c) or the inflammatory marker CRP, appeared to be linked to activin A concentration. The independent relationship between albuminuria and activin A potentially indicates that proteinuric kidney disease may be characterized by a distinctive injury with increased senescence phenotype compared with DKD without albuminuria. Finally, a co-association with biomarkers (eg, TNFR-1) that are more directly linked to inflammatory response and renal tubular injury was demonstrated both in adults with diabetes and in a cell culture model of diabetic tubulopathy. Collectively, these findings provide novel evidence that maladaptive inflammation and cellular senescence track together in DKD and that therapies designed to target both pathways (eg, anti-activin, senolytic and regenerative cell-based therapies) could be pursued alongside informative biomarker assays.
Activin A is produced by a variety of tissues, including inflamed adipose tissue and injured kidney cells. It is postulated that in the normal, non-injured kidney, glomerular filtered activin A is reabsorbed by renal tubules via endocytosis, which in the setting of tubular dysfunction, contributes to increased urine concentrations.19 This could explain why higher urine activin A levels (not normalized for creatinine) in individuals with AKI did not strongly correlate with plasma activin A levels.19 However, animal studies also suggest that activin A originates from injured kidney cells. In experimental studies, elevated activin A was derived directly from renal tubule epithelial cells in streptozotocin-treated38 and UUO25 rat models, from myofibroblasts in Alport CKD mice,22 25 renal interstitial cells in Ldlr–/– high fat-fed mice with ablative CKD,22 infiltrating macrophages in lupus nephritis mice23 and glomerular culture supernatants in an anti-Thy1 glomerulonephritis rat model.39 Furthermore, while UUO induced activin A gene expression in the kidney and its release into the circulation, these findings were not observed in the plasma, contralateral kidney or remnant kidney of unilaterally nephrectomized rats having similar fall in total GFR, suggesting the obstructed kidney as the source.24 In our human diabetes studies, albuminuria, reflective of kidney injury, directly correlated with activin A in plasma and urine. Plasma activin A also independently and directly correlated with TNFR-1, a robust biomarker for progressive DKD.28 30 40 41 Notably, an upsurge in urinary activin A levels was only detected in those with significant proteinuria, whereas the relationship between its plasma levels and UACR was more continuous (figure 4), supporting a link between albumin-induced tubular injury and urinary activin A. Moreover, given that in our study urine activin A concentrations rose as plasma levels increased in the setting of reduced GFR, high plasma activin A levels in DKD may be the result of multiple mechanisms, but are unlikely to reflect reduced clearance. Cumulatively, these studies provide insight into the influence of kidney injury, rather than impaired renal handling alone, on circulating activin A levels.
This study is strengthened by use of the largest cohort of individuals with DKD (or CKD) to date to undergo measurement of plasma and urine activin A. Harada et al42 previously found higher circulating activin A concentrations in older individuals and those with cirrhosis, advanced solid cancer, pregnancy and CKD (n=41) compared with non-diseased controls. Nonetheless, despite the pathophysiological relevance and potential for clinical application, subsequent studies assessing the relationship between kidney function and activin A levels have been sparse. Recently, in over 400 older community dwelling adults in Taiwan (19% diabetes; mean eGFR 82.5 mL/min/1.73 m2), Peng et al43 showed that eGFR was lowest in the highest tertile of plasma activin A. After adjustment for confounding variables, however, only older age, metabolic syndrome and uric acid remained associated with higher tertile status. In our study of over 200 individuals with diabetes (55% with eGFR <60 mL/min/1.73 m2; mean eGFR 41.4 mL/min/1.73 m2), we identified an inverse association between circulating activin A and eGFR. This finding may reflect increased tissue inflammation, cellular senescence burden and/or activin A production by injured kidney cells.
While kidney injury related closely to circulating activin A levels in our study, other systemic processes have been associated with activin A. Despite the known relationship with inflammation, in our study, the inflammatory marker CRP did not correlate with activin A concentrations. Nonetheless, serum albumin, a marker of nutritional status and inflammation in CKD,44–46 correlated inversely with activin A. Surprisingly, metabolic status, indicated through current glycemic control (hemoglobin A1c), was not a significant influencer of activin A levels beyond kidney function. Our in vitro studies explored the effects of glucose, albumin and TGF-β1 on activin A gene expression and protein release by human kidney cells. Notably, high glucose exposure alone was insufficient to activate release of activin A by HK-2 cells. Yet, the addition of albumin to high glucose-containing medium evoked this response. Moreover, our diabetic tubulopathy model of high glucose plus TGF-β1 led to marked upregulation of inflammatory and profibrotic EMT markers followed by release of activin A robustly into cell culture supernatant. Together, the associations between serum albumin, urine protein excretion rate (albuminuria) and activin A suggest proteinuric kidney disease relates to more robust inflammatory signatures and increased senescent cell abundance compared with
CKD without albuminuria. Based on these relationships, we tested gene expression of senescence markers in HK-2 cells and found a modest rise in p16 levels after DKD injury. Possibly, a 48-hour exposure was insufficient to upregulate these genes in HK-2 cells and activin A represents an early mediator of the pro-inflammatory, profibrotic state associated with DKD senescence. Nonetheless, our studies support the notion that activin A relates to kidney injury associated with changes in kidney function, increased cellular senescence and possibly adipose tissue dysfunction in individuals with DKD.
Beyond being a potential biomarker of DKD injury or cellular senescence, activin A plays an active role in kidney damage and might thus constitute a therapeutic target. In a prior study, we demonstrated that clearance of senescent cells in DIO mice improved podocyte function.15 More in-depth studies of activin A-induced kidney dysfunction have been performed by others. Notably, activin A-induced kidney dysfunction in a Ldlr−/− CKD mouse model (fibrosis and proteinuria) and in a polycystic kidney disease mouse model (fibrosis and cyst formation) was decreased by blocking activin A effect via the activin receptor type IIA ligand trap, RAP-011, and a soluble activin receptor IIB fusion protein.22 47 Anti-activin therapy tested in early phase clinical trials of muscular diseases, osteoporosis, postmenopausal anemia and cancer showed variable side effects and efficacy.48 49 Additional efforts are also underway to modify the CKD-associated SASP in clinical trials of DKD (Clinicaltrials.gov: NCT02848131; NCT03325322),12 50 with recent evidence illustrating that senolytics reduce senescent cell abundance in humans.51
Our study had limitations. First, the cross-sectional study design did not permit assessment of causal relationships among diabetes, kidney function and circulating activin A concentrations. Reverse causality still remains a possibility as reduced GFR may increase activin A levels via reducing their renal clearance thus prospective studies are needed. Second, the study population was mostly white, and the sex distribution was unequal between controls and diabetes, limiting generalizability. However, we did not detect an association between sex and activin A levels in these cohorts. Furthermore, the Galway cohort was specifically enrolled from general diabetes, nephrology and diabetic nephropathy clinics to parallel the environment found in community-dwelling individuals, therein improving generalizability. Third, while this is the first and largest study in a predominantly DKD population, it had a modest sample size, limiting statistical power. Nonetheless, findings were predominantly consistent between the two distinct cohorts.
In conclusion, we observed in two independent cohorts elevated circulating activin A levels in individuals with diabetes, which correlated inversely with kidney function and directly with albuminuria and other kidney injury markers. In vitro studies demonstrated that activin A is produced directly in copious amounts by renal tubular cells exposed to high glucose plus TGF-β1 or albumin, likely contributing to overproduction of circulating activin A. Ongoing prospective follow-up of these findings will allow us to assess the power of plasma activin A as a marker of DKD progression and therapeutic success in the future.
Acknowledgments
The authors would like to thank all study participants and study coordination team members of Mayo Clinic: Donna K Lawson CCRP, LPN, Jennifer M Manggaard CCRP, Tammie L Volkman RN, Erin Wissler Gerdes, Marcia K Mahlman CCRP, Beverly K Tietje CCRP and Tamara K Evans. The authors would like to thank Shannon K Meier for secretarial support. The authors would also like to thank the scientific, nursing and medical staff at the Centre for Endocrinology, Diabetes and Metabolism and the Department of Clinical Biochemistry, Saolta University Health Care Group (SUHCG), Galway University Hospitals.
References
Footnotes
XB and TPG are co-first authors.
Contributors All authors contributed in the following: substantial contributions to the conception or design of the work, or the acquisition, analysis or interpretation of data. Drafting the work or revising it critically for important intellectual content. Final approval of the version published. Agreement to be accountable for all aspects of the work in ensuring that questions related to the accuracy or integrity of any part of the work are appropriately investigated and resolved.
Funding This project was supported by funding from the Extramural Grant Program of Satellite Healthcare (LJH), Regenerative Medicine Minnesota (RMM 091718; LJH); National Institute of Health (NIH) grant K23 DK109134 (LJH), UL1 TR002377 (LJH; Mayo Clinic), UL1TR000135 (LJH; Mayo Clinic) and Mayo Center for the Science of Health Care Delivery (LJH, Kern Scholar Program). Additional support was provided by NIH grants R01 DK102325 (LOL), R01 DK120292 (LOL), R01 DK100081 (SCT), T32 DK07013 (SMC), DK106427 (AE), DK118120 (SMH), K23 DK114497 (RGMcC) and AG13925 (JLK), the Ted Nash Long Life and Noaber Foundations (JLK), the Connor Group (JLK) and Robert J. and Theresa W. Ryan (JLK). XB is supported by Natural Science Foundation of Liaoning Province (No. 2015020490). TPG is supported by a Hardiman Scholarship from the College of Medicine, Nursing and Health Science, National University of Ireland Galway and a bursary from the Irish Endocrine Society/Royal College of Physicians of Ireland. The Galway authors are supported by grants from the European Commission (Horizon 2020 Collaborative Health Project NEPHSTROM) (grant number 634086; TPG, MNI, MDG), Science Foundation Ireland (REMEDI Strategic Research Cluster (grant number 09/SRC-B1794; MDG), CÚRAM Research Centre (grant number 13/RC/2073; MDG)), and the European Regional Development Fund.
Competing interests None declared.
Patient consent for publication Not required.
Ethics approval Mayo Clinic Institutional Review Board, Clinical Research Ethics Committees, Galway University Hospitals (Ref: C.A. 1404) and the National University of Ireland Galway, Research Ethics Committee (Ref: 16-July-05) approved these studies.
Provenance and peer review Not commissioned; externally peer reviewed.
Data availability statement All data relevant to the study are included in the article or uploaded as supplementary information.