Article Text

Abstract
Introduction Risk of insulin resistance, dyslipidemia, diabetes and cardiac death is increased in Asians and Europeans with normal glucose tolerance (NGT) and 1-hour glucose ≥8.6 mmol/L. As African descent populations often have insulin resistance but a normal lipid profile, the implications for Africans with NGT and glucose ≥8.6 mmol/L (NGT-1-hour-high) are unknown.
Objective We performed oral glucose tolerance tests (OGTTs) in 434 African born-blacks living in Washington, DC (male: 66%, age 38±10 years (mean±SD)) and determined in the NGT group if either glucometabolic or lipid profiles varied according to a 1-hour-glucose threshold of 8.6 mmol/L.
Methods Glucose tolerance category was defined by OGTT criteria. NGT was subdivided into NGT-1-hour-high (glucose ≥8.6 mmol/L) and NGT-1-hour-normal (glucose <8.6 mmol/L). Second OGTT were performed in 27% (119/434) of participants 10±7 days after the first. Matsuda Index and Oral Disposition Index measured insulin resistance and beta-cell function, respectively. Lipid profiles were obtained. Comparisons were by one-way analysis of variance with Bonferonni corrections for multiple comparisons. Duplicate tests were assessed by к-statistic.
Results One-hour-glucose ≥8.6 mmol/L occurred in 17% (47/272) with NGT, 72% (97/134) with pre-diabetes and in 96% (27/28) with diabetes. Both insulin resistance and beta-cell function were worse in NGT-1-hour-high than in NGT-1-hour-normal. Dyslipidemia occurred in both the diabetes and pre-diabetes groups but not in either NGT group. One-hour glucose concentration ≥8.6 mmol/L showed substantial agreement for the two OGTTs (к=0.628).
Conclusions Although dyslipidemia did not occur in either NGT group, insulin resistance and beta-cell compromise were worse in NGT-1 hour-high. Subdividing the NGT group at a 1-hour glucose threshold of 8.6 mmol/L may stratify risk for diabetes in Africans.
- oral glucose tolerance test
- insulin resistance
- insulin secretion
- African-origin populations
This is an open access article distributed in accordance with the Creative Commons Attribution Non Commercial (CC BY-NC 4.0) license, which permits others to distribute, remix, adapt, build upon this work non-commercially, and license their derivative works on different terms, provided the original work is properly cited, appropriate credit is given, any changes made indicated, and the use is non-commercial. See: http://creativecommons.org/licenses/by-nc/4.0/.
Statistics from Altmetric.com
Significance of this study
What is already known about this subject?
The prevalence of diabetes in Africans is rapidly rising. Yet paradigms to identify Africans at highest risk have not yet identified.
What are the new findings?
Africans identified by an oral glucose tolerance test to have normal glucose tolerance (NGT) and elevated 1-hour glucose concentration (≥8.6 mmol/L) are as insulin resistant as Africans with diabetes.
Beta-cell function is compromised in Africans with NGT and elevated 1-hour glucose concentration (≥8.6 mmol/L).
Africans with NGT and 1-hour glucose ≥8.6 mmol/L may be at high risk for developing diabetes.
Dyslipidemia is not characteristic of Africans with NGT and 1-hour glucose ≥8.6 mmol/L.
How might these results change the focus of research or clinical practice?
Our research findings create new questions which influence future study design research and clinical care. For example:
Will lifestyle interventions compared with usual care in Africans with NGT and 1-hour glucose concentration ≥8.6 mmol/L lower the rate of conversion from NGT to pre-diabetes/diabetes?
As 1-hour glucose concentration is linked to insulin secretion, will 1-hour glucose concentration combined with a readily accessible measure of insulin resistance, such as homeostatic model assessment of insulin resistance, become an epidemiological tool to evaluate the relative importance of beta-cell compromise versus insulin resistance in the etiology of diabetes in Africans?
Will there be added value to NGT-1-hour-high in Africans in whom glycated hemoglobin interpretation may be compromised because of anemia, heterozygous hemoglobinopathy or G6PD (glucose-6-phosphate dehydrogenase) deficiency?
To address the rising prevalence of diabetes in Africans, detection of Africans at risk for diabetes is imperative.1 Analysis of oral glucose tolerance (OGTT) data from prospective studies conducted in Europe and the USA reveals that a 1-hour glucose ≥8.6 mmol/L in individuals with normal glucose tolerant (NGT) powerfully predicts risk for diabetes, diabetes complications, cardiovascular events and all-cause mortality.2–4 Cross-sectional studies from Europe, the USA and Asia have demonstrated that insulin resistance, beta-cell failure and dyslipidemia are more common when NGT occurs with 1-hour glucose ≥8.6 mmol/L (NGT-1-hour-high) than with 1-hour glucose <8.6 mmol/L (NGT-1-hour-normal).5–10 Therefore, it has been suggested that the NGT category be divided into two groups based on a 1-hour threshold of 8.6 mmol/L and those with NGT-1-hour-high should be enrolled in programs to prevent progression.11 12
However, the value of obtaining NGT-1-hour-high in Africans is unknown. There are major differences by race/ethnicity in insulin resistance, beta-cell function and lipid concentrations.13–19 Therefore, studies conducted in Europeans, Asians and even African Americans may not be directly applicable to Africans. To determine whether there is value in obtaining 1-hour glucose samples during an OGTT in Africans, data collected from African-born populations are necessary.
Therefore, we performed OGTT in 434 African born-blacks (male: 66%, age 38±10 years (mean±SD)) living in the Washington, DC, metropolitan area and divided the cohort into four groups (NGT-1-hour-normal, NGT-1-hour-high, pre-diabetes, diabetes) to determine if either glucometabolic or lipid profiles varied according to a 1-hour-glucose threshold of 8.6 mmol/L in the NGT group.
Research design and methods
Population
The Africans in America cohort was established to assess risk for diabetes and heart disease in African-born blacks living in the USA.20 21 Recruitment was by newspaper advertisements (45%), participant referrals (30%), presentations at community events, flyers and electronic outreach. Written informed consent was obtained prior to enrollment.
Eligibility was determined by telephone interview. Enrollees had to affirm they were born in sub-Saharan Africa to two black parents who were also born in Africa. Additionally, they had to state that they were healthy and, to their knowledge, did not have diabetes.
After successfully completing the telephone interview, 478 African-born blacks living in metropolitan Washington, DC, had an outpatient visit at the Clinical Center. A history, physical and routine blood tests were performed. Based on the screening visit results, 43 individuals were excluded. Reasons for exclusion were: anemia (n=11), elevated liver transaminases (n=1), declined blood draw (n=2), pregnancy (n=3), hypothyroidism (n=1), intravenous access issues (n=4) and scheduling or other non-medical reasons (n=21). In addition, one individual was excluded because the 1-hour glucose sample was unavailable due to an intravenous access problem. Hence, 434 individuals proceeded to OGTT-1.
Initially only participants with an OGTT who met glucose criteria for diabetes were invited for a second OGTT (OGTT-2, group A). The study protocol was later modified to include two OGTTs regardless of the findings of the initial study (group B) (online supplementary figure 1).
Supplemental material
Group A consisted of 331 consecutively enrolled individuals. Of the 21 individuals who met glucose criteria for diabetes, 18 returned for an OGTT-2.22
Group B consisted of the 103 individuals and all were invited to return for an OGTT-2. A total of 101 agreed to have an OGTT-2 within 11±1 days of the initial study. Therefore, duplicate OGTT data are available for 119 participants (18 from group A; 101 from group B) (online supplementary figure 1).
No instructions on diet or exercise were given prior to the OGTT.
OGTT-1
Participants fasted for 12 hours and came to the Clinical Center at 7:00. Weight, height, blood pressure and waist circumference (WC) were obtained.21 A blood sample was obtained for glycated hemoglobin measurement and hemoglobin electrophoresis. OGTT-1 was performed with 75 g dextrose (Trutol 75; Custom Laboratories, Baltimore, Maryland, USA). Blood samples for determination of glucose and insulin concentrations were taken at baseline, 0.5 hour, 1 hour and 2 hours.
After OGTT-1 was completed, a CT scan (Siemens and Somatom Force Scanner, Munich, Germany) was performed for measurement of visceral adipose tissue at vertebrae L2–3 using automated software.21
OGTT-2
One hundred and nineteen participants returned to the Clinical Center for OGTT-2. At the time of the OGTT-2, the results of the first OGTTs were not known to the participants.
Diagnosis of glucose tolerance status
A priori, glucose tolerance category was based on American Diabetes Association criteria for glucose concentrations obtained during OGTT-1.22
Normal glucose tolerance (NGT)
Fasting blood glucose (FPG) <5.6 mmol/L and 2-hour glucose <7.8 mmol/L.
Pre-diabetes
5.6 mmol/L≤FPG<7.0 mmol/L (impaired fasting glucose)
or
7.8 mmol/L<2-hour glucose<11.1 mmol/L (impaired glucose tolerance).
Diabetes
FPG ≥7.0 mmol/L
or
2-hour glucose ≥11.1 mmol/L.
The NGT group was subdivided into two groups:
NGT and 1-hour glucose <8.6 mmol/L (NGT-1-hour-normal).
NGT and 1-hour glucose ≥8.6 mmol/L (NGT-1-hour-high).
Thus, four glucose tolerance groups were analyzed:
NGT-1-hour-normal.
NGT-1-hour-high.
Pre-diabetes.
Diabetes.
Physiological measurements obtained from the OGTT


Beta-cell function
Disposition Index (DI)25 :

Glucose, insulin, liver enzymes were analyzed in serum with Roche Cobas 6000 analyzer (Roche Diagnostics, Indianapolis, Indiana, USA).
Cholesterol, triglycerides (TG) and direct high-density lipoprotein cholesterol (HDL-C) were measured enzymatically on the Cobas 6000 analyzer (Roche Diagnostics). Low-density lipoprotein cholesterol (LDL-C) was calculated using the Friedewald equation.26 LDL particle number, and HDL and LDL size were measured by nuclear magnetic resonance (NMR) on the Vantera analyzer, using the Lp3 algorithm (LabCorp).
Hemoglobin, hematocrit, white cells and mean corpuscular volume (MCV) were measured in EDTA-anticoagulated whole blood using a Sysmex XE-5000 analyzer (Chicago, Illinois, USA). Iron, transferrin and ferritin were measured in serum (Roche Cobas 6000 analyzer).
Hemoglobin electrophoresis
Three hundred and three consecutively enrolled individuals had hemoglobin electrophoresis. However, 131 participants were enrolled before hemoglobin electrophoresis was included in the protocol. These 131 individuals had hemoglobin type determined by high-performance liquid chromatography (HPLC). Of these 131 participants, 7 had variant hemoglobin reported on their HPLC report but their HPLC tracing was unavailable. Therefore, the specific hemoglobinopathy could not be determined (ie, sickle cell trait (SCT), hemoglobin C (HbC) trait, etc). They were classified as heterozygous hemoglobin-unknown type.
Statistical analyses
Unless stated otherwise, data are presented as mean±SD. For continuous variables, comparisons were by one-way analysis of variance with Bonferroni corrections for multiple comparisons. Categorial variable comparisons were by χ2 test.
Reproducibility
To evaluate the reproducibility of glucose concentrations between OGTT-1 and OGTT-2, agreement was determined using the kappa-statistic (к-statistic), Lin concordance correlation coefficient, Bland-Altman limits of agreement, Pittman’s test and paired t-test (online supplementary table 2). The к-statistic was interpreted according to standard criteria (slight (0–0.20), fair (0.21–0.40), moderate (0.41–0.60), substantial (0.61–0.80) or excellent (0.81–1.0)).27
Data were managed with REDCap (Research Electronic Data Capture).28 P-values ≤0.05 were considered significant. Analyses were performed with STATA (V.15, College Station, Texas, USA).
Results
The African region of origins of the participants were West (53%), Central (21%) and East (26%). Characteristics of the enrollees by region are provided in online supplementary table 1. Current age of the participants and age at the time of immigration were: 38±10 years and 26±11 years, respectively, and did not vary by region. The mean number of years lived in the USA was 12±10 years. West Africans lived in the USA the longest (p=0.032).
Iron, transferrin saturation and ferritin did not differ by African region (online supplementary table 1). Less than 4% (12/315) of participants had iron deficiency. West and Central Africans had a higher prevalence of SCT than East Africans (p<0.001). HbC trait only occurred in West Africans. Consistent with a higher prevalence of heterozygous hemoglobinopathies, West and Central Africans had lower MCV than East Africans (p=0.013). Glucometabolic characteristics did not vary by African region (online supplementary table 1).
Glucose tolerance groups
Prevalence of NGT, pre-diabetes and diabetes were: 62% (272/434), 31% (134/434) and 7% (28/434), respectively. Participants with NGT were younger than those with pre-diabetes and diabetes: 36±10 vs 42±10 and 44±9 years (both p<0.001).
An elevated 1-hour glucose (≥8.6 mmol/L) occurred in 17% (47/272) with NGT, 72% (97/134) with pre-diabetes and 96% (27/28) with diabetes (figure 1, table 1).
Characteristics by glucose tolerance category
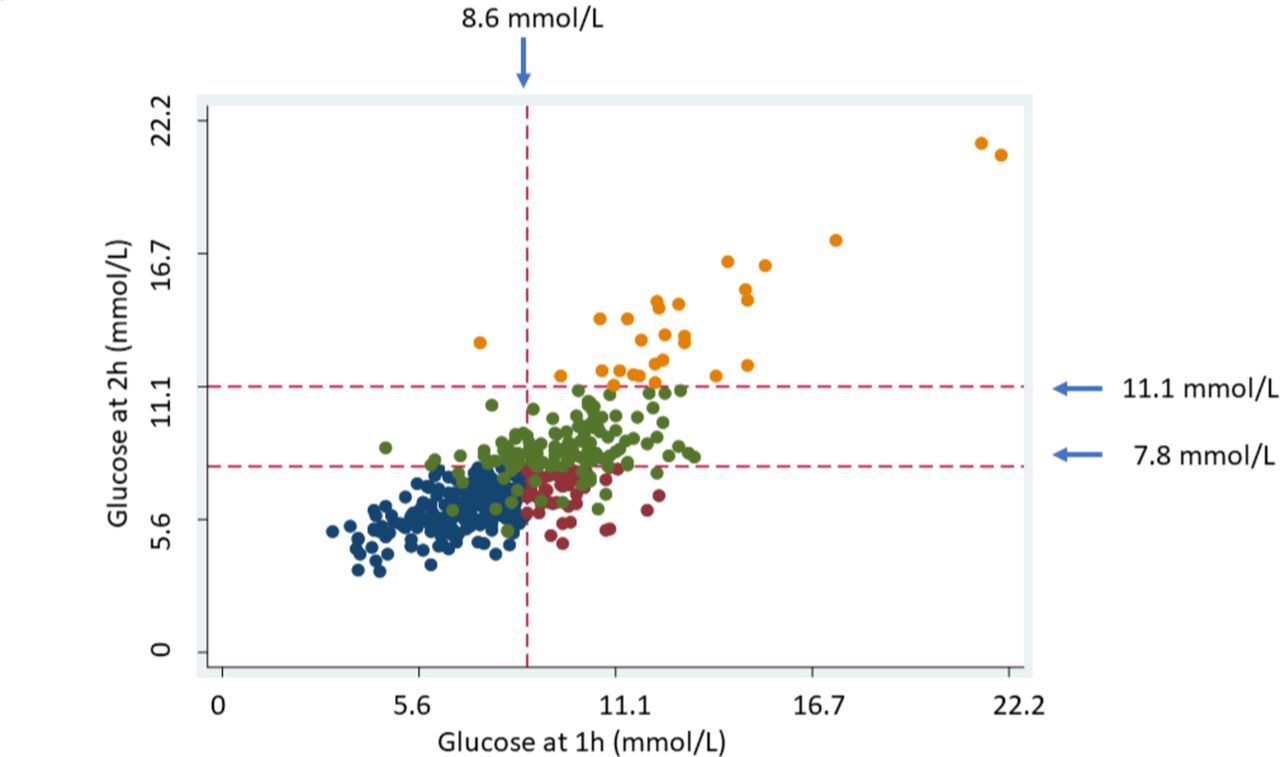
Distribution of glucose concentration at 1 hour and 2 hours for the four glucose tolerance categories.Blue circles: NGT-1-hour-normal (n=225); red circles: NGT-1-hour-high (n=47); green circles: pre-diabetes (n=134); dark yellow circles: diabetes (n=28). NGT-1-hour-high, normal glucose tolerance occurs with 1-hour glucose ≥8.6 mmol/L; NGT-1-hour-normal, normal glucose tolerance occurs with 1-hour glucose <8.6 mmol/L.
Body size
Body mass index (BMI) was lowest in the NGT-1-hour-normal group and highest in the group with diabetes. The upward trend in BMI was significant (p<0.001), but the between-group differences were not (online supplementary figure 2A). Both the pre-diabetes and diabetes groups had higher WC and VAT than the NGT groups (table 1; online supplementary figure 2B,C).
Glucometabolic characteristics
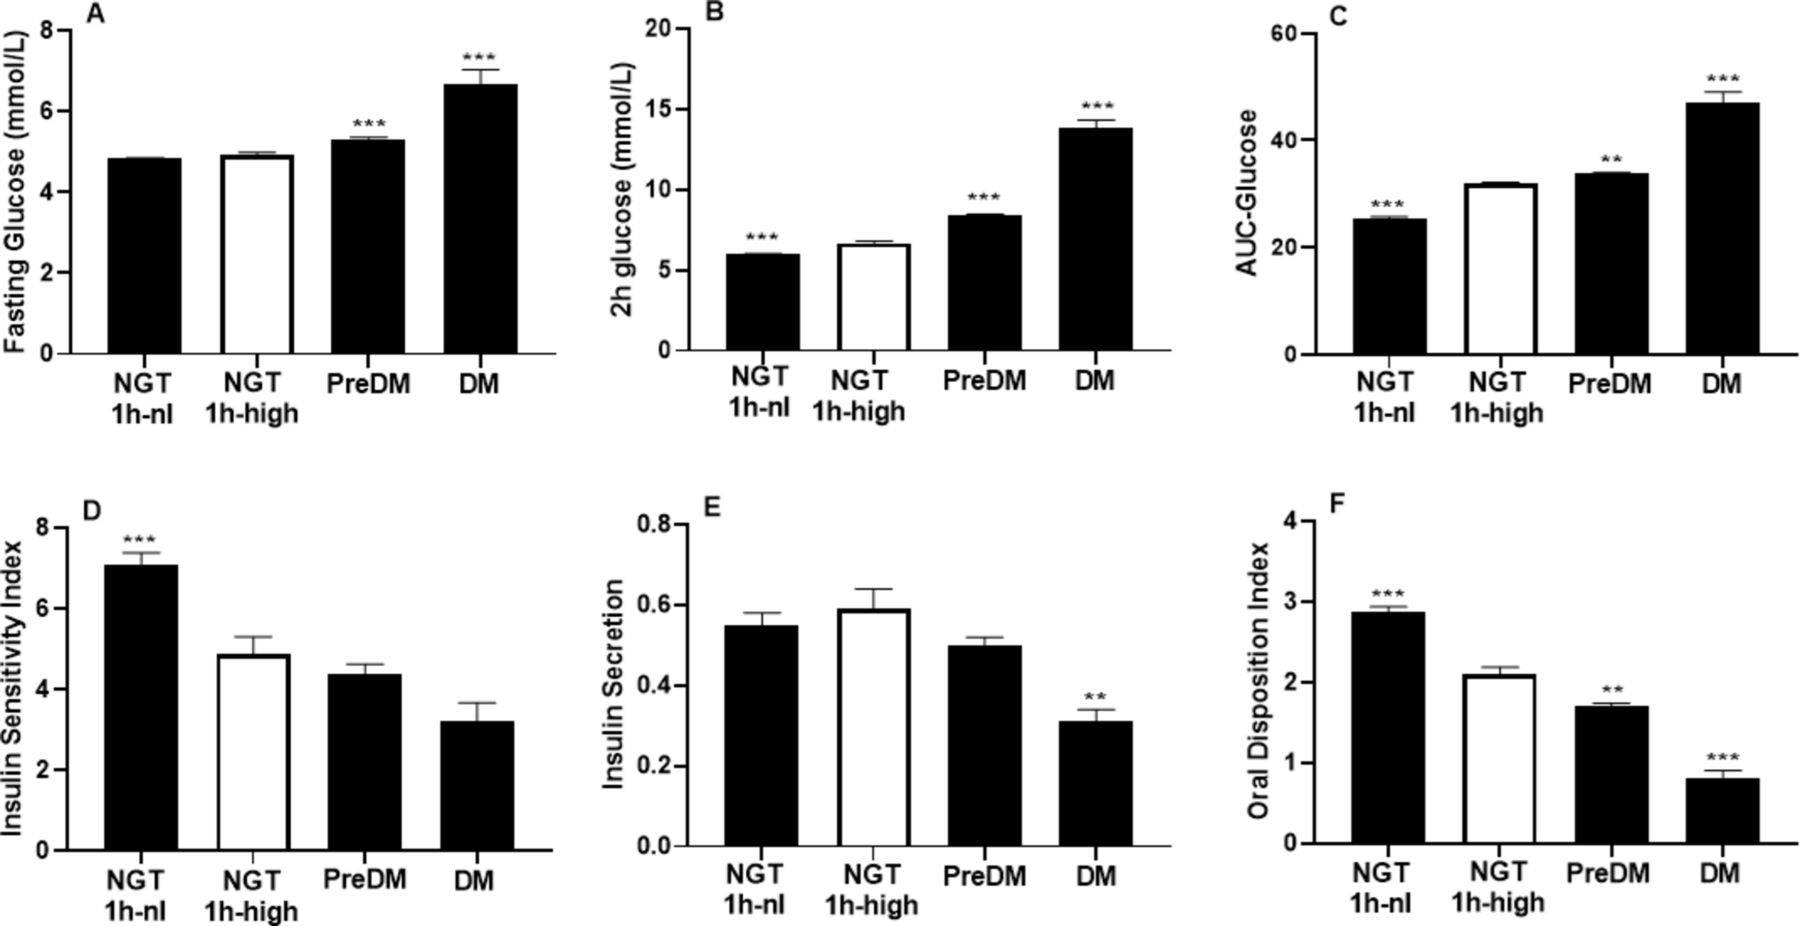
FPG did not differ in the two NGT groups (table 1, figure 2A). However, both 2-hour glucose and AUC-glucose in the NGT-1-hour-high group were higher than in NGT-1-hour-normal group (table 1, figure 2B,C).

Glucometabolic parameters according to glucose tolerance category. (A) Fasting glucose; (B) 2-hour glucose; (C) AUC-glucose; (D) Insulin Sensitivity Index (Matsuda Index); (E) insulin secretion; (F) Oral Disposition Index. Data adjusted for age and African region of origin and presented as mean±SE. The NGT-1-hour-high group is the comparison group. *p≤0.05,**p≤0.01, ***p≤0.001. AUC-glucose; area under the glucose curve; DM, diabetes mellitus; NGT-1-hour-high, normal glucose tolerance occurs with 1-hour glucose ≥8.6 mmol/L; NGT-1-hour-nl, normal glucose tolerance occurs with 1-hour glucose <8.6 mmol/L; pre-DM, pre-diabetes mellitus.
Insulin resistance in the NGT-1-hour-high group was worse than in NGT-1-hour-normal group (table 1, figure 2D) but similar to the pre-diabetes and diabetes groups.
There was no difference in insulin secretion in NGT-1-hour-high and NGT-1-hour-normal. However, the Oral Disposition Index (which represents beta-cell secretion adjusted for insulin resistance) was best in the NGT-1-hour-normal group and declined across groups with worsening glucose tolerance (figure 2F).
Lipid profiles
The NGT-1-hour-high and NGT-1-hour-normal groups did not differ in any lipid parameters obtained, including cholesterol, TG, HDL, LDL, apoproteins, LDL particle number or HDL and LDL particle size (table 1).
However, the diabetes and pre-diabetes groups had worse lipid profiles than the NGT-1-hour-high and NGT-1-hour-normal groups (table 1).
Reproducibility
Only 7% (8/119) were in the NGT-1-hour-high group.
Therefore, these analyses relate to the 119 people who had duplicate OGTT.
The к -statistics (95% CI) for reproducibility were:
Fasting glucose ≥5.6 mmol/L=0.586 (0.428–0.743).
One-hour glucose ≥8.6 mmol/L=0.628 (0.488–0.768).
Two-hour glucose ≥7.8 mmol/L=0.640 (0.498–0.783).
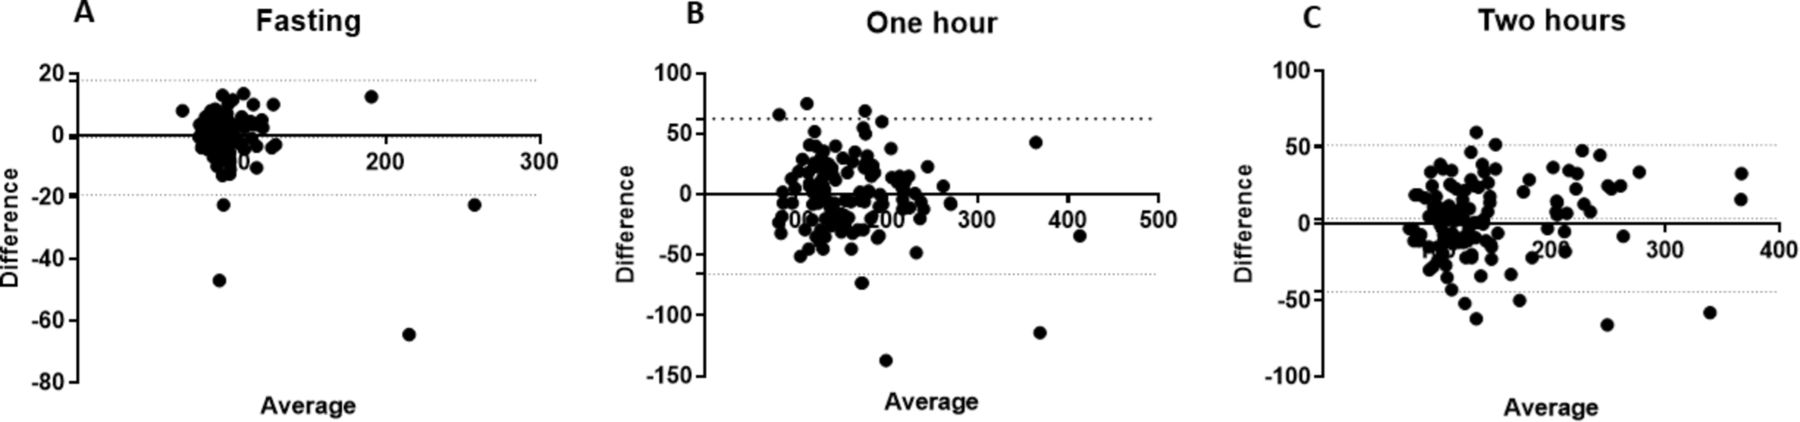
The concordance between baseline, 1-hour-glucose and 2-hour-glucose concentrations for OGTT-1 and OGTT-2 were r=0.92, r=0.85 and r=0.92 (all p<0.001), respectively. Bland-Altman plots for baseline, 1-hour and 2-hour time points are provided in figure 3.

Bland-Altman plot for agreement between glucose concentrations obtained from OGTT-1 and OGTT-2. The x-axis presents the mean and the y-axis presents the difference of the two determinations. (A) Baseline, bias=−0.72, Pittman’s test: r=−0.38, p<0.01; (B) 1 hour, bias=−1.42, Pittman’s test: r=−0.14, p=0.13; (C) 2 hours, bias=3.55, Pittman’s test: r=0.1, p=0.16. OGTT, oral glucose tolerance test.
By paired t-tests, there were no significant differences in glucose concentrations at any time point, AUC-glucose, Insulin Sensitivity Index, insulin secretion or Oral Disposition Index (online supplementary table 2).
Discussion
In this first study of NGT-1-hour-high and NGT-1-hour-normal in African-born blacks, there were two key findings. First, insulin resistance and beta-cell function in the NGT-1-hour-high group were distinctly worse than in the NGT-1-hour-normal group. Second, dyslipidemia did not occur in either NGT group. This latter finding contrasts with most other population studies. Investigations which enrolled whites and Asians demonstrated that the NGT-1-hour-high group is characterized by a combination of adverse glucometabolic characteristics and dyslipidemia.5 6 10 The absence of an atherogenic lipid profile in NGT-1-hour-high in African-born blacks is potentially beneficial and represents a distinct difference from other racial and ethnic groups.
Glucose physiology
Only 17% of African-born blacks with NGT had 1-hour glucose ≥8.6 mmol/L. This relatively low rate of 1-hour-glucose-high in the NGT group is similar to the rates reported in whites and Mexican-Americans.7 29
With data from the Africans in America cohort, we confirmed that NGT-1-hour-normal and NGT-1-hour-high are two distinctly different glucometabolic groups. Based on 2-hour glucose and AUC-glucose, the participants with NGT-1-hour-high were distinctly more hyperglycemic than the participants with NGT-1-hour-normal.
Potential reasons for the difference in glycemia in the two groups include greater insulin resistance, worse beta-cell dysfunction and increased glucose absorption by the gut. Our data suggest that insulin resistance contributes to the greater glycemia experienced by NGT-1-hour-high group than the NGT-1-hour-normal. Not only was insulin resistance worse in the NGT-1-hour-high group than the NGT-1-hour-normal group, insulin resistance in the NGT-1-hour-high, pre-diabetes and diabetes group were similar. In addition, we present evidence that impaired beta-cell function has a major role. The DI, which is the product of insulin resistance and insulin secretion, is the classic measure of whether beta-cells are able to overcome insulin resistance.25 In our study, the DI was lower in the NGT-1-hour-high than the NGT-1-hour-normal. Furthermore, the DI was highest in the NGT-1-hour-normal group and lowest in the diabetes group. Hence, this cross-sectional study suggests, but does not prove, a major role for decline in beta-cell function across glucose tolerance categories starting with NGT-1-hour-high and ending with diabetes.
Differences in gut absorption of glucose have been postulated to contribute to the higher glucose levels observed in the NGT-1-hour-high group than the NGT-1-hour-normal group. Findings to date, however, have not been consistent. Adams et al performed an OGTT and labeled mixed-meal studies in NGT participants with and without 1-hour glucose levels ≥8.6 mmol/L.30 NGT individuals with a glucose concentration at 1-hour glucose ≥8.6 mmol/L were found to have impaired beta-cell function and postprandial glucose absorption was not increased. Fiorentino et al compared duodenal SGLT-1 (sodium/glucose co-transporter 1) expression from biopsy specimens in individuals with NGT and 1-hour glucose <8.6 mmol/L, with those having NGT and 1-hour glucose ≥8.6 mmol/L.31 In contrast to the findings of Adams et al, the NGT 1-hour high group showed an increase in the expression of duodenal SGLT-1 explaining the increased 1-hour absorption of glucose.
Clinical significance
Longitudinal studies such as the San Antonio Heart Study, Malmo Prevention Project and Native American studies have demonstrated that over time the NGT-1-hour-high group has a higher rate of conversion to diabetes, more microvascular complications and a higher rate cardiac events than the NGT-1-hour-normal group.2–4 29 This is why support for investing resources to increase surveillance of NGT-1-hour-high groups is growing.11 12
Lipid profile
In the Africans in America cohort, neither of the NGT groups had atherogenic lipid profiles. This was confirmed by analyzing lipids most closely associated with insulin resistance, such as TG, HDL, LDL particle number and LDL size.
In whites and Asians with NGT-1-hour-high, the dyslipidemia of insulin resistance is well-documented.5 6 32 33 Furthermore, in whites the lipid profiles of the NGT-1-hour-high group are similar to the groups with pre-diabetes and diabetes.5 The fact that this is not the case in African-born blacks reconfirms the well-documented differences in the lipid profile of African and European descent populations.17
Reproducibility of the 1-hour glucose concentration
As 1-hour glucose in the NGT group may be used to trigger enhanced surveillance, it is important to ascertain the reproducibility of 1-hour glucose ≥8.6 mmol/L. Of the 119 Africans with repeat OGTT, only 7% (8/119) were in the NGT-1-hour-high group. Therefore, we focused on assessing the reproducibility of the 1-hour glucose ≥8.6 mmol/L in the entire cohort of 119. Based on the к-statistic, concordance analyses, Bland-Altman limits of agreement, Pitman’s test and paired t-tests, the reproducibility of the glucose value at 1 hour was equivalent to the fasting and 2-hour glucose levels.
Overall, we believe our study is the first to assess the reproducibility of 1-hour glucose ≥8.6 mmol/L in any cohort. In most studies with more than one OGTT, the tests were separated by many weeks to years and often with an interim intervention.34–36 However, we identified two studies which were designed specifically to assess the reproducibility of the glucose concentrations at each time point.37 38 In the first study, Rushforth et al reported in 1975 that with two OGTTs performed 1 to 3 weeks apart in 99 Pima Indians, the 2-hour-glucose had higher reproducibility than the 1-hour glucose.38 However, the processing of the blood samples in this study would no longer be considered optimal. Whole blood samples were kept at room temperature for 2 to 12 hours before centrifugation. In the second study, 84 Cameroonian women in the second trimester of pregnancy had two OGTTs 1 week apart.37 Glucose concentrations at each time point were analyzed using blood obtained by fingerstick. They report no difference by paired t-test in glucose concentration at any time point, including 1 hour.
In short, the results of these studies, combined with our data in African-born blacks demonstrate the minimal variability in glucose concentration at 1 hour. However, none of these results can be used to determine the consistency with which glucose concentration at 1 hour is above 8.6 mmol/L specifically in the NGT group. This is an important area of future investigation.
One-hour glucose as an epidemiological marker of beta-cell function
Diabetes occurs because of a relative imbalance between insulin resistance and beta-cell function. Investigations which have employed both euglycemic-hyperinsulinemic clamps and intravenous glucose tolerance tests have found that 1-hour glucose is associated with insulin secretion, whereas 2-hour-glucose is associated with insulin resistance.3 9 Overall, the contribution of each of these factors to the development of diabetes varies and even includes income and geography.39 In high-income countries, diabetes mainly occurs because of obesity-induced insulin resistance.40 Conversely, beta-cell failure in the absence of obesity is a rising concern in low- and middle-income countries. In an earlier analysis of the Africans in America cohort, we found that beta-cell failure without insulin resistance occurred in 40% of African-born blacks with abnormal glucose tolerance.21 Yet studies in African-born blacks living in America are not sufficient for understanding the African experience with diabetes. Within 2 years of arriving in the USA, African immigrants often experience rapid weight gain.16 This weight gain could alter the balance between insulin resistance and beta-cell failure.
Reasons for beta-cell failure in low- and middle-income countries of Africa are complex but include both genetic and environmental factors such as early life undernutrition.21 39–42 We speculate that data from 1-hour glucose during an OGTT could become an epidemiological tool used to determine the extent of beta-cell dysfunction in African countries. But confirmation requires the conduct of investigations in Africa with OGTT which include glucose levels determined at 1 hour. As the International Diabetes Federation reports that 70% of Africans living with diabetes are undiagnosed, firm conclusions about either the etiology or metabolic characteristics of the various time points during the OGTT are uncertain.
Strengths and weaknesses
Strengths of this study are fourfold. First, we performed multisampled OGTT in an African population. The multisampled OGTT allowed for measurement of insulin resistance by the Matsuda Index and beta-cell function by the Oral Disposition Index. Second, this investigation included both standard lipid parameters as well as NMR measures of lipid particle size and number. Third, duplicate OGTT were performed in 119 participants. If treatment and surveillance recommendations are going to be based on a 1-hour-glucose concentration ≥8.6 mmol/L, an appreciation of the reproducibility of the 1-hour-glucose concentration is critical. Fourth, prior to either OGTT, participants were not instructed on diet and exercise. This makes our OGTT results applicable to actual clinical conditions.
There are weaknesses. Although the sample size was limited, it was sufficiently large to detect important differences in hematological parameters by African region. For example, SCT and HbC trait are known to be more common in West and Central Africa than East Africa. Therefore, it is important that we found significant differences in the prevalence of SCT and HbC trait in our cohort by African region. Further, even MCV was lower in West and Central Africa than East Africa. It is reasonable to assume that since <4% of participants were iron deficient, lower MCV is a consequence of the higher prevalence of the heterozygous hemoglobinopathies. Another challenge is that we recruited a convenience sample. However, the prevalence of diabetes in our cohort was 7% which is similar to the prevalence of diabetes reported in African-born blacks living in Canada.43 Equivalent epidemiological data are not available in the USA.
An additional weakness is the cross-sectional design. However, cross-sectional studies are often the foundation on which prospective studies are built.
Conclusion
The challenge of undiagnosed diabetes in Africa can only be met if practical investigative tools are coupled with well-designed studies in African populations. As African-born blacks in the NGT-1-hour-high group experienced greater insulin resistance and beta-cell compromise than the NGT-1-hour-normal group, subdividing the NGT-group at a 1-hour-glucose threshold of 8.6 mmol/L may be important for risk stratification in Africans. The next step is to determine in prospective studies whether NGT-1-hour-high translates into higher risk for diabetes which can be mitigated by culturally appropriate, feasible interventions.
References
Footnotes
Presented at This study was presented at the American Diabetes Association Scientific Sessions in San Francisco, California, on June 2019.
Contributors SMB, CWD, LSM, STC, AES collected the data. SMB, TH, STC, JH, AS, MKT-R, MB, AES analyzed the data. SMB and AES wrote the manuscript. SMB, TH, CWD, LSM, STC, JH, AS, MKT-R, MB, AES provided critical rewrites. AES is the guarantor of this work and had full access to all the data in the study and takes responsibility for the integrity of the data and the accuracy of the data analysis.
Funding SMB, TH, CWD, LSM, STC, JH, AS, AES were supported by the intramural program of National Institute of Diabetes, Digestive and Kidney Diseases (NIDDK). AES also received support from the intramural program of National Institute on Minority Health and Health Disparities (NIMHD).
Competing interests None declared.
Patient consent for publication Not required.
Ethics approval Institutional Review Board of the NIDDK. ClinicalTrials.gov Identifier: NCT00001853.
Provenance and peer review Not commissioned; externally peer reviewed.
Data availability statement Data are available on reasonable request and can be obtaining by contacting the corresponding author by email at Anne.Sumner@nih.gov.