Article Text

Abstract
Objective We aimed to investigate the effects of prediabetes and its phenotypes of impaired fasting glucose (IFG), impaired glucose tolerance (IGT) and elevated glycated hemoglobin A1c (EHbA1c) on chronic kidney disease (CKD) occurrence, and define the cut-off point of each glycemic index that significantly increases the risk of CKD.
Research design and methods In this prospective cohort study, 6446 non-diabetic subjects aged 40 years and over were followed over a period of 3 years to track the new onset of CKD. Cox regression was used to assess the association of prediabetes and its phenotypes with CKD. Receiver operating characteristic curves were used to define the cut-off point of each glycemic index that significantly increases the occurrence of CKD. Population attributable risk percent was calculated to estimate the contribution of prediabetes to CKD.
Results Compared to subjects with normal glucose tolerance, patients with prediabetes significantly increased the risk of development of CKD (HR=2.33 (1.19–4.55)). Specifically, this increased risk of CKD development was observed in patients with IFG, IGT and EHbA1c. The cut-off points shown to significantly increase the risk of CKD are fasting plasma glucose of 5.63 mmol/L, 2-hour plasma glucose of 6.80 mmol/L and HbA1c of 5.6%. The contribution of prediabetes to CKD occurrence in the study population was 60.6%.
Conclusions This result suggests that the stricter criteria might be needed to define normal plasma glucose level in China that would not be predisposed to diabetic complications, particularly CKD.
- chronic kidney disease
- prediabetes
- HbA1c
- population-based studies
This is an open access article distributed in accordance with the Creative Commons Attribution Non Commercial (CC BY-NC 4.0) license, which permits others to distribute, remix, adapt, build upon this work non-commercially, and license their derivative works on different terms, provided the original work is properly cited, appropriate credit is given, any changes made indicated, and the use is non-commercial. See: http://creativecommons.org/licenses/by-nc/4.0/.
Statistics from Altmetric.com
Significance of this study
What is already known about this subject?
It is well established that diabetes increases the risk of chronic kidney disease (CKD), and the occurrence of diabetes and its complications in high-risk individuals can be prevented or at least alleviated by lifestyle modification and pharmacological intervention.
Studies on the relationship of prediabetic phenotypes as defined by glycemic indices to CKD have also yielded inconsistent results.
What are the new findings?
We found that participants that are still at the stage of prediabetes are already at significantly risk of developing CKD.
These Chinese participants, exhibiting different phenotypes of prediabetes defined by the glycemic indices -impaired fasting glucose, impaired glucose tolerance or elevated glycated hemoglobin A1c all had higher risk of occurrence of CKD compared with participants having normal glucose tolerance.
The levels of these glycemic indices that significantly increase the risk of CKD occurrence (cut-off points) were much lower than those in current use in China (WHO criteria), and are closer to the American Diabetes Association (ADA) criteria for prediabetes.
Significance of this study
How might these results change the focus of research or clinical practice?
The stricter criteria we have used which approximated those criteria of the ADA would indicate that three-fifths of CKD were attributed to prediabetes among all non-diabetic participants.
The current practice in China should be modified to using stricter criteria to define prediabetes and consequently encourage the general Chinese population to maintain their plasma glucose levels below these ranges of glycemic indices in order to reduce the risk of CKD occurrence.
Introduction
Prediabetes is a transitional stage from normal glucose tolerance (NGT) to overt diabetes.1 Chinese adults have been reported to have an overall high prevalence of prediabetes of 35.7%.2 It has been well established that individuals with prediabetes are at high risk of progressing to diabetes,3 and its consequent increased risk of long-term complications in the eye, kidney and cardiovascular system.4–6 We here focused our work on the relationship of prediabetes to chronic kidney disease (CKD) in the Chinese adult population.
Studies have found that a large number of patients with diabetes had an estimated glomerular filtration rate (eGFR) <60 mL/min per 1.73 m2 but without microalbuminuria, and even more in the general population.7–9 In addition, it has been reported that the proportion of individuals with eGFR <60 mL/min per 1.73 m2 was obviously higher than those with elevated urine albumin in the Chinese population over 60 years old (90.6% vs 19.8%).10 Glomerular hyperfiltration, an early manifestation of diabetic kidney disease, has been confirmed to predict an elevated urinary albumin and decreased eGFR in patients with diabetes.11 Therefore, in this study, we focused on the value of eGFR, including its elevation and decline, and used decreased eGFR to define CKD. Although it is well established that diabetes increases the risk of CKD,12 13 whether prediabetes is also a risk factor for impairment of kidney function and occurrence of CKD are unclear. The data from the Framingham Heart Study offspring cohort obtained between 1991 and 1995 suggested that it may not be prediabetes but rather cardiovascular disease risk factors, including gender, age, blood pressure and plasma lipids that are more predictive of the occurrence of CKD.14 Contrary to this report, a cross-sectional study from the Cooperative Health Research in the Augsburg Region (KORA) instead suggested that prediabetes might have harmful effects on the kidney.15 There have also been conflicting reports regarding the association between prediabetes and CKD in the Chinese population.16 17 Fasting plasma glucose (FPG) and 2-hour plasma glucose (2hPG) have been commonly used for the diagnosis of diabetes; and recently, glycated hemoglobin A1c (HbA1c), a measure of long term glucose homeostasis, has also been recommended for diagnosis of diabetes. The KORA study suggested that FPG, 2hPG and HbA1c were all associated with CKD15; however, studies from China, Japan and Korea indicated that it was elevated HbA1c or impaired glucose tolerance (IGT), but not impaired fasting glucose (IFG) increased the risk for CKD,18–20 and one study based on the Systolic Blood Pressure Intervention Trial concluded that FPG was not associated with the development of CKD.21 Therefore, which of these prediabetic glycemic indices is/are genuinely associated with the occurrence of CKD remain unclear.
It is generally accepted that the occurrence of diabetes and its complications in high-risk individuals can be prevented or at least alleviated by lifestyle modification and pharmacological intervention.22 Therefore, it behooves us to determine whether prediabetes is associated with occurrence of CKD and identify the best measurement(s) of glycemic levels that could predict an increased risk of CKD. In current clinical practice, there are no specific cut-off points for the above-mentioned glycemic indices (FPG, 2hPG, HbA1c) for the prediction of CKD. The postulated cut-off points in these three glycemic indices might well represent different phenotypes of prediabetes. In fact, the international standard for the diagnosis of prediabetes is not uniform. According to the WHO, the diagnosis of prediabetes is a FPG of between 6.1 and 6.9 mmol/L (110–125 mg/dL) or a 2hPG of between 7.8 and 11.0 mmol/L (140–199 mg/dL).23 However, according to the American Diabetes Association (ADA), prediabetes is diagnosed as a FPG between 5.6 and 6.9 mmol/L (100–125 mg/dL; “IFG”), or a 2hPG following a 75 g oral glucose tolerance test (OGTT) between 7.8–11.0 mmol/L (140–199 mg/dL; “IGT”) or a HbA1c between 39 and 46 mmol/mol (5.7%–6.4%).24 Which of these two criteria of prediabetes is more sensitive in identifying people in China to be considered at high risk is still unclear. Currently, China uses the WHO criteria for diagnosing prediabetes. Identifying the appropriate cut-off points for these glycemic indices in defining the relevant prediabetes phenotypes for China could provide valuable information in predicting and therefore preventing the occurrence of CKD.
The above provided the motivation for us to pursue the following aims. First, we examined the influence of prediabetes and its phenotypes on CKD occurrence in the Chinese population. Second, we identified the appropriate cut-off point for each of the three glycemic indices that could predict CKD occurrence, and compared the diagnostic value of these cut-off points with the criteria for prediabetes as defined by WHO and ADA.
Methods
Study design
The data of this work are derived from the Pingguoyuan communities of Beijing, a single city center that was chosen for the Risk Evaluation of Cancers in Chinese Diabetic Individuals: A Longitudinal study.25 Residents aged 40 years and over identified by the local residence registration systems were invited to participate in the study, and trained local community workers conducted door-to-door invitations. From January to August of 2012, 10 216 participants from the Pingguoyuan communities of Beijing were enrolled. Among them, 231 provided insufficient information to ascertain CKD; 314 had no information on relevant covariates and 145 with CKD were excluded. Then, 9526 participants were followed up to April and October of 2015, but with exclusion of 573 participants who did not attend to a follow-up physical examination, thus achieving a response rate of 94.0% (8953/9526). There were an additional 247 participants who provided insufficient information to ascertain CKD at the end of the follow-up that had to be excluded, thus a final 8706 participants were included (figure 1). Proportion of participants missing information in various phenotypes of prediabetes and diabetes during follow-up is shown in online supplementary table S1. All of the participants provided a written informed consent at baseline in accordance with the Declaration of Helsinki. The study was approved by the Medical Ethics Committee of Ruijin Hospital, Shanghai Jiaotong University.
Supplemental material
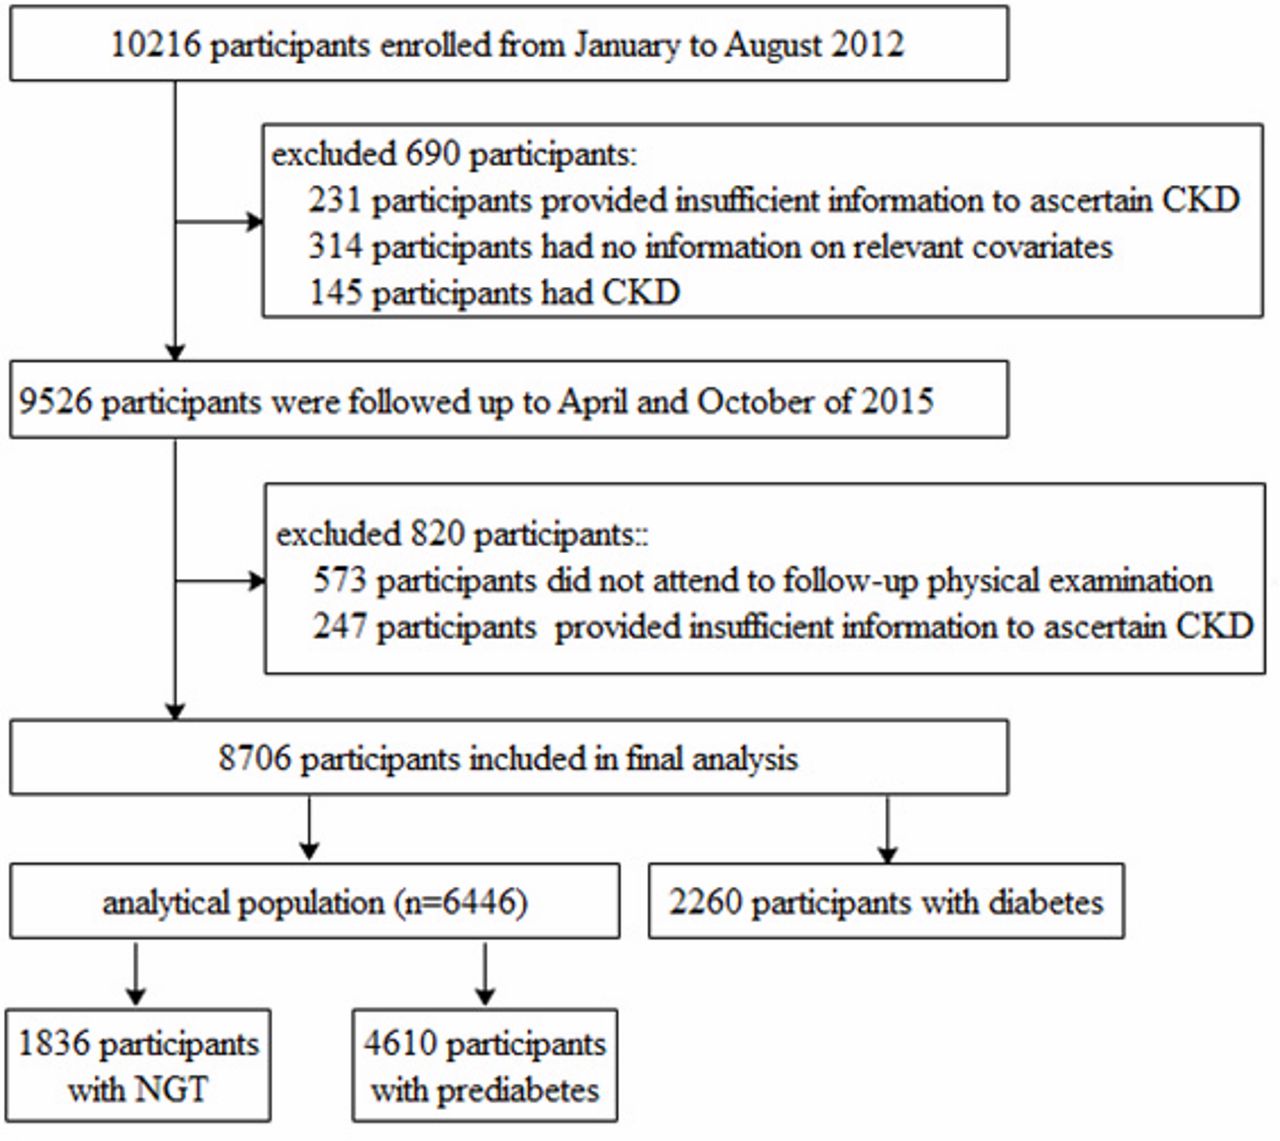
Study flow diagram. CKD, chronic kidney disease; NGT, normal glucose tolerance.
Data collection
To collect baseline information on demography, history of disease and medication use, smoking and alcoholic drinking status, all participants were asked to complete a standard questionnaire by an in-person interview. A physical examination was then conducted by trained personnel to obtain data on weight, height and blood pressure. Weight was measured to the nearest 0.1 kg by an electronic weight scale (Beijing Jianmin) with participants wearing only light clothing and after emptying the bladder. Height was measured with the participants removing their shoes and overcoats, using a vertical height meter to the nearest 0.1 cm. Body mass index (BMI) was calculated as weight (kilograms) divided by height (meters) squared (kg/m2). Blood pressure was measured in triplicate after a 5 min rest, using a mercury sphygmomanometer, and the mean value of the three readings was recorded (Model HEM-752 FUZZY; Omron, Dalian, China).
All participants provided 10 mL of blood sample after an overnight fast (at least 10 hours) for biochemical analyses, including FPG, total cholesterol (TC), triglycerides (TG), high-density lipoprotein cholesterol (HDL-C), low-density lipoprotein cholesterol (LDL-C) and serum creatinine (Scr). Plasma and serum samples were collected into 0.5 mL Eppendorf tubes within 2 hours and immediately stored at −80°C. The 2hPG was measured after the participants had completed the 75 g OGTT. FPG and 2hPG were measured using the hexokinase method within 2 hours after blood sample collection. HbA1c was measured by high-performance liquid chromatography (VARIANT II and D-10 System, BIO-RAD, USA). Blood lipids and Scr were measured with an autoanalyzer (c16000 system, ARCHITECT ci16200 analyzer; Abbott Labora-tories, Chicago, IL, USA), in which the creatinine measurements were standardized to an isotope dilution mass spectrometry reference measurement procedure.
Definitions
CKD was defined as the eGFR <60 mL/min per 1.73 m2.26 Glomerular hyperfiltration was defined as an eGFR over the 95th percentile in different age and sex categories,27 we classified study population into 10 groups according to age and sex, the cut-off points (95th percentile) of CKD Epidemiology Collaboration (CKD-EPI) eGFR were from 94.1 to 113.4 mL/min per 1.73 m2 and Modification of Diet in Renal study (MDRD) eGFR were from 116.8 to 148.2 mL/min per 1.73 m2 (online supplementary table S2). Diabetes was defined according to the ADA criteria based on the OGTT. Prediabetes was defined according to the ADA criteria of having a FPG between 5.6 and 6.9 mmol/L, or a 2hPG following a 75 g OGTT of between 7.8 and 11.0 mmol/L, or a HbA1c between 5.7% and 6.4%.24 Hypertension was defined as systolic blood pressure (SBP) ≥140 mm Hg and/or diastolic blood pressure ≥90 mm Hg from the mean of three measurements taken at baseline or having been previously diagnosed by a health professional.
Supplemental material
Calculation
On the basis of Scr, eGFR was calculated using the CKD-EPI equation28 and a MDRD equation,29 which was expressed in mL/min per 1.73 m2. The equations used for analysis for CKD-EPI, MDRD, attributable risk per cent (ARP) and population attributable risk per cent (PARP) are the following:
CKD-EPI equation:
In female:

In male:

Modified MDRD equation:
In female:

In male:

 , Ie :incidence of CKD in the population with prediabetes, I0 :incidence of CKD in the population with NGT.
 , It :incidence of CKD in the whole population, I0:incidence of CKD in population with NGT.
Statistical analysis
All statistical analyses were performed with the SPSS software V.23.0 for Windows (SPSS, Chicago, IL, USA) and graphs were created using R V.3.5.1 (http://www.r-project.org/). For continuous variables, data were expressed as the means±SD for normally distributed data and median (IQR 25%±75%) for skew distributed data, and categorical variables were expressed as numbers and percentages. We used t-test (for normally distributed continuous data), Kruskal–Wallis test (for skew distributed continuous data) or χ2 test (for categorical variables) to compare the baseline characteristics between participants with NGT and prediabetes. The Cox proportional hazard assumption was tested and met by plotting log minus log survival curves (online supplementary figure S1). HRs and 95% CIs from Cox regression models were used to assess the association of prediabetes and its phenotypes/isolated phenotypes with the occurrence of CKD, in which some potential confounding factors were adjusted. We constructed the receiver operating characteristic curves (ROCs) of FPG, 2hPG and HbA1c, respectively, determined the best cut-off point using Youden’s method, then estimated sensitivity and specificity according to this cut-off point. In addition, we calculated the net reclassification improvement indices (NRI) for 2hPG and HbA1c relative to FPG to predict CKD. All tests were two-sided and p value less than 0.05 was considered as significant.
Supplemental material
Results
Characteristics of participants at baseline
At baseline, the mean age of the 8706 included participants was 57.7±7.7 years (40–84 years) and 5660 were women (65.0%). In all, 1836 participants had NGT, 2260 had diabetes and 4610 had prediabetes; thus, a total 6446 participants were without diabetes (1836 with NGT plus 4610 with prediabetes). In the 4610 prediabetic participants, 1954 had IFG, 1696 had IGT and 3848 had EHbA1c. Compared with participants with NGT, prediabetic participants were older and had higher levels in their BMI, SBP, TC, TG and LDL-C; and lower levels of HDL-C (table 1).
Baseline characteristics of non-diabetic study participants
Risk for the prediabetic participants to develop CKD during follow-up
During the 3-year follow-up, 88 (1.37%) of the 6446 non-diabetic (NGT plus prediabetes) participants developed CKD, of which the incidence in prediabetic participants was 1.69% (78/4610), which was twofold higher than the NGT participants (0.54% or 10/1836). The distribution of the incidence of CKD in the phenotypes categorized by glycemic indices were 1.94% with IFG, 2.12% with IGT and 1.69% with EHbA1c, which were not different but were all higher than those values in the NGT participants (table 2).
Risk of occurrence of CKD for prediabetes at baseline defined by ADA criteria
Table 2 shows the association of prediabetes and its phenotypes with the risk of CKD occurrence. In the fully adjusted model (Model3), we found that prediabetes was significantly associated with increased the risk of occurrence of CKD (HR=2.45 (1.26–4.81)), IFG (HR=2.51 (1.21–5.20)), IGT (HR=2.39 (1.14–5.03)) and elevated HbA1c (HR=2.60 (1.31–5.16)), respectively, compared with that of the participants with NGT. HR with 95% CI of factors associated with the occurrence of CKD is shown in online supplementary table S3. We also evaluated the outcome of incident hyperfiltration in this population by the prediabetes phenotypes. The results show that IFG (HR=1.42 (1.01–1.98)) and IGT (1.55 (1.09–2.19)) significantly increased the risk of hyperfiltration, whereas an elevated HbA1c (1.32 (0.98–1.78)) trended (but not statistically significant) towards manifesting hyperfiltration (online supplementary table S4).
Supplemental material
Supplemental material
Cut-off point of glycemic indices that increase the risk of occurrence of CKD
To define the levels (cut-off points) at which FPG, 2hPG and HbA1c might significantly increase the occurrence of CKD, ROC analysis was performed. The results showed that FPG>5.63 mmol/L, 2hPG>6.80 mmol/L or HbA1c>5.6% increased the risk of CKD occurrence (table 3). The predictive value of 2hPG for CKD occurrence (area under the curve (AUC)=0.60) was slightly higher than FPG (AUC=0.57) and HbA1c (AUC=0.58). The sensitivity of the cut-off points obtained from the ROC analysis for finding those participants with CKD were 43.2% for FPG, 67.1% for 2hPG and 73.9% for HbA1c, which were mostly similar to those of cut-off points based on the ADA criteria for prediabetes (FPG of 5.6 mmol/L: 43.2%, 2hPG of 7.8 mmol/L: 40.9% and HbA1c of 5.7%: 73.9%), but were higher than those of cut-off points based on the WHO prediabetes criteria (FPG: 17.0%; 2hPG: 40.9%). In addition, the NRI estimate showed that addition of 2hPG and HbA1c to FPG improved the NRI, but not significantly (table 4).
ROC curves of FPG, 2hPG and HbA1c for the prediction of occurrence of CKD
NRI for 2hPG and HbA1c relative to FPG to predict occurrence of CKD
Contribution of prediabetes to the occurrence of CKD
To assess the contribution of prediabetes and its phenotypes to the occurrence of CKD, we calculated the ARP and the PARP in the study participants (table 5). Using the ADA criteria for prediabetes, PARP was 60.6%, which indicate that in this non-diabetic Chinese population, three-fifths of participants developing CKD were attributed to prediabetes. A slightly higher value of 68% calculated for ARP indicates that prediabetes attributed to 68% of the occurrence of CKD in the prediabetic participants. Here, participants with individual phenotypes attributed to IFG, IGT and EHbA1c, the respective ARP calculation was 74.5% for IGT, which is a slightly higher contribution to the occurrence of CKD than the ARP of 72.2% for IFG and ARP of 68% for EHbA1c. However, when using WHO criteria for prediabetes, the corresponding calculations for PARP (29.2% for study population) and ARP (47.3% for prediabetes, 61% for IFG and 54.2% for IGT) were all significantly lower.
Contribution of prediabetes to the occurrence of CKD
Sensitivity analysis
We did several sensitivity analyses. First, since more than 30% (2204/6446) of participants were with two or more prediabetes phenotypes, to eliminate the confounding effect of these overlapped phenotypes on the results, we stratified the participants into isolated glycemic phenotypes including isolated IFG, isolated IGT and isolated EHbA1c, and compared their separate association with the occurrence of CKD. We demonstrated that isolated IGT (HR=2.98 (1.02–8.71)) and isolated EHbA1c (HR=3.07 (1.67–6.66)) were similarly and significantly associated with CKD, whereas isolated IFG (HR=1.97 (0.54–7.14)) had a lower but nonetheless still a trend of being associated with CKD (figure 2A). Second, we examined the HRs of prediabetes and its phenotypes defined by the different criteria of glycemic indices for the occurrence of CKD. When using the WHO/International Expert Committee (IEC) criteria in the Cox regression models, we found that the HRs changed only slightly, but the overall trend was consistent with the above results (figure 2B). Finally, we changed the calculation of eGFR from using the CKD-EPI equation to the modified MDRD equation. Here, we observed that although the number of CKD participants decreased, the risk of prediabetes for CKD occurrence remains unchanged (figure 2C).

Sensitivity analysis of the risk of CKD occurrence in prediabetes at baseline. (A) Stratified the participants into isolated glycemic phenotype of isolated IFG, isolated IGT, isolated EHbA1c, respectively; (B) using the WHO/IEC criteria to define prediabetes and its phenotypes; (C) using modified MDRD equation to calculate eGFR and define CKD. CKD, chronic kidney disease; eGFR, estimated glomerular filtration rate; EHbA1c, elevated glycated hemoglobin A1c; IEC, International Expert Committee; IFG, impaired fasting glucose; IGT: impaired glucose tolerance; MDRD, Modification of Diet in Renal study; NGT, normal glucose tolerance.
Discussion
From this prospective cohort study tailored to the at-risk Chinese adult population, we are able to make the following conclusions. First, we found that participants that are still at the stage of prediabetes are already at significantly risk of developing CKD. These Chinese participants exhibiting different phenotypes of prediabetes defined by the glycemic indices, IFG, 2hPG or elevated HbA1c, all had higher risk of occurrence of CKD compared with participants having NGT. Second, the levels of these glycemic indices that significantly increase the risk of CKD occurrence (cut-off points) were much lower than those in current use in China, and are closer to the ADA criteria for prediabetes.
In our study, the prevalence of diabetes and prediabetes was 26% and 53%, respectively, which was close to that of 22% (10 055/453 63) and 44% (20 164/453 63) in 2013 in China for people aged 60 years and over,2 and was also similar to the prevalence of prediabetes of 50% in 2010 in China.30 Whereas it was higher than the prevalence of diabetes and prediabetes of 11% and 36% in the Chinese adult population in 2013, this may due to the participants in our study (58 years) being much older than the previous study (44 years).2
Previous studies that have investigated the association between glycemic status and CKD have contradictory conclusions. A meta-analysis of nine published studies suggested that prediabetes was only modestly associated with increase the risk of CKD (relative risk (RR)=1.11 (1.02–1.21)).31 In that meta-analysis, some earlier studies have found that metabolic syndrome, which was characterized by abdominal obesity, dyslipidemia, hypertension and hyperglycemia, is an independent risk factor of CKD.32 33 In addition, another two prospective cohort studies which also investigated the association of metabolic syndrome and CKD, supported a conclusion of positive association between IFG and CKD with a RR of 1.40 (1.10–1.78) and 1.84 (1.42–2.38).34 35 A most recent prospective cohort study from Korea also found that prediabetes was a risk factor for CKD.20 To the contrary, another cross-sectional36 and a cohort study37 suggested otherwise, which is that prediabetes is not a risk factor for CKD. What could be the reason for these discrepancies? In those studies, prediabetes was defined only by IFG or abnormally elevated HbA1c but did not simultaneously determine for a possible presence of IGT. The latter could have led to some participants with prediabetes that could have been shown to have impairment in postprandial glucose tolerance but were misdiagnosed as “NGT.” Inadvertent inclusion of such participants with IGT into the NGT group could conceivably underestimate the contribution of prediabetes to prevalence or incidence of CKD. In our study, we had defined prediabetes by all three glycemic phenotypes of FPG, 2hPG and HbA1c, which made our results more reliable. In addition, we found that levels of FPG, 2hPG and HbA1c were all positively associated with CKD with HR of 1.61 (1.09–2.39), 1.23 (1.08–1.39) and 2.06 (1.12–3.81), respectively, together indicating that increased plasma glucose level is a risk factor for developing CKD.
Our study showed that with FPG>5.63 mmol/L, 2hPG>6.80 mmol/L or HbA1c > 5.6%, the incidence of CKD increased significantly. In the 3-year follow-up, 88 participants developed CKD, in which 23 participants were with baseline FPG of 5.6–6.0 mmol/L (table 5). Since ARP analysis (table 5) for occurrence of CKD in the FPG group with levels between 5.6 and 6.0 mmol/L was 68.2%, therefore the number of CKD participants caused by abnormally elevated FPG would be 16 (23*68.2%) participants, which would account for 18.2% (16/88) of the total number of CKD participants detected during the 3-year follow-up. The clinical implication is that those participants with FPG of 5.6–6.0 mmol/L found at baseline were to have been diagnosed as prediabetes and informed of the risk of occurrence of CKD, which may be of benefit in reducing the incidence of CKD. But because these values in current clinical practice in China are not considered to be prediabetes, an astounding one-fifth more participants that would otherwise be subjected to clinical surveillance would simply go on to develop CKD. This study should serve as a strong motivation to employ stricter criteria in defining what is normal versus prediabetes FPG to further reduce the incidence of CKD.
An elevated HbA1c is indicative of a chronic state of hyperglycemia, whereas an elevated FPG or 2hPG is indicative of transient hyperglycemia. In our study, all three phenotypes of prediabetes defined by these glycemic indices were determined and shown to significantly increase the risk of CKD; but of the three, HbA1c showed the higher sensitivity (table 3). And according to the ADA Criteria, an addition of HbA1c to FPG can improve the prediction occurrence of CKD by 1.32% (NRI=1.32%). The Atherosclerosis Risk in Communities (from America) and the Emerging Risk Factors Collaboration (from UK) studies also indicated that demographically adjusted HbA1c performed better than FPG or 2hPG in predicting CKD, cardiovascular disease, peripheral arterial disease and all-cause mortality (all p<0.05).38 39 However, in China, HbA1c is currently not included as a diagnostic criterion for diabetes and prediabetes. The results from this study suggest that strong consideration be given towards including HbA1c as a diagnostic criterion for prediabetes to enable capturing a larger at-risk population for CKD and perhaps other diabetic complications as well.
Our study has several strengths. First, data from a prospective cohort study can be used to infer causality between prediabetes and CKD. Second, we used all three glycemic indices, FPG, 2hPG and HbA1c, simultaneously to access whether participants had prediabetes, thus avoiding bias caused by missed diagnosis. Finally, we increased the rigor of our study by performing a series of sensitivity analyses and found consistent findings for the isolated IFG, IGT and abnormal elevated HbA1c (figure 2), which served to avoid confounding bias and making our conclusions more reliable. There are however several limitations in this study. First, participants were at age 40 years or over and from a single center only (the urban Pingguoyuan communities of Beijing), wherein the results may not be generalizable to the general population. Second, a single measurement of plasma glucose and Scr, rather than two or more measurements over time, were used to define prediabetes and CKD, which may lead to misdiagnosis. Third, our study lacked information of urinary albumin, which is a key and definitive finding indicative of the pathology of CKD; therefore, participants with proteinuria could still have normal eGFR and might have been misclassified. Finally, the non-responders and missing information by phenotypes would introduce the limitation of non-response selection bias, which may either exaggerate or attenuate the observed relationship between CKD and prediabetic phenotypes.
In conclusion, our study indicated that prediabetes and all its phenotypes of IFG, IGT and abnormal elevated HbA1c increase the risk of the occurrence of CKD in Chinese middle-aged and elderly population. The stricter criteria we have used which approximated those criteria of the ADA would indicate that three-fifths of CKD were attributed to prediabetes among all non-diabetic participants. In addition, we found that the cut-off points of the three glycemic indices were closer to the lower ADA criteria for prediabetes than the WHO criteria. The results of this study indicated the current practice in China should be modified to using stricter criteria to define prediabetes and consequently encourage the general Chinese population to maintain their plasma glucose levels below these ranges of glycemic indices in order to reduce the risk of CKD occurrence.
References
Footnotes
WL and AW are joint first authors.
WL and AW contributed equally.
Contributors WL and AW carried out the statistical analyses and drafted the manuscript. They contributed equally to this study and share first authorship. JJ, GL and MW participated in the data analysis. DL and JW participated in the literature search. YM and XD participated in the data collection, study management and study coordination. HG contributed to correct English language. JD and YH contributed to the study design and review of this manuscript. All authors read and approved the final manuscript.
Funding This study was supported by National Natural Science Foundation of China (grant number: 31672375) to YH and National Science and Technology Major Project (grant number: 2018ZX 09201013) to JD.
Disclaimer Funding organizations had no role in any aspect of the research or manuscript preparation.
Competing interests None declared.
Patient consent for publication Not required.
Ethics approval This study was approved by the Medical Ethics Committee of Ruijin Hospital, Shanghai Jiaotong University.
Provenance and peer review Not commissioned; externally peer reviewed.
Data availability statement Data may be obtained from a third party and are not publicly available. Information on how to access the data can be found on these contact details: Phone: 86-010-5549-9402 Email: jingtaodou@163.com.