Article Text

Abstract
Introduction Aldosterone is a mediator of progressive renal disease, but the mechanisms for aldosterone-mediated renal impairment in mice with diabetes are not fully defined.
Methods Aldosterone and/or mineralocorticoid receptor antagonist eplerenone were used to treat the db/db mice with diabetes. Proximal tubule epithelial cells (PTECs) and fibroblasts were cultured. Blood and kidney samples from patients with diabetes with or without diabetic kidney disease (DKD) were used to verify the findings from animals and cultured cells.
Results We found that aldosterone promoted proteinuria and tubulointerstitial extracellular matrix (ECM) accumulation in db/db mice with diabetes while eplerenone mitigated the adverse effect of aldosterone. However, coculture of PTECs and fibroblasts found that when PTECs-derived extracellular vesicles (EVs) were taken up by fibroblasts, ECM production increased remarkably. Moreover, C57BL/6 mice injected with EVs from renal cortex of aldosterone-treated db/db mice showed increased ECM accumulation. Function of the ingredients of PTECs-derived EVs were analyzed, and RNAs were identified to be responsible for the EVs-induced fibroblast dysfunction. Furthermore, microRNA (miRNA) array analysis revealed that miR-196b-5p was the most remarkably increased miRNA in PTECs-derived EVs with aldosterone stimulation. Overexpression of miR-196b-5p in fibroblasts increased ECM production, accompanied by inhibition of the SOCS2 expression and enhanced STAT3 phosphorylation. In addition, plasma levels of miR-196b-5p was higher in patients with DKD as compared with patients without DKD and miR-196b-5p levels positively correlated with the albuminuria concentration. In kidney specimens from patients with diabetes, expression of miR-196b-5p, located mainly in PTECs, increased in patients with DKD as compared with the non-DKD.
Conclusion This study demonstrates the involvement of miR-196b-5p-EVs pathway as a novel mechanism in aldosterone-induced renal fibrosis in diabetes. EVs rich in miR-196b-5p mediate the crosstalk between PTECs and fibroblast during the development of renal fibrosis, which might be associated with STAT3/SOCO2 signaling pathway.
- tubulointerstitial changes
- fibroblast
- fibrosis
This is an open access article distributed in accordance with the Creative Commons Attribution Non Commercial (CC BY-NC 4.0) license, which permits others to distribute, remix, adapt, build upon this work non-commercially, and license their derivative works on different terms, provided the original work is properly cited, appropriate credit is given, any changes made indicated, and the use is non-commercial. See: http://creativecommons.org/licenses/by-nc/4.0/.
Statistics from Altmetric.com
Significance of this study
What is already known about this subject?
Aldosterone has been demonstrated to be a major driver accelerating tubulointerstitial fibrosis, which is characterized by extracellular matrix accumulation.
Mineralocorticoid receptor antagonist is highly beneficial for prevention of diabetic kidney disease (DKD) progression.
What are the new findings?
Extracellular vesicles (EVs) mediate the crosstalk between proximal tubule epithelial cells and fibroblasts during the development of renal fibrosis.
miR-196b-5p-enriched EVs promoted fibroblasts activation and proliferation, which might be associated with STAT3/SOCO2 signaling pathway.
miR-196b-5p expression increased in serum and kidney of patients with DKD.
How might these results change the focus of research or clinical practice?
The involvement of the miR-196b-5p-EV pathway is a novel mechanism in aldosterone-induced renal fibrosis.
miR-196b-5p might be a potential marker for DKD progression.
Introduction
Diabetic kidney disease (DKD) is one of the principal microvascular complications of diabetes mellitus. It remains a leading cause of end-stage renal disease.1 2 The mediators for progressive renal disease include a wide array of vasoactive hormones, growth factors and cytokines, including the renin-angiotensin-aldosterone system (RAAS). A number of studies raised the possibility that aldosterone per se is etiological in mediating progressive renal disease.3 4 ACE inhibitors (ACEI) or Ang II receptor blockers (ARB) are currently used to prevent DKD progression. However, several clinical trials demonstrated that due to ‘aldosterone escape’ which refers to the increase of plasma aldosterone levels after an initial reduction with ACEI/ARB treatment, the effect of ACEI or ARB on reducing urinary albumin was not as expected in some patients.5
Tubulointerstitial fibrosis (TIF), characterized by extracellular matrix (ECM) accumulation, is the hallmark of advanced DKD. The tubulointerstitium consists of multiple cell components including tubular epithelial cell, fibroblast and inflammatory cell.6 During the development of TIF, the crosstalk between these cell types are highly complex and ultimately lead to the proliferation of fibroblasts and their activation in myofibroblasts.7 8 Although interstitial fibroblast activation is responsible for the excessive production of ECM, tubular epithelial cell, in particular proximal tubule epithelial cells (PTECs), are primarily targeted by various injury and have been increasingly recognized as the driving force in TIF.9–11
Extracellular vesicles (EVs) are emerging as novel mediators of cellular crosstalk. EVs contain proteins and nucleic acids including microRNAs (miRNAs), which are important in the regulation of gene expression. EVs can deliver epigenetic regulators to proximal or distal recipient cells and can influence the behavior of targeted cells.12 Studies have shown that PTEC-derived EVs contribute to macrophage infiltration though CCL2.13 Podocyte-derived microparticles promote proximal tubular fibrotic signaling via p38 MAPK and CD36.14 These studies indicate that EV-mediated crosstalk between different renal cellular compartments plays an important role in kidney fibrosis.
In this study, we aimed to investigate the role of aldosterone in DKD and elucidate the potential mechanism. We found that aldosterone promoted proteinuria and tubulointerstitial ECM accumulation in db/db mice with diabetes while mineralocorticoid receptor antagonist (MRA) eplerenone mitigated the adverse effect of aldosterone. Our study demonstrates the involvement of the miRNA-EV pathway as a novel mechanism in aldosterone-induced renal fibrosis. EVs rich in miR-196b-5p mediate the crosstalk between PTECs and fibroblasts during the development of renal fibrosis, which might be associated with the STAT3/SOCS2 signaling pathway.
Materials and methods
Animals
Male db/db mice (BKS.Cg-Dock7m +/+Leprdb/Nju) and male C57BL/6 mice were purchased from the Model Animal Research Center of Nanjing University and housed in accordance with protocols approved by the Animal Care Committee of Chongqing Medical University. All mice had free access to food and water throughout the study.
Experimental design
Groups of db/db mice were assigned and treated at 10 weeks of age as follows: (a) db/db mice (n=10) as a control group treated with vehicle (ethanol saline); (b) db/db mice (n=10) treated with aldosterone (0.4 mg/kg/day) for 6 weeks; (c) db/db mice (n=10) treated with aldosterone plus eplerenone (100 mg/kg/day) in drinking water for 6 weeks and (d) db/db mice (n=10) treated with eplerenone for 6 weeks.
To administer 0.4 mg/kg/day aldosterone (A9477; Sigma) or vehicle, Alzet minipumps (models 2004 or 2006; Alzet, Cupertino, California, USA) were implanted subcutaneously under isoflurane anesthesia according to the manufacturer’s guidelines. Eplerenone (s1707, Selleck) 100 mg/kg/day results in a substantial reduction in albuminuria and the progression of DKD with a lesser risk for hyperkalemia. Water consumption was monitored daily to confirm correct dosing of eplerenone.15
Blood pressure was measured after 5 days of training using the Visitech BP2000 system (Apex, North Carolina, USA) by the tail cuff method. Blood glucose levels were monitored in tail blood samples using a blood glucose meter (Glucometer Elite XL, Bayer Healthcare, Elkhart, Indiana, USA). Twenty-four hours urine samples were obtained from each mouse after placement in metabolic cages every 2 weeks. ELISA kits were used to measure urinary albumin (ab108792, Abcam) and creatinine (500701, Cayman) following the manufacturers’ protocols.
Mice were sacrificed under isoflurane anesthesia. Blood samples were obtained by cardiac puncture for the measurements of plasma K+, creatinine and blood urea nitrogen (BUN). Plasma K+ levels were determined on an Automatic biochemical analyzer Chemray 240 (Shenzhen, China). BUN (Bioassay, DIUR-100) was measured by an ELISA kit following the manufacturer’s protocol. Kidneys were perfused, via the heart, with cold phosphate-buffered saline (PBS) and then excised. The renal cortex was harvested by dissection and saved for further analysis as described previously.
To specifically examine the role of kidney EVs of db/db mice in kidney fibrosis in different treatment groups, male C57BL/6 mice aged 8 weeks were injected with EVs from the renal cortex of db/db mice in the above four groups. EVs were harvested by differential ultracentrifugation as described in Isolation and characterization of EVs section. For in vivo treatment, 30 mg EVs/mouse were adoptively transferred into recipient mice via tail vein injection. Mice were euthanized 16 or 72 hours after injection. Serum samples, 24 hours urine, and kidney tissues were harvested.
Cell culture and treatment
A human proximal tubular epithelial cell line (HK-2) purchased from the Cell Bank of Type Culture Collection (Chinese Academy of Sciences, Shanghai, China) was cultured in keratinocyte serum-free medium (17005-042, Gibco, USA) supplemented with each of the two additives required to grow this cell line (bovine pituitary extract and human recombinant epidermal growth factor). Human normal fibroblasts (CCD-8Lu) were obtained from American Type Culture Collection (ATCC, Manassas, Virginia, USA) and cultured in Eagle’s Minimum Essential Medium (30-2003, ATCC, USA) supplemented with 10% fetal bovine serum (Gibco, Grand Island, New York, USA). Both cell lines were cultured in an atmosphere of 5% CO2 and 95% humidity at 37℃.
All cell treatments were conducted in a medium with a glucose concentration of 25 mmol/L, making the tubular epithelial cells and fibroblasts more susceptible to injury caused by aldosterone. PTECs and fibroblasts were treated with PBS, aldosterone (10 μmol/L), aldosterone combined with eplerenone (10 μmol/L) or eplerenone alone for 72 hours. For in vitro treatment, 2 mg of EVs, determined on the basis of total protein measurement, was added to 1×10⁵ recipient cells.16 For miR-196b-5p overexpression or inhibition, 20 µM miR-196b-5p mimic or 20 µM inhibitor (GenePharma, Shanghai, China) was transfected into fibroblast cells. The miR-196b-5p mimic and miR-196b-5p inhibitor sequences were as follows: miR-196b-5p mimic (5′-UAGGUAGUUUCCUGUUGUUGGG-3′, 3′-CAACAACAGGAAACUACCUAUU-5′) and miR-196b-5p inhibitor (5′-CCCAACAACAGGAAACUACCUA-3′).
Isolation and characterization of EVs
PTEC culture medium (75 mL) was purified using the exoEasy Maxi Kit (Qiagen, Melbourne, Victoria, Australia) according to the manufacturer’s instructions. Following the final step, EVs were ultracentrifuged at 100 000 × g for 30 min at 4°C and resolubilized in 20 µL PBS.11
For kidney EV extraction, 100 mg of kidney cortex was collected and subjected to tissue digestion with collagenase and trypsin (17104-019 and 25200-056, respectively, Gibco) for 120 min at 37°C. Then, the sample was subjected to EV extraction. All samples were centrifuged at 2000 × g for 20 min to eliminate the cells and debris and at 13 500 × g for 20 min, followed by ultracentrifugation at 1 20 000 × g for 120 min (Type CP100MX, Hitachi KoKi). The EV pellet was washed in 20 mL of PBS and collected by ultracentrifugation at 1 20 000 × g for 120 min.13
The size distribution, morphology and quantity of EVs were detected by electron microscopy and nanoparticle tracking analysis (NTA). Protein concentration and markers (CD63, CD9, TSG101 and GRP94) of isolated EVs were detected by western blot analysis.17
Transmission electron microscopy
The EV samples were diluted 10-fold with PBS and then applied to 200-mesh nickel grids. Samples were stained with 2% phosphotungstic acid for 5 min at room temperature and air-dried. EVs were detected using a transmission electron microscope (TEM, Hitachi HT 7700, Japan) at 80 kV.
Nanoparticle tracking analysis
NTA was performed with MAL1140774, Zetasizer V.7.11 (Malvern Instruments). Purified EVs were diluted with PBS to measure the particle size. The corresponding software, Zetasizer V.7.13, was used to analyze the data. To convert the yield from concentration to an accurate number of particles, dilution factors and resuspension volumes were used.
EV uptake experiments
EVs were labeled with PKH-26 (MINI26; Sigma, USA) as previously reported and were then added to fibroblasts for 48 hours. The resulting fluorescence signals were observed using a Leica microscope (Germany).
Coculture of PTECs and fibroblasts
To demonstrate the effect of PTEC-derived EVs on fibroblasts, we established coculture systems with Transwells with 0.4 mm pores (Corning) that mimic the milieu where PTECs are exposed to aldosterone on the apical surface as described before. PTECs were labeled with Dio dye (5 mg/mL, Beyotime) at 37°C for 30 min. After staining, the cells were washed completely three times with PBS to remove free dye. Then, PTECs were grown to complete confluence and cocultured with fibroblasts, which were seeded in the lower compartment of the Transwell system. PTECs were then stimulated on the apical side, and GW4869 (D1692, Sigma) was used as an EV secretion inhibitor. EVs from Dio-labeled PTECs were released on the basolateral side and were internalized by fibroblasts, which was observed using a Leica microscope (Germany).
Distribution of EVs
PKH26-labeled EVs were injected into C57BL/6 male mice aged 8 weeks through the tail vein. After 16 hours, the mice were sacrificed, and kidney specimens were snap-frozen in optimum cutting temperature compound. The slides were subsequently washed twice, stained with 4,6-diamidino-2-phenyiindole 2 hci (DAPI) and observed under a Leica microscope (Germany).
miRNA expression profiling
The EVs isolated from control (n=3) and aldosterone-treated (n=3) PTECs were lysed, and total RNAs were extracted using a miRNeasy Micro Kit (217084, Qiagen, Germany) according to the manufacturer’s protocol. We performed miRNA expression profiling using the Agilent Human miRNA Microarray, release 21.0 (8*60K, design ID: 070156). RNA labeling and array hybridization were performed according to manual and analyzed with the Agilent Scanner G2505C (Agilent Technologies). Significance of differentially expressed miRNAs between the two groups was identified through fold change and p value. A heat map was performed to show distinguishable miRNA expression profiling among samples.
Fluorescence in situ hybridization
Fluorescence in situ hybridization was performed using frozen kidney sections from patients with or without diabetes. The Cy3-labeled locked nucleic acid oligonucleotide was used as a probe (GenePharma) to detect miR-196b-5p, and scramble locked nucleic acid was used as the control.
Human experiment
Blood and urine samples were collected from patients with type 2 diabetes mellitus (T2DM) in the Department of Endocrinology and Metabolism, the First Affiliated Hospital of Chongqing Medical University. Urinary albumin by nephelometry on a Modular System P (Roche Diagnostics) and urinary creatinine by colorimetry on a Hitachi 911 automatic analyzer (Roche Diagnostics, Meylan, France). Patients with T2DM and DKD defined as increased urinary albumin with or without altered renal function (defined as estimated glomerular filtration rate (GFR) <60 mL/min/1.73 m2, according to the Chronic Kidney Disease Epidemiology Collaboration equation).18 The correlation between miR-196b-5p and urinary albumin was analyzed by Spearman’s test. All patients provided signed informed consent for blood donation.
Human kidney tissue samples
Kidney biopsy samples were derived from patients with or without diabetes who had undergone surgery to remove localized renal tumors at the First Affiliated Hospital of Chongqing Medical University, Chongqing, China. Control kidney biopsy specimens were acquired from the unaffected pole of the kidneys, at least 3 cm away from the localized renal tumors. Diagnosis of renal fibrosis was based on pathological examination.19
Statistical analysis
Data are expressed as the mean±SD or as the mean±SEM of each group. A two-tailed unpaired Student’s t-test was used for comparisons between two groups, and one-way analysis of variance was performed for comparisons of data from more than two groups followed by Bonferroni correction for multiple comparisons. All analyses were carried out using SPSS V.21.0. P value <0.05 was considered to be statistically significant.
Results
Aldosterone aggravated tubulointerstitial fibrosis in mice with diabetes via mineralocorticoid receptor
In order to clarify the effect of aldosterone on DKD, we used a diabetic db/db mouse model treated with aldosterone and/or the MRA eplerenone for 6 weeks. Compared with the control group, aldosterone-treated mice had significantly increased serum BUN and albumin-to-creatinine ratio, while eplerenone ameliorated the reduced kidney function (figure 1A). Blood glucose levels, body weight, serum K+ and blood pressure had no significant changes (online supplementary figure 1A-D). H&E and periodic acid-Schiff staining showed that aldosterone-induced mouse tubulointerstitial lesions (figure 1B). Masson’s trichrome staining and Sirius red showed that aldosterone aggravated TIF in mice (figure 1B). Moreover, the protein expression levels of fibrosis biomarkers fibronectin (FN), collagen type I alpha 1 (col1A1) chain and alpha-smooth muscle actin (α-SMA) in the renal cortex were increased in aldosterone-treated mice but not in mice treated with eplerenone (figure 1B–C). These results suggested that aldosterone induced renal function damage in mice by activating mineralocorticoid receptor (MR), and this effect was independent of blood pressure.
Supplemental material
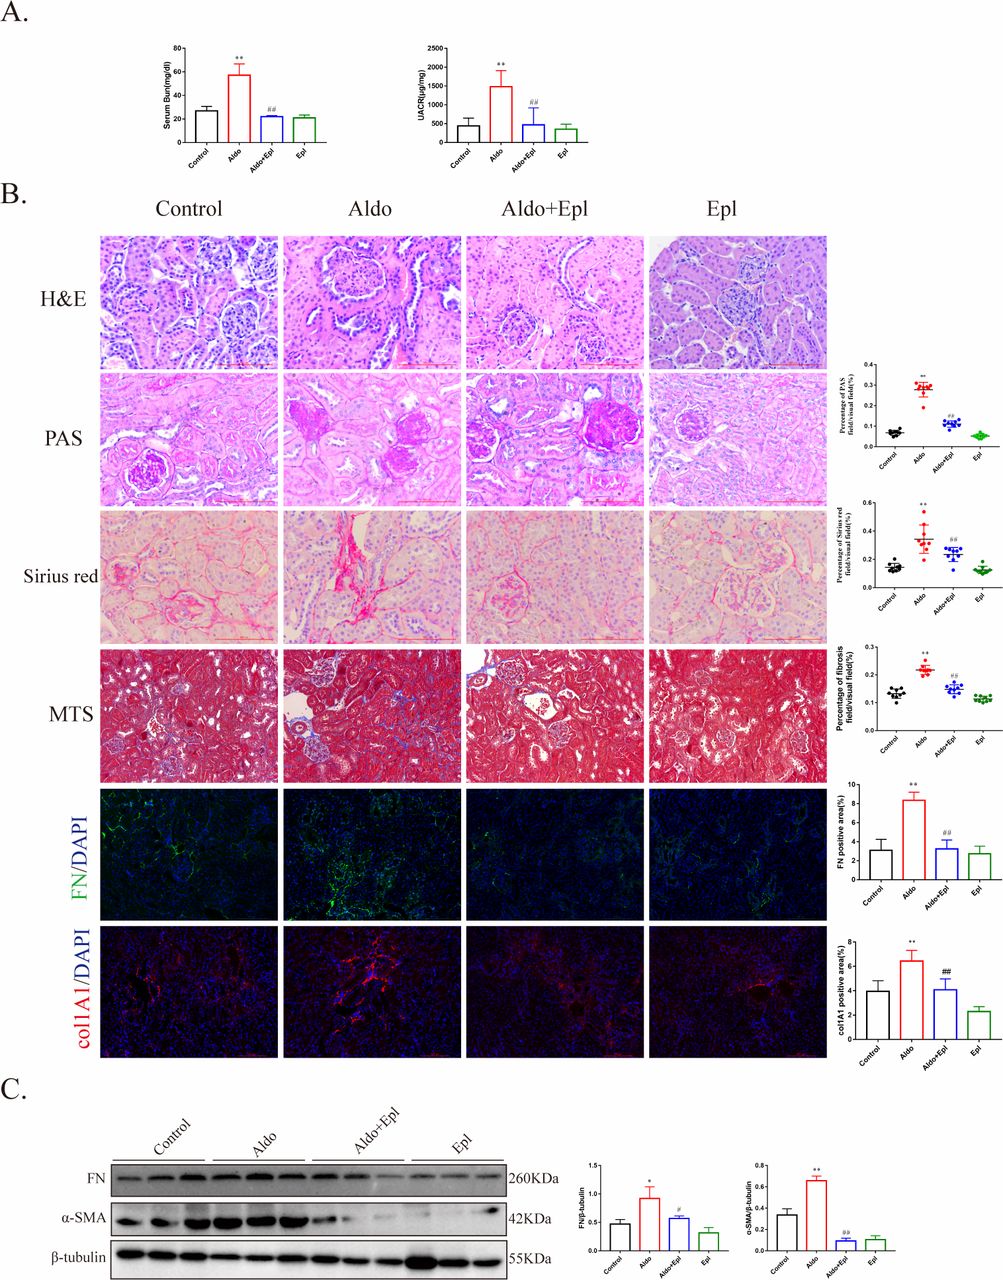
Aldosterone (Aldo) impaired renal function and aggravated renal fibrosis. (A) Blood urea nitrogen (BUN) and urine albumin-to-creatinine ratio (UACR) of db/db mice after exposure to Aldo for 6 weeks (n=10/group). (B) Representative image of H&E and periodic acid-Schiff (PAS) staining for tubulointerstitial lesions detection, Sirius red and Masson’s trichrome staining for interstitial fibrosis detection and immunofluorescence staining for fibronectin (FN, green), collagen type I alpha 1 (col1A1) (red) and Hoechst (blue) and quantification. Scale bar, 100 µm. (C) FN and alpha-smooth muscle actin (α-SMA) protein levels of db/db renal cortex with different treatments detected by western blot analysis and quantified. *P<0.05, **p<0.01 vs control, #p<0.05, ##p<0.01 vs Aldo. Numeric data are presented as the means±SEM. DAPI, 4,6-diamidino-2-phenyiindole 2 hci; Epl, eplerenone; MTS, Masson’s trichrome staining.
Aldosterone had a direct effect on renal tubular epithelial cells but an indirect effect on fibroblasts
Both renal tubular epithelial cells and fibroblasts play important roles in renal fibrosis. As figure 2 shows, aldosterone decreased the expression levels of the epithelium marker E-cadherin and increased the expression of neutrophil gelatinase-associated lipocalin (NGAL), a marker of epithelium injury, in db/db mice (figure 2A and B). In vitro experiments with PTECs revealed similar results (figure 2C). Electron microscopy also showed that the renal tubular epithelium of aldosterone-treated mice had increased lipid droplets, a disordered arrangement of organelles and cell swelling (figure 2D).

Effect of aldosterone (Aldo) on tubular epithelial cells and fibroblasts. (A) Representative image of E-cadherin staining in mice. Scale bar, 100 µm. (B) NGAL protein levels in db/db renal cortex with different treatments detected by western blot analysis and quantified. (C) E-cadherin and Snail protein levels in proximal tubule epithelial cells (PTECs) with different treatments detected by western blot analysis and quantified. (D) Representative photomicrographs of PTEC images by transmission electron microscopy (TEM). Scale bar, 2 µm. (E) Fibronectin (FN), collagen type I alpha 1 (col1A1) and alpha-smooth muscle actin (α-SMA) protein levels in fibroblasts with different treatments for 72 hours detected by western blot analysis and quantified. (F) MR protein levels of PTECs and fibroblasts detected by western blot analysis. *P<0.05, **p<0.01 vs control, #p<0.05, ##p<0.01 vs Aldo. Numeric data are presented as the means±SEM. Epl, eplerenone; MR, mineralocorticoid receptor; NGAL, neutrophil gelatinase-associated lipocalin.
Fibroblasts are the main source of FN and col1A1 in renal fibrosis,20 but unexpectedly, aldosterone did not directly increase the protein expression level of FN, col1A1 and α-SMA in fibroblasts (figure 2E). Previous studies have shown that the expression of the mineralocorticoid receptor was high in tubular epithelium cells but low in fibroblasts.21 In our experiment, the protein expression levels of MR in fibroblasts were very low (figure 2F), suggesting that increased FN, col1A1 and α-SMA might be an indirect action of aldosterone on fibroblasts.
EVs from PTECs activated fibroblasts
EVs play a vital role in the transfer of genetic information between cells. As mentioned above, MR expression was almost undetectable in fibroblasts, and we hypothesized that aldosterone may injure fibroblasts through EVs from PTECs. First, we isolated, characterized and quantified EVs from PTECs by TEM, western blot analysis (using CD9, CD63, and TSG101 as EV markers and GRP94 as negative marker) and NTA (figure 3A). EVs labeled with Dio (figure 3B) or PKH26 (figure 3C) showed that EVs could be transferred from PTECs to fibroblasts.

Extracellular vesicles (EVs) from proximal tubule epithelial cells (PTECs) activated fibroblasts. (A) Electron microscopic image of whole-mounted EVs purified from PTECs (left, bar, 2 µm; right, bar, 100 nm). EV protein fractions were processed for western blot analysis with the indicated antibodies against EV markers CD9, CD63 and TSG101 and the negative marker GRP94. The size of the EVs was analyzed by a Zetasizer Nano particle analyzer. (B) An in vitro coculture system was used in which different treated PTECs were seeded in the top compartment, separated by a porous membrane from fibroblasts that were cultured in the bottom compartment. Representative images of EVs released from Dio-labeled PTECs and internalized by fibroblasts. GW4869 was used as an EV secretion inhibitor (three independent experiments; n=3). Scale bar, 100 µm. (C) EV uptake experiment. PTEC-derived EVs were labeled with red fluorescent dye and incubated with fibroblasts. Fibroblasts were incubated with PKH26-labeled EVs for 24 hours (four independent experiments; n=4). Scale bar, 100 µm. (D) MTT (3-[4,5-dimethyl-2-thiazolyl]-2,5-diphenyl-2H-tetrazolium bromide) assay showing proliferation of fibroblasts after treatment with EVs that were isolated from different treated PTECs. (E) Migration analysis of fibroblasts 48 hours after treatment with EVs that were isolated from different treated PTECs and quantification of migrated cells. (F) Fibronectin (FN), collagen type I alpha 1 (col1A1) and alpha-smooth muscle actin (α-SMA) protein levels in fibroblasts with different treatments detected by western blot analysis for interstitial fibrosis and quantified. (G) Representative images of immunofluorescence staining for col1A1 (green), FN (green), α-SMA (green) and Hoechst (blue) in fibroblasts treated with EVs extracted from PTECs under different treatments and quantification. Scale bar, 100 µm. *P<0.05, **p<0.01 vs EVs, #p<0.05, ##p<0.01 vs Aldo-EVs. Numeric data are presented as the means±SEM. Aldo, aldosterone; DAPI, 4,6-diamidino-2-phenyiindole 2 hci; Epl, eplerenone.
Next, the effect of EVs secreted by aldosterone-treated PTECs on fibroblasts was analyzed. EVs from aldosterone-treated PTECs induced fibroblast proliferation (figure 3D) and promoted fibroblast migration (figure 3E). In addition, the fibrosis markers col1A1, FN and α-SMA were significantly increased in the aldosterone-EV group (figure 3F and G).
miR-196b-5p-enriched EVs promoted fibroblast activation and proliferation
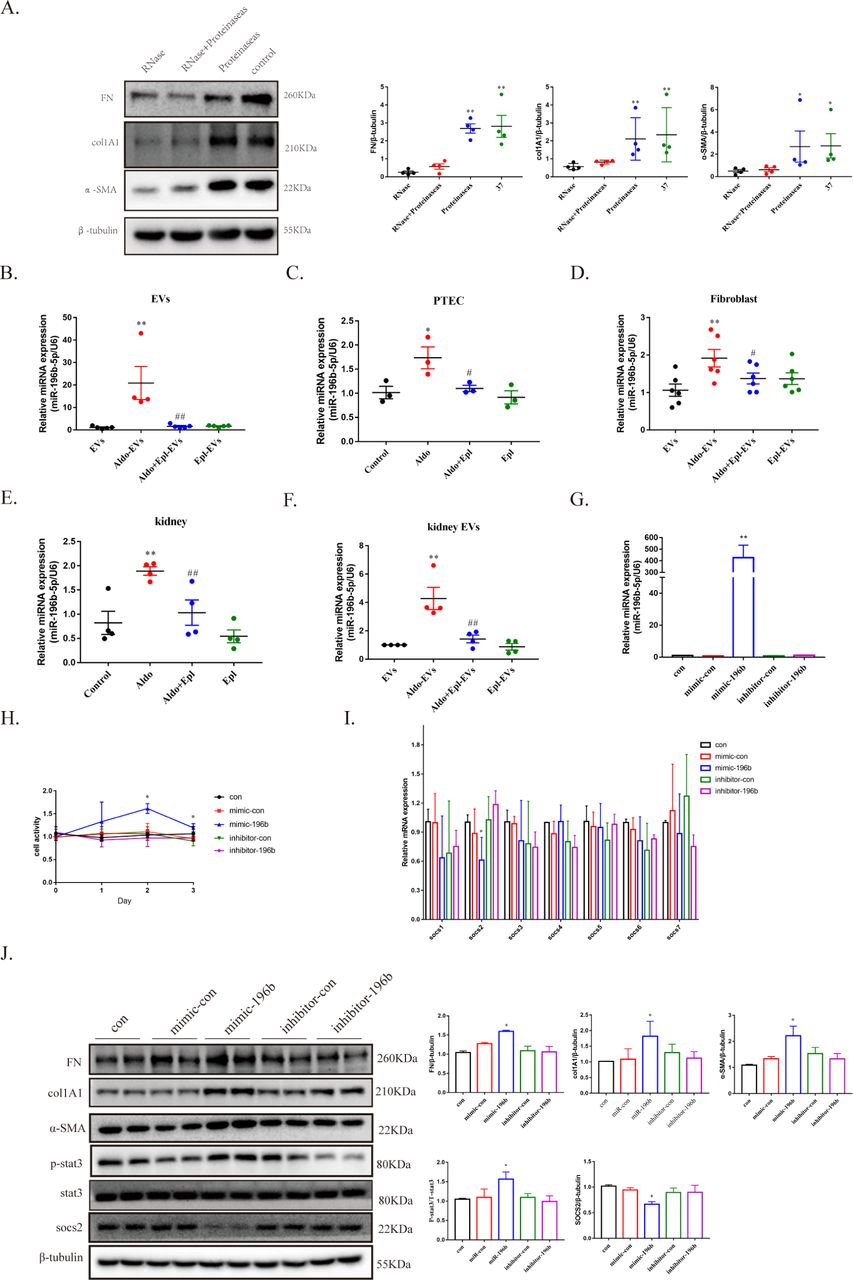
As quantitative analysis showed no significant difference in the secretion volume of EVs among the groups (online supplementary figure 2A), we focused on the ingredients of EVs. We used ribonuclease (RNase) and/or proteinase to identify whether proteins or RNAs are responsible for EV-induced fibroblast dysfunction (online supplementary figure 2B). First, the ingredients of EVs were verified after RNase and/or proteinase treatment (online supplementary figure 2C,D). Ultimately, compared with that in the control group (both proteins and RNAs of EVs were retained), when the RNA of EVs were degraded (RNase-treated samples), the expression of FN, col1A1 and α-SMA in fibroblasts did not change remarkably after EV treatment. However, when the proteins of EVs was degraded (proteinase-treated samples), the expression of fibrosis markers in fibroblasts obviously changed after EV treatment, suggesting that aldosterone-EV-induced interstitial fibroblast fibrosis was attributed to the RNA cargo of EVs (figure 4A).

miRNA-196b-5p promoted fibroblast activation and proliferation. (A) Fibronectin (FN), collagen type I alpha 1 (col1A1) and alpha-smooth muscle actin (α-SMA) protein levels in fibroblasts with different treatments detected by western blot analysis for interstitial fibrosis and quantified. The control fraction contains both RNA and proteins; the ribonuclease (RNase)+proteinase fraction contains trace RNAs and trace proteins; the proteinase fraction contains RNAs and trace proteins and the RNase fraction contains proteins and trace RNAs. *P<0.05, **p<0.01 vs RNase or RNase+proteinase. Numeric data are presented as the means±SEM. (B) miR-196b-5p abundance in extracellular vesicles (EVs) secreted by proximal tubule epithelial cells (PTECs). (C) Expression level of miR-196b-5p in PTECs. (D) Expression levels of miR-196b-5p in fibroblasts. (E) Expression level of miR-196b-5p in the renal cortex of db/db mice. (F) miR-196b-5p abundance in EVs derived from the renal cortex of db/db mice. Data were normalized to levels of U6. *P<0.05, **p<0.01 vs EVs or control, #p<0.05, ##p<0.01 vs Aldo-EVs or Aldo. (G) The expression of miR-196b-5p in fibroblasts after transfection of miR-196b-5p mimic and inhibitor. (H) MTT (3-[4,5-dimethyl-2-thiazolyl]-2,5-diphenyl-2H-tetrazolium bromide) assay of fibroblasts after overexpression or knockdown of miR-196b-5p. (I) The expression of the SOCS family, a miR-196b-5p target gene, after overexpression or knockdown of miR-196b-5p. (J) FN, col1A1, alpha-smooth muscle actin (α-SMA), SOCS2 and p-stat3 protein levels in fibroblasts. *P<0.05, **p<0.01 vs miR-con. Numeric data are presented as the means±SEM. Aldo, aldosterone; Epl, eplerenone; miRNA, microRNA.
Next, miRNA array analysis was conducted in EVs from PTECs treated with or without aldosterone (online supplementary figure 2E,F). Among the identified miRNAs, the most obvious change was of miR-196b-5p. Our results showed that with aldosterone treatment, the expression of miR-196b-5p increased both in PTECs (figure 4C) and EVs from PTECs (figure 4B). Moreover, miR-196b-5p increased in fibroblasts after aldosterone-EV treatment (figure 4D). In vivo, with aldosterone treatment, miR-196b-5p expression markedly increased in renal cortex as well as in EVs from renal cortex, while miR-196b-5p expression was decreased after the administration of eplerenone (figure 4E and F). We further explored the effects of miR-196b-5p on fibrosis signaling. First, the miR-196b-5p mimic and inhibitor were constructed to overexpress and knockdown miRNA expression in fibroblasts, respectively (figure 4G). The results showed that the proliferation of fibroblasts was significantly increased after mimic-196b was transfected (figure 4H). Previous research has reported that miR-196b-5p regulates the JAK/STAT pathway by targeting SOCS2.22 Furthermore, we found that the expression of SOCS2 was significantly reduced after transfection of the miR-196b-5p mimic (figure 4I and J), while p-stat3 levels increased in the mimic-196b group (figure 4J). Next, we detected the expression of fibrosis markers, and the results showed that FN, col1A1 and α-SMA were increased after transfection of miR-195b-5p mimic (figure 4J). In addition, an experiment to analyze the effect of EVs on STAT pathway in fibroblast was performed. The results showed that the expression of p-stat3 was increased in EVs from aldosterone-treated PTECs in fibroblast (online supplementary figure 2H).
EVs from the renal cortex of db/db mice treated with aldosterone promoted renal fibrosis
Given the impact of aldosterone-EVs on fibroblast activation and proliferation, we next evaluated whether EVs secreted from aldosterone-treated mice would damage the kidneys of recipient animals. First, EVs from the renal cortex of db/db mice were identified by TEM, western blot analysis (using CD9, CD63 and TSG101 as EV markers) and NTA (figure 5A). Then, EVs labeled with PKH26 were injected into C57BL/6 mice through tail vein injection. After 16 hours, fluorescence was detected in the mouse kidneys (figure 5B), suggesting that EVs entered the kidney tissues through the circulation. We also detected the changes of miR-196b-5p in renal tissues of the recipient mice at 72 hours, and the results showed that the expression of miR-196b-5p was significantly increased in the aldosterone-EV group (figure 5C). The results of Sirius red staining and Masson’s trichrome staining suggested that EVs from the renal cortex of mice treated with aldosterone promoted renal fibrosis in the recipient mice after 72 hours of EV injection (figure 5C). Moreover, protein expression levels of FN, col1A1 and α-SMA in the renal cortex were markedly increased in aldosterone-EV-treated mice, while the expression levels were decreased in the aldosterone+eplerenone and eplerenone-EV groups (figure 5C and D).
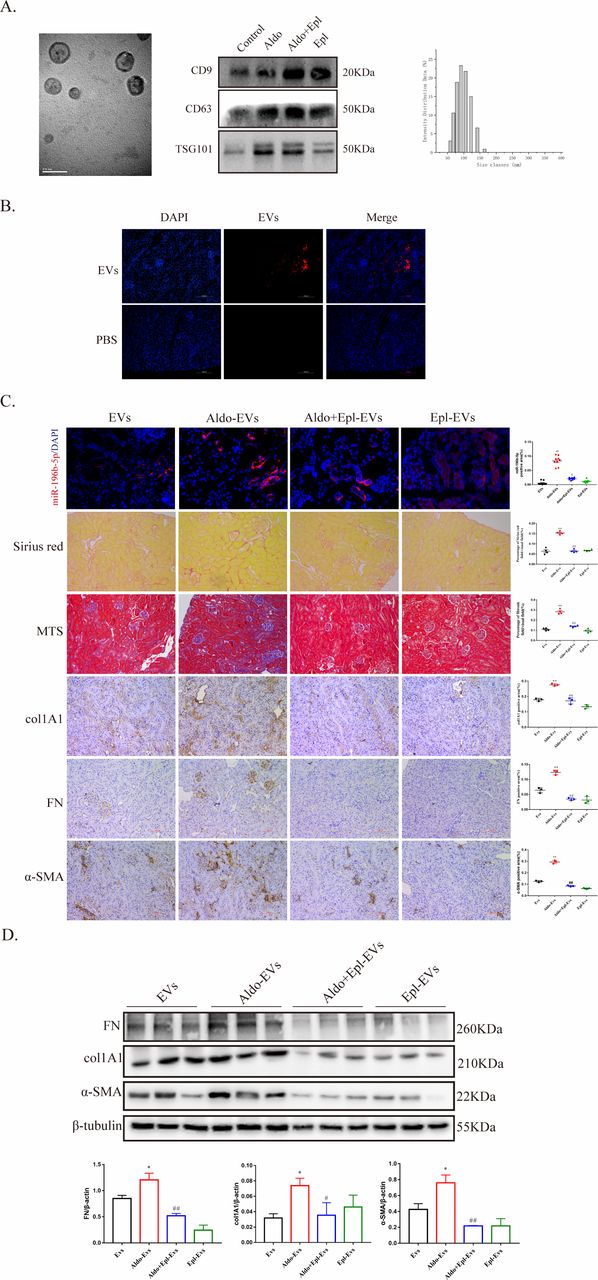
Extracellular vesicles (EVs) from the renal cortex of Aldo-treated mice caused kidney injury in recipient mice. (A) Electron microscopic image of whole-mounted EVs purified from the renal cortex of db/db mice. Scale bar: 100 nm. EV protein fractions were processed for western blot analysis with the indicated EV marker antibodies against CD9, CD63 and TSG101. The size of the EVs was analyzed using a Zetasizer Nano particle analyzer. (B) C57BL/6 mice were injected via the tail vein with PKH26-labeled EVs of approximately 30 mg/mouse generated in vitro by the renal cortex of db/db mice or phosphate buffered saline. Representative kidney sections after 16 hours of PKH26-labeled EV injection (three independent experiments; n=3). Scale bar, 100 µm. (C) Representative image of miR-196b-5p staining in C57BL/6 mice, representative image of Sirius Red staining and Masson’s trichrome staining for interstitial fibrosis detection and representative image of fibronectin (FN), collagen type I alpha 1 (col1A1) and alpha-smooth muscle actin (α-SMA) staining for renal injury in C57BL/6 mice after 72 hours of EV injection and quantification. Scale bar, 100 µm. (D) FN, col1A1 and α-SMA protein levels in the renal cortex of C57BL/6 mice with different treatments detected by western blot analysis for interstitial fibrosis and quantified. *P<0.05, **p<0.01 vs EVs, #p<0.05, ##p<0.01 vs Aldo-EVs. Numeric data are presented as the means±SEM. Aldo, aldosterone; DAPI, 4,6-diamidino-2-phenyiindole 2 hci; Epl, eplerenone; MTS, Masson’s trichrome staining; PBS, phosphate-buffered saline.
miR-196b-5p expression increased in serum and kidney of patients with DKD
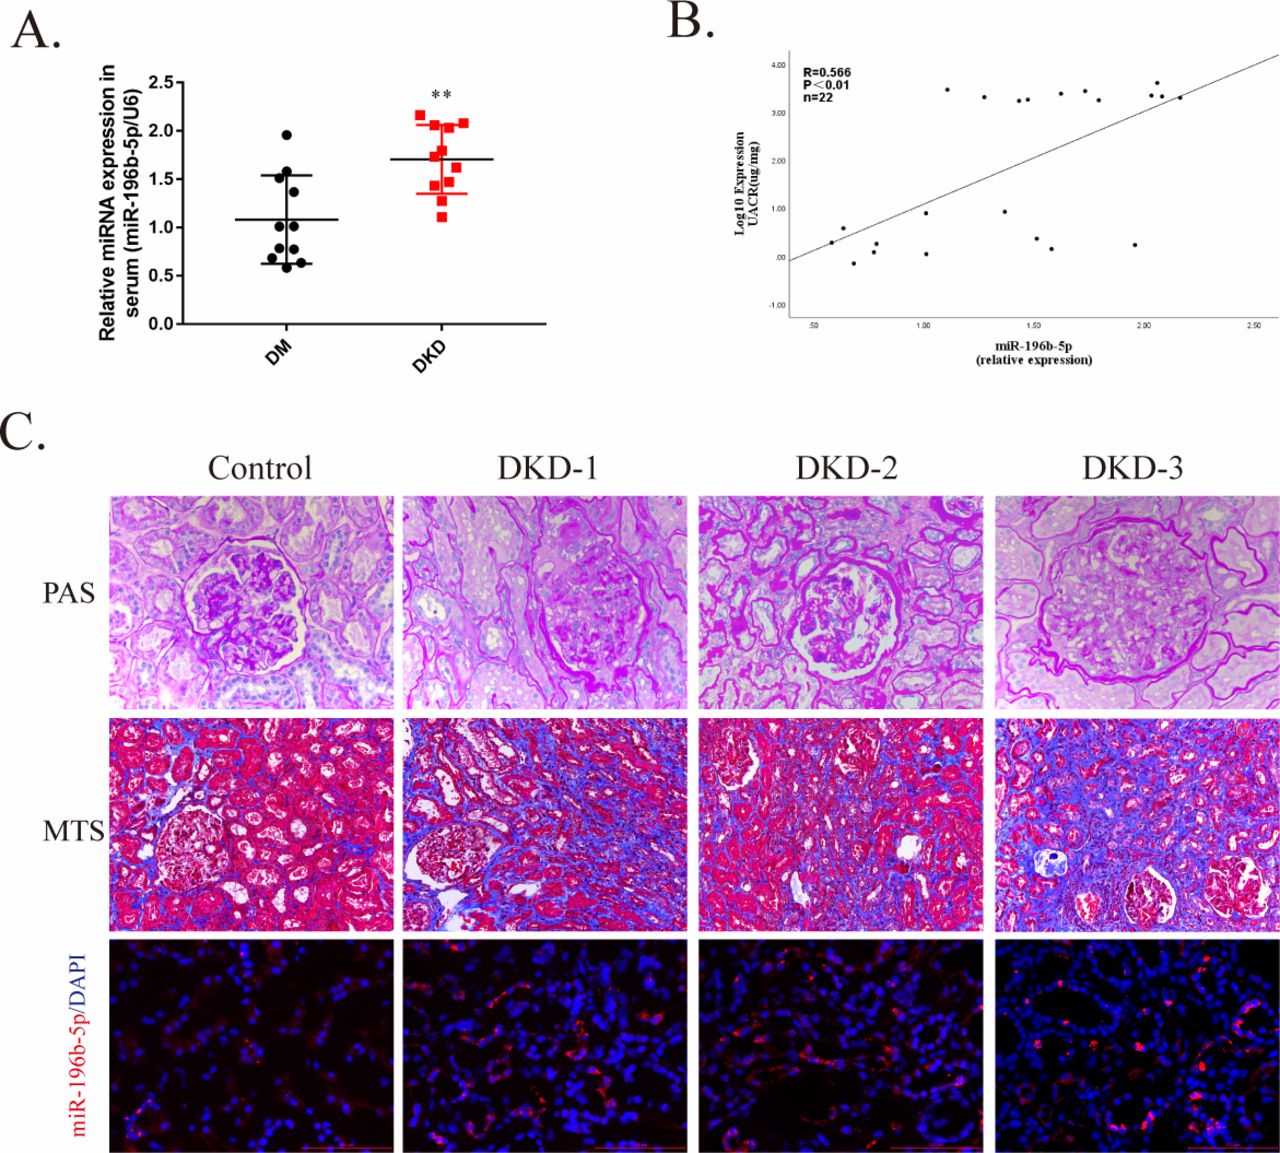
To explore the clinical implications of miR-196b-5p in human DKDs, we investigated the expression of miR-196b-5p in patients with T2DM, and the results showed that serum levels of miR-196b-5p expression was significantly elevated in patients with DKD as compared with patients without DKD (figure 6A). In addition, miR-196b-5p expression positively correlated with the proteinuria level (figure 6B). Finally, we examined miR-196b-5p expression in kidney specimens from patients with DKD. Compared with the control, miR-196b-5p expression increased and accumulated mainly in PTECs in patients with DKD (figure 6C).
miR-196b-5p expression increased in serum and kidney of patients with diabetic kidney disease (DKD). (A) Scatter plots of serum miR-196b-5p expression level in patients with diabetes mellitus (DM) with DKD (n=11) and without DKD (n=11). Each dot represents one patient. **p<0.01vs DM. (B) Correlation analysis of serum miR-196b-5p with albumin-to-creatinine ratio (UACR). The Spearman’s correlation coefficient (R) is given. (C) Representative image of periodic acid-Schiff (PAS) staining and Masson’s trichrome staining (MTS) for interstitial injury and fibrosis detection and representative image of miR-196b-5p staining of patients with or without DKD assessed by in situ hybridization. Scale bar, 100 µm. miRNA, micro RNA.
Discussion
The pathogenesis of DKD is quite complicated and the mechanism has not been fully elucidated. Hyperglycemia is an important initial factor in the occurrence of DKD, however, antihyperglycemia therapy cannot completely stop the progression of DKD. Increasing evidence suggests that hyperaldosteronism promotes renal damage.23 Plasma aldosterone concentration is inversely associated with the glomerular filtration rate in the general population.24 In Zucker diabetic fatty rats, urinary aldosterone levels were elevated, which was positively correlated with albuminuria.25 In addition, aldosterone escape during long-term blockade of the RAAS system is associated with an enhanced decline in GFR in patients with DKD.26 Moreover, several clinical studies have demonstrated the beneficial effects of MRA on the prevention of DKD progression.27 28 In our study, aldosterone intervention promoted renal fibrosis in db/db mice and MRA treatment reversed the harmful effects of aldosterone on the kidney, which is consistent with previous findings.29 Although MR is highly expressed in endothelial cells and tubular epithelial cells in the kidney, knockout of the MR gene in endothelial cells did not ameliorate renal injury in AKI and CKD, suggesting that tubular epithelial cells are important for aldosterone-induced kidney injury.30
Fibroblasts, the main source of ECM, play central importance in TIF. Emerging data have revealed that renal TIF progression also involves other cell types, such as tubular epithelial cells, and growth factors that mediate the crosstalk between these different cellular compartments.8 Our study found that although aldosterone increased FN, col1A1 and α-SMA levels in db/db mice, in vitro experiments showed that aldosterone did not activate fibroblasts directly. In addition, the expression of MR was high in tubular epithelial cells but almost undetectable in fibroblasts. These data suggest that the increase in ECM might result from an indirect effect of aldosterone on fibroblasts and that crosstalk might exist between tubular epithelial cells and fibroblasts. Evidence from previous studies indicates that tubular epithelial cells can mediate their paracrine effects via the release of EVs that deliver their cargo consisting of various mRNAs, miRNAs and proteins to recipient cells, implying a vital role of EVs in kidney diseases.31 32 Here, we demonstrated that with aldosterone stimulation, EVs derived from PTECs could be taken up by fibroblasts and caused fibroblast activation and proliferation. The in vivo injection experiments further verified the function of EVs: aldosterone exerted deleterious effects on the kidney through PTEC-derived EVs.
To illustrate the mechanism of EVs in renal fibrosis, we investigated the function of proteins and miRNAs in EVs. We observed that the RNA fraction but not proteins participated in EV-induced interstitial fibroblast activation and proliferation. Previous studies suggested that miRNA were involved in regulating the expression of mineralocorticoid receptor33 34 and aldosterone-induced fibrosis in kidney collecting duct cells.29 Then, we identified miR-196b-5p through the use of a miRNA assay. The expression of miR-196b-5p increased both in PTECs and EVs secreted by PTECs with aldosterone stimulation, indicating that the increase in miR-196b-5p in EVs mainly resulted from an increased expression of the miRNAs in PTECs. Previous research has reported that miR-196b-5p regulates the JAK/STAT pathway by targeting SOCS2 in hepatocytes.22 Here, our results revealed an association of miR-196b-5p with STAT3 and SOCS2 in fibroblasts. STAT3 and SOCS2 have been reported to play a role in DKD. Knockdown of STAT3 activity or use of a blocker of STAT acetylation in mice with diabetes ameliorated DKD progression, while injection of SOCS2 adenoviruses reduced STZ-induced renal lesions.2 35 These reports further support the fibrinogenic effects of miR-196b-5p on DKD found in our study.
Previously, Roux et al36 observed higher plasma levels of miR-196b-5p in patients with DKD, which conformed with our findings. In addition, we found that hsa-miR-196b-5p level was positively correlated with albuminuria in patients with DKD, implying that miR-196b-5p might be a potential marker of DKD progression.
In summary, this study demonstrates the involvement of the miR-196b-5p-EV pathway as a novel mechanism in aldosterone-induced renal impairment in diabetes. EVs rich in miR-196b-5p mediate the crosstalk between PTECs and fibroblasts during the development of renal fibrosis, which might be associated with the STAT3/SOCS2 signaling pathway. In PTECs, aldosterone elevates the expression of miR-196b-5p via MR. Then, miR-196b-5p is carried by EVs and secreted from PTECs. EVs containing miR-196b-5p are taken up by fibroblasts, which promotes the activation and proliferation of fibroblasts, further accelerating the progression of DKD (online supplementary figure 1). In addition, our study revealed that miR-196b-5p might be a potential marker for DKD progression, however, this needs to be verified in a prospective study with large sample of population.
Supplemental material
References
Footnotes
RH, XL and CP contributed equally.
Contributors RH, XL, CP, RG, LM, JH, TL, HQ, YW and QG performed the experiments and analyzed the data. QL and SY conceived the study, and ZW, CW and XX designed the experiments, analyzed the data and wrote the manuscript. JY and MJY provided significant assistance for the cell culture experiments.
Funding This work was supported by National Key Research & Development Plan, major project of precision medicine research (2017YFC0909600, sub-project: 2017YFC0909602, 2017YFC0909603); The National Natural Science Foundation of China (81670785, 81870567, 81800731,81770851, 81970720); Chongqing Science and Technology Committee Innovation Project (Technology Development and Application of Precision Medicine, cstc2016shms-ztzx1003).
Competing interests None declared.
Patient consent for publication Not required.
Ethics approval This study was approved by the ethics committee of the First Affiliated Hospital of Chongqing Medical University.
Provenance and peer review Not commissioned; externally peer reviewed.
Data availability statement Data are available on reasonable request. The dataset generated and analyzed in this study is available from the corresponding author on reasonable request.