Article Text

Abstract
Introduction To investigate the associations of 30 min postload plasma glucose (30 mPG) levels during an oral glucose tolerance test (OGTT) with the risk of future diabetes in a general Japanese population.
Research design and methods A total of 2957 Japanese community-dwelling residents without diabetes, aged 40–79 years, participated in the examinations in 2007 and 2008 (participation rate, 77.1%). Among them, 2162 subjects who received 75 g OGTT in a fasting state with measurements of plasma glucose level at 0, 30, and 120 min were followed up for 7 years (2007–2014). Cox’s proportional hazards model was used to estimate HRs and their 95% CIs of each index for the development of type 2 diabetes using continuous variables and quartiles with adjustment for traditional risk factors. The influence of 30 mPG on the predictive ability was estimated with Harrell’s C-statistics, integrated discrimination improvement (IDI), and the continuous net reclassification index (cNRI).
Results During follow-up, 275 subjects experienced type 2 diabetes. Elevated 30 mPG levels were significantly associated with increased risk of developing diabetes (p<0.01 for trend): the multivariable-adjusted HR was 8.41 (95% CI 4.97 to 14.24) for the highest versus the lowest quartile, and 2.26 (2.04 to 2.52) per 1 SD increase. This association was attenuated but remained significant after further adjustment for fasting and 2-hour postload plasma glucose levels. Incorporation of 30 mPG into the model including traditional risk factors with fasting and 2-hour postload plasma glucose levels for diabetes improved the predictive ability of type 2 diabetes (improvement in Harrell’s C-statistics values: from 0.828 to 0.839, p<0.01; IDI: 0.016, p<0.01; cNRI: 0.103, p=0.37).
Conclusions Elevated 30 mPG levels were associated with increased risk of diabetes, and inclusion of 30 mPG levels significantly improved the predictive ability for future diabetes, suggesting that 30 mPG may be useful for identifying high-risk populations for type 2 diabetes.
- adult diabetes
- oral glucose tolerance test
- epidemiology
This is an open access article distributed in accordance with the Creative Commons Attribution Non Commercial (CC BY-NC 4.0) license, which permits others to distribute, remix, adapt, build upon this work non-commercially, and license their derivative works on different terms, provided the original work is properly cited, appropriate credit is given, any changes made indicated, and the use is non-commercial. See: http://creativecommons.org/licenses/by-nc/4.0/.
Statistics from Altmetric.com
Significance of this study
What is already known about this subject?
Fasting and 2-hour postload plasma glucose levels are measured in an oral glucose tolerance test for diagnosing glucose tolerance status and identifying the high-risk population for future onset of diabetes. Meanwhile, it has been acknowledged that 30 min postload plasma glucose levels (30 mPG) reflect insulin secretion ability and insulin resistance. However, the clinical significance of measuring 30 mPG in addition to fasting and 2-hour postload plasma glucose levels for estimating the future risk of diabetes has not been fully addressed, especially in Asian populations.
What are the new findings?
Elevated 30 mPG levels were significantly associated with increased risk of developing diabetes after adjustment for traditional diabetic risk factors including fasting and 2-hour postload plasma glucose levels.
30 mPG was positively associated with future diabetes not only in subjects with pre-diabetes, but also in subjects with normal glucose tolerance.
Incorporation of 30 mPG into the model including traditional diabetic risk factors plus fasting and 2-hour postload plasma glucose levels significantly improved the ability to predict future onset of diabetes.
How might these results change the focus of research or clinical practice?
The present results highlight the usefulness of the 30 mPG level for the risk stratification of diabetes among subjects with normal glucose tolerance as well as those with pre-diabetes.
Introduction
The prevalence of diabetes is continuing to increase worldwide.1 2 Diabetes is a major cause of blindness, kidney failure, heart attacks, stroke, lower limb amputation, and diabetes-related diseases.3 In addition, many resources are required for the medical management and treatment of diabetes. Therefore, the prevention of diabetes is still a major public health priority. It has been acknowledged that early detection of high-risk populations for the future onset of type 2 diabetes, along with various interventions for lifestyle modification in these populations, is effective for reducing the burden of diabetes.4 5 Tools for assessing the risk of type 2 diabetes onset would be useful to detect high-risk populations, but the development of more precise risk assessment tools is warranted.
An oral glucose tolerance test (OGTT), in which the plasma glucose levels are measured in the fasting state and at 2 hours after oral administration of a glucose load, has been widely used to diagnose both diabetes mellitus and the state of impaired fasting glucose or impaired glucose tolerance known as pre-diabetes.6 Moreover, these fasting and 2-hour postload plasma glucose levels strongly predict the future development of diabetes.7 8 On the other hand, the intermediate measurements of plasma glucose during an OGTT—namely, 30 min postload plasma glucose (30 mPG) levels—have been considered to be important indicators of insulin secretion ability and insulin resistance.9 10 Previous epidemiological studies have reported that 30 mPG levels and other intermediate measurements of plasma glucose during an OGTT are also useful for identifying populations at high risk for the future development of type 2 diabetes.11–14 However, current evidence is lacking as to whether the predictive ability could be improved by adding 30 mPG levels to the known risk factors of diabetes, including fasting and 2-hour postload plasma glucose levels, especially in Asian populations. Since the incidence rate of type 2 diabetes and the effects of risk factors differ among ethnicities,15 16 it would be of value to assess this issue in an Asian population.
In the present study, therefore, we investigated the association of 30 mPG levels during an OGTT with the development of future diabetes among subjects without diabetes. In addition, we assessed the impact of adding 30 mPG levels to the known diabetes risk factors when estimating diabetes risk in a general Japanese population.
Methods
Study populations
The Hisayama Study is an ongoing population-based cohort study of cardiovascular diseases and their risk factors begun in 1961 in the town of Hisayama, a suburb of the Fukuoka metropolitan area on Kyushu Island in Japan.17 A detailed description of this survey was published previously.18 Beginning in 2007 and 2008, measurement of plasma glucose levels at 0, 30, and 120 min during a 75 g OGTT was added to the Hisayama Study. The present analysis thus focused on the follow-up of subjects who underwent health examinations between 2007 and 2014. In brief, a total of 2957 community-dwelling residents aged 40–79 years participated in the examinations in 2007 or 2008 (participation rate, 77.1%). After excluding 8 subjects who declined study consent, 46 who had already eaten breakfast, 35 who were receiving insulin therapy, and 156 who refused an OGTT, 2712 subjects received a 75 g OGTT. Further, after excluding 419 subjects with diabetes mellitus at baseline and 131 subjects who did not undergo any follow-up examination, 2162 subjects were enrolled in the present study.
Definition of diabetes at baseline
Plasma samples were taken in a fasting state and at 30 min and at 2 hours during an OGTT after an overnight fast of at least 12 hours at the baseline health examination in 2007 or 2008. Plasma glucose levels were determined by the hexokinase method. Glucose tolerance status was defined based on the results of the OGTT at baseline according to the WHO criteria in 2006.6 Thus, the glucose tolerance status categories were as follows. Normal glucose tolerance was defined as fasting plasma glucose (FPG) <6.1 mmol/L and 2-hour postload glucose (2hPG) <7.8 mmol/L. Pre-diabetes was defined as either impaired fasting glycemia (FPG 6.1–6.9 mmol/L and 2hPG <7.8 mmol/L) or impaired glucose tolerance (FPG <7.0 mmol/L and 2hPG 7.8–11.0 mmol/L). Diabetes was defined as FPG ≥7.0 mmol/L, 2hPG ≥11.0 mmol/L, and/or the use of anti-diabetic medications.
Determination of new-onset type 2 diabetes during follow-up
The study participants were followed up by annual health examinations until November 30, 2014 (median follow-up period: 6.0 years (range 0.6–7.4 years)). During follow-up, the new onset of type 2 diabetes was determined based on the data of either OGTT or the measurements of fasting or casual plasma glucose in the annual health examinations as FPG ≥7.0 mmol/L, 2hPG or casual plasma glucose ≥11.0 mmol/L, and/or the use of anti-diabetic medications. The date of the onset of diabetes was defined as the earliest date when participants met the criteria of the definition. When subjects died, we reviewed all available clinical information and identified new-onset diabetes based on the prior use of anti-diabetic medication. Participants were censored at the time of death, the latest occasion of the health examination, or the date of the diagnosis of type 1 diabetes (one subject was diagnosed as having type 1 diabetes during follow-up). The participants underwent an average of 6.4±2.1 follow-up examinations.
Risk factor measurements
Each participant completed a self-administered questionnaire regarding medical history, family history of diabetes, use of anti-hypertensive medications, glucose-lowering medications, or lipid-modifying medications, alcohol intake, smoking habits, and regular exercise. Diabetes mellitus in first-degree or second-degree relatives was taken to indicate a family history of diabetes. Alcohol intake and smoking habits were classified as either current use or not. Regular exercise was defined as engaging in sports at least three times per week during leisure time. Body mass index (BMI) was calculated from height and weight, which were measured in light clothes without shoes. Blood pressure was obtained three times using an automated sphygmomanometer with the participant in a sitting position after resting for at least 5 min; the average values were used in the analyses. Hypertension was defined as a systolic blood pressure ≥140 mm Hg, a diastolic blood pressure ≥90 mm Hg, or current treatment with antihypertensive agents. Fasting serum samples were used to determine total cholesterol, high-density lipoprotein cholesterol (HDL-C), and triglycerides enzymatically. Hemoglobin A1c levels were measured by latex aggregation immunoassay. The values for hemoglobin A1c were estimated as National Glycohemoglobin Standardization Program equivalent values calculated with the following formula: hemoglobin A1c (%)=1.02×hemoglobin A1c (Japan Diabetes Society) (%)+0.25%.19 Serum insulin levels were measured by using an electro-chemiluminescence immunoassay. Insulin secretion and insulin resistance were evaluated using the insulinogenic index, defined as (30 min insulin (pmol/L)–fasting insulin (pmol/L))/(30 mPG (mmol/L)–FPG(mmol/L)),20 and homeostasis model assessment of insulin resistance (HOMA-IR), defined as fasting insulin (μU/mL)×FPG (mmol/L)/22.5.21
Statistical analysis
30 mPG levels were divided into four categories by quartiles. Age- and sex-adjusted baseline characteristics were summarized across quartiles of 30 mPG using a linear regression model for mean values and using the direct method for binary variables against the overall study population as the standard. The trends across quartiles of 30 mPG were tested using a linear regression for mean values and logistic regression for frequencies. The HRs with their 95% CIs of the quartiles of 30 mPG for the development of diabetes were estimated using a Cox proportional hazards model. Adjustment was made for age, sex, family history of diabetes, systolic blood pressure, use of blood pressure–lowering medications, total cholesterol, HDL-C, triglycerides, lipid-lowering medications, BMI, smoking habit, alcohol intake, and regular exercise. Further adjustment was made for FPG and 2hPG, and for HOMA-IR and insulinogenic index to estimate the excess risk in relation to 30 mPG beyond these indices. The age- and sex-adjusted cumulative incidence of type 2 diabetes across quartiles of 30 mPG was calculated by using regression estimates from a relevant Cox model. The risk estimates per 1 SD increment in 30 mPG levels were computed using the relevant Cox model, including the 30 mPG values taken as a continuous variable. The heterogeneity in the association among subgroups was tested by adding multiplicative interaction terms of 30 mPG levels with the variable of subgroup to the relevant Cox model. To investigate the influence of 30 mPG on the ability to predict future diabetes, Harrell’s C-statistics, integrated discrimination improvement (IDI), and continuous net reclassification improvement (cNRI) for survival analyses were calculated before and after adding 30 mPG to the statistical model including traditional risk factors,22 23 wherein bootstrap sampling with 1000 iterations was used to estimate the 95% CIs and p values.24 Sensitivity analyses were performed after excluding subjects who developed diabetes during the first 2 years of follow-up. In order to determine the possible cut-off value of 30 mPG levels to predict future development of diabetes, we identified the 30 mPG levels for the maximum of Youden Index, a summary statistic of the ROC curve defined as (sensitivity+specificity–1).25 The cut-off value according to the minimum distance from the upper-left corner of the ROC curve was also estimated. Using this cut-off value, the joint association of high 30 mPG and either high FPG or high 2hPG with diabetes was estimated in the multivariable-adjusted model. The SAS software package V.9.4 (SAS Institute, Cary, NC) was used for statistical analyses. A value of p <0.05 was considered statistically significant in all analyses.
Results
Participants’ characteristics according to the quartiles of 30 mPG are summarized in table 1. Subjects with higher 30 mPG levels were more likely to be older and more likely to be male. The mean values of FPG, 2hPG, and hemoglobin A1c, the geometric mean values of HOMA-IR, and the frequencies of the presence of family history of diabetes and the presence of pre-diabetes increased with elevating 30 mPG levels, whereas the geometric mean values of the insulinogenic index decreased. There were increasing trends in the mean values of systolic and diastolic blood pressure, serum total cholesterol, and BMI, the geometric mean values of serum triglycerides, and the frequency of use of antihypertensive agents across the 30 mPG levels. Higher 30 mPG levels were significantly associated with lower mean values of serum HDL-C and frequency of alcohol intake.
Baseline characteristics according to 30 min postload plasma glucose levels during an oral glucose tolerance test
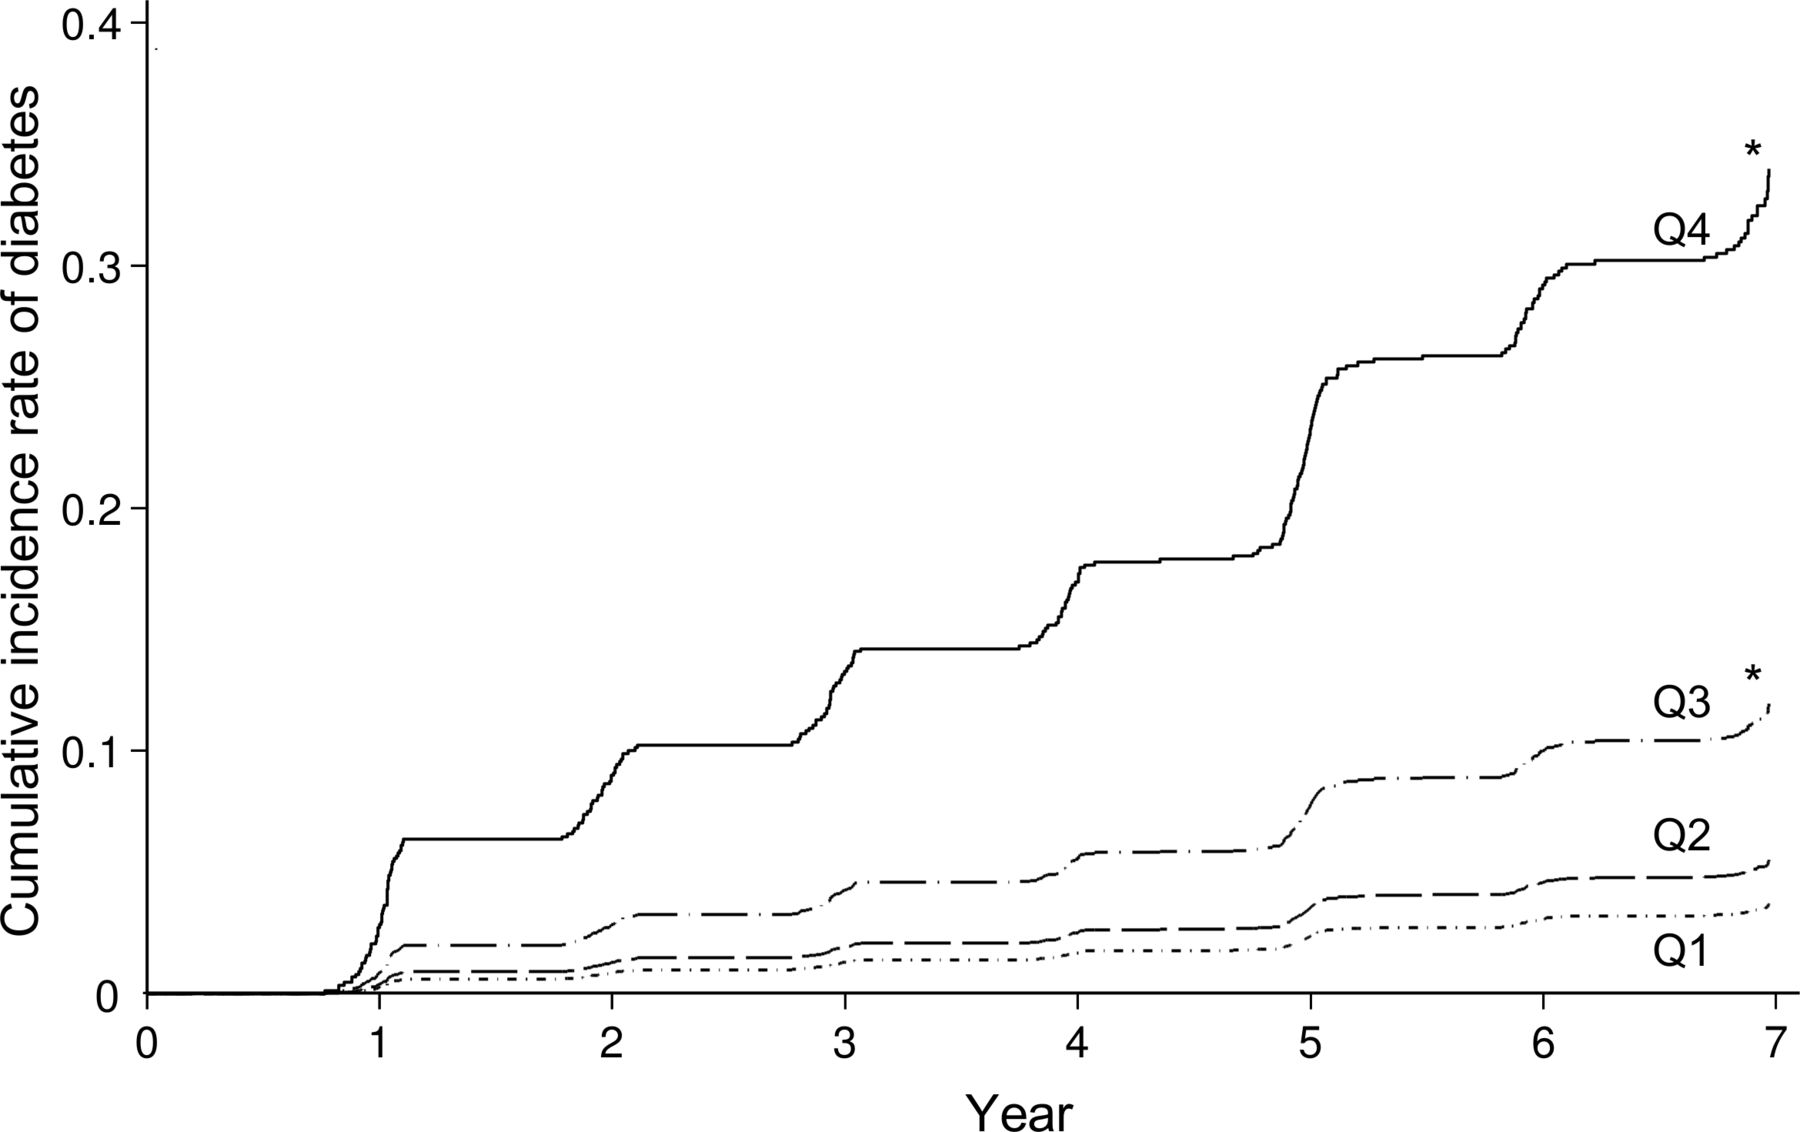
During the 7-year follow-up period, 275 subjects developed type 2 diabetes. The age- and sex-adjusted cumulative incidence of type 2 diabetes increased significantly with elevating 30 mPG levels (p for trend <0.001) (figure 1). Higher 30 mPG levels were significantly associated with the risk of development of diabetes after adjusting for age, sex, family history of diabetes, systolic blood pressure, use of antihypertensive agents, serum total cholesterol, serum HDL-C, serum triglycerides, use of lipid-modifying medication, BMI, smoking habits, alcohol intake, and regular exercise, in which the significant increases in the risk of type 2 diabetes were observed in the third quartile against the first quartile: HRs (95% CIs) were 2.66 (1.51 to 4.67) in the third quartile and 8.41 (4.97 to 14.24) in the fourth quartile (table 2: model 2). This association was attenuated after further adjustment for HOMA-IR and the insulinogenic index: HR (95% CI), 1.32 (0.75 to 2.32) in the third quartile and 2.85 (1.65 to 4.91) in the fourth quartile (table 2: model 3). On the other hand, the significantly increased risk of type 2 diabetes in the fourth quartile versus the first quartile of 30 mPG was still observed even after adjusting for FPG and 2hPG: HR (95% CI) 2.44 (1.39 to 4.30) (table 2: model 4). These associations did not change substantially after excluding subjects who developed diabetes during the initial 2 years of follow-up (online supplementary table 1).
Supplemental material

Age- and sex-adjusted cumulative incidence according to 30 min postload plasma glucose levels. Subjects were divided into 4 groups according to quartiles of 30 min postload plasma glucose levels (Q1: ≤7.5 mmol/L; Q2: 7.6–8.7 mmol/L; Q3: 8.8–9.8 mmol/L; Q4: ≥9.9 mmol/L). *p<0.01 vs. Q1.
Associations between the 30 min postload plasma glucose levels during an oral glucose tolerance test and the development of type 2 diabetes
We also investigated the association between 30 mPG and diabetic risk separately in subgroups of normal glucose tolerance and in pre-diabetes (online supplementary table 2). As a result, higher 30 mPG levels were significantly associated with increased risk of the development of diabetes in both subjects with normal glucose tolerance and those with pre-diabetes (both p for trend <0.001). There was no significant heterogeneity in the association between subgroups (p for heterogeneity=0.76). The same was true in the analysis using 30 mPG taken as a continuous variable (p for heterogeneity=0.85). In addition, the subgroup analyses of other risk factors did not reveal any evidence of a difference in magnitude of the association between the subgroups of risk factors (all p>0.10 for interaction), except for the subgroups defined using BMI with a magnitude of 30 mPG, for whom the magnitude of association was greater in those with obesity (BMI ≥25 kg/m2) than those without obesity (p for heterogeneity <0.01) (online supplementary figure 1).
Next, the influence of 30 mPG on the predictive ability for future diabetes was estimated (table 3). When 30 mPG was added to the basic model including traditional risk factors—namely, age, sex, family history of diabetes mellitus, systolic blood pressure, use of antihypertensive agents, serum total cholesterol, serum HDL-C, serum triglycerides, use of lipid-modifying medication, BMI, smoking habits, alcohol intake, and regular exercise—there was a significant increase in the Harrell’s C-statistics value, from 0.696 to 0.785 (p<0.001), which was quite similar to the increment of C-statistics when FPG, 2hPG, or hemoglobin A1c was added to the basic model. In addition, although the C-statistics value of the model including FPG and 30 mPG was lower than that of the model including FPG and 2hPG (Harrell’s C-statistics value was 0.811 in the model including FPG and 30 mPG, and 0.828 in the model including FPG and 2hPG; p=0.02), incorporation of 30 mPG into the model including FPG and 2hPG further improved significantly the C-statistics value from 0.828 to 0.839 (p=0.005) and IDI (p=0.008), but did not cNRI. As a sensitivity analysis, the C-statistics increased significantly after adding 30 mPG to the model including hemoglobin A1c (from 0.785 to 0.809, p<0.001) and the model including FPG, 2hPG, and hemoglobin A1c (from 0.842 to 0.847, p=0.03) (online supplementary table 3).
Comparison of predictive ability between models
Finally, we investigated the cut-off value of 30 mPG for detecting the high-risk population of incident diabetes. The indices of the risk assessment for the development of type 2 diabetes using different cut-off values of 30 mPG are summarized in online supplementary table 4. Based on analysis of the ROC curve and Youden Index, a 30 mPG cut-off of 9.6 mmol/L (173 mg/dL) was found to differentiate the subjects with/without the development of type 2 diabetes over 7 years (figure 2). The same cut-off value was obtained when using the distance from the upper-left corner as a criterion. The sensitivity and specificity of the optimal cut-off value (9.6 mmol/L) were 70.9% (95% CI 65.5% to 76.3%) and 75.9% (95% CI 74.0 to 77.8%), respectively, with the highest HR and Harrell’s C-statistics. Then, we estimated the joint association of high 30 mPG defined using the aforementioned cut-off value (30 mPG≥9.6 mmol/L) with high FPG (FPG≥6.1 mmol/L) or high 2hPG (2hPG≥7.8 mmol/L) on the risk of developing type 2 diabetes (online supplementary figure 2). Subjects with a higher 30 mPG level had a significantly higher risk of incident diabetes than those with a lower 30 mPG level even among those with lower FPG levels, but the risk of incident diabetes increased steeply in those with higher levels of both 30 mPG and FPG as compared with those with lower levels of both indices. Similar associations were observed for the combination of 30 mPG with 2hPG.

(A) Receiver operating characteristic (ROC) curve based on 30 min postload plasma glucose levels for classification of future diabetes, and (B) Youden index at each value of 30 min postload plasma glucose levels. The values for the maximum of Youden Index and the minimum distance from the upper-left corner of the ROC curve were 9.6 mmol/L and 173 mg/dL, respectively.
Discussion
The present study demonstrated that elevated 30 mPG levels during an OGTT were associated with the development of diabetes in a general Japanese population. This association remained significant even after adjustment for confounding factors and further adjustment for FPG and 2hPG. Intriguingly, the 30 mPG was positively associated with future diabetes not only in subjects with pre-diabetes, but also in subjects with normal glucose tolerance. In addition, the incorporation of 30 mPG into the model including traditional diabetic risk factors plus FPG and 2hPG significantly improved the ability to predict future onset of diabetes. These findings highlight the usefulness of the 30 mPG levels during an OGTT for identifying subjects at high risk of future diabetes in addition to the current categorization of glucose intolerance using FPG and 2 PG in general populations in East Asia.
Several observational studies have reported that glycemic indices measured at several time-points during an OGTT were positively associated with the development of type 2 diabetes.11–14 26–29 An occupational cohort study in Japan also found that the risk of type 2 diabetes increased with higher 60 mPG level and the predictive ability of 60 mPG for future diabetes was better than that of FPG and 2hPG, although the association between 30 mPG and diabetic risk was not addressed in this study.26 Prospective studies in India reported that plasma glucose levels at 30 min in subjects with normal glucose tolerance27 and at 60 min in subjects with impaired glucose tolerance28 were significantly associated with future diabetes. The San Antonio Heart Study,12 29 the Botnia Study,13 and the Malmö Prevention Project cohorts14 showed that higher levels of 60 min postload plasma glucose (60 mPG) were significantly associated with greater risk of type 2 diabetes. These studies also reported that intermediate plasma glucose during an OGTT, such as 30 mPG and 60 mPG, achieved a better prediction of future diabetes than FPG or 2hPG, in which 60 mPG had greater predictive ability than 30 mPG.12–14 A clinical study conducted in obese adolescents revealed that the monophasic shape, which was defined by a gradual decrease after the peak of the intermediate plasma glucose levels without reascending at 2 hours, reflected lower insulin sensitivity and poorer beta-cell function, independent of FPG and 2hPG.30 These findings suggest that increased intermediate plasma glucose levels during an OGTT are a good predictor of future onset of type 2 diabetes.
In the present study, higher 30 mPG was significantly associated with a higher risk of type 2 diabetes, and adding 30 mPG to the model with known risk factors plus FPG and 2hPG significantly improved the predictive ability for the future onset of type 2 diabetes. The improvement of predictive ability for diabetes was also observed after adding 30 mPG to the model including hemoglobin A1c. In addition, the significant associations were observed in subjects with pre-diabetes and also in subjects with normal glucose tolerance. Several previous longitudinal studies also addressed the improvements of the predictive ability after incorporating intermediate measurements into the model of traditional risk factors including FPG and 2hPG. A hospital-based study conducted in Chinese subjects found that increased area under curve estimated using plasma glucose levels at 0, 30, 60, 120, and 180 min during OGTT was associated with higher likelihood of prevalent type 2 diabetes than FPG and 2hPG.31 The Botnia Study showed that intermediate measurements of plasma glucose during OGTT, especially 60 mPG, had significantly higher ability to predict future type 2 diabetes, and adding 60 mPG to the existing risk prediction model or multiple clinical risk factors improved the predictive ability.13 32 The Malmö Preventive Project also showed that higher 60 mPG had significantly greater C-statistics values for predicting future onset of type 2 diabetes than the estimation of impaired glucose tolerance status using 2hPG.14 These results highlight the utility of intermediate plasma glucose for risk assessment of future type 2 diabetes in subjects with normal glucose tolerance as well as those with pre-diabetes.
Several mechanisms may be involved in the association between high 30 mPG levels and type 2 diabetes. First, high 30 mPG levels during an OGTT provide a surrogate measure of impaired insulin secretion ability, whole-body insulin resistance, and low muscle mass and are a good predictor of the future risk of diabetes.11 33–35 In support of this explanation, the present study found that the magnitude of the association between 30 mPG and the risk of type 2 diabetes was attenuated after adjusting for HOMA-IR and the insulinogenic index. Second, subjects with high 30 mPG may be likely to have greater glycemic variability after a meal. Greater glycemic variability has been reported to promote the overproduction of superoxide36 37 and an increase in whole-body inflammation,38 which further deteriorate insulin resistance and insulin secretion.39 Greater variability also causes a loss of pancreatic beta-cells due to increased apoptotic cell death.40 A reduced response of glucagon-like peptide-1 due to high plasma glucose might also cause future deterioration of glucose metabolism.41 When high 30 mPG and obesity coexist, these possible mechanisms may exacerbate insulin resistance and further accelerate the progression of glucose intolerance, as shown in the subgroup analysis of BMI level in the present study (ie, the extent of the association between 30 mPG and diabetic risk was significantly stronger in subjects with BMI of ≥25 kg/m2 than subjects with BMI of <25 kg/m2).
The present study found that the cut-off value of 30 mPG that significantly optimizes the ability to discriminate the future onset of type 2 diabetes was around 9.6 mmol/L (173 mg/dL), when equal weight was given to sensitivity and specificity. Meanwhile, given that a significant excess risk of type 2 diabetes was observed from the third quartile in the present study and that the sensitivity should be weighed more than the specificity for the selection of moderate-to-high risk individuals who require lifestyle modification at an early stage, around 8.6–9.4 mmol/L (155–170 mg/dL) may be appropriate as the cut-off of 30 mPG in a clinical setting (online supplementary table 3). Further investigations will be needed to elucidate this matter, with due consideration given to ethical issues and cost-effectiveness.
Several limitations should be noted. First, plasma glucose levels during OGTT were measured only once at baseline, which likely caused some degree of misclassification, which would have weakened the association indicated in the present study. Second, there is a possibility that the use of only a single estimation of glucose tolerance status could have resulted in misdiagnosis of diabetes as non-diabetes at baseline. These misdiagnosed subjects were likely to have high 30 mPG levels and greater risk of the development of diabetes in the near future. However, a sensitivity analysis after censoring subjects who developed diabetes during the initial 2-year follow-up period did not alter the association substantially. Another limitation was the lack of measurements of 60 mPG during an OGTT, which prevented our comparing their effects with those of 30 mPG. Finally, the generalizability of the findings may be limited because this study was conducted in a community in Japan.
In conclusion, the present study showed that elevated 30 mPG levels during an OGTT were significantly associated with a high risk of future diabetes, irrespective of the status of glucose tolerance, and possibly irrespective of the status of insulin secretion and insulin resistance. These findings suggest that the 30 mPG level during an OGTT is a useful indicator for detecting high-risk individuals for future onset of type 2 diabetes, in addition to the current risk assessment using the categorization of pre-diabetes and traditional risk factors.
Acknowledgments
The authors greatly appreciate the residents of the town of Hisayama for their participation in the survey and the staff of the Division of Health and Welfare of Hisayama for their cooperation with this study. The statistical analyses were carried out using the computer resources offered under the category of General Projects by the Research Institute for Information Technology, Kyushu University.
References
Footnotes
Contributors YH contributed to the data collection, data analysis, data interpretation, and drafting of the manuscript. JH, MY, MH, DY, MS, TH, and SS contributed to the data collection and data interpretation. HK, TT, HM, SN, and TK contributed to the data interpretation. TN contributed to the study concept and design, data collection, and data interpretation; reviewed/edited the manuscript; and performed study supervision. TN is the guarantor.
Funding This study was supported in part by Grants-in-Aid for Scientific Research (A) (JP16H02692), (B) (JP16H05850, JP17H04126, and JP18H02737), and (C) (JP17K09114, JP17K09113, JP17K01853, JP18K07565, JP18K09412, and JP19K07890) and for Early-Career Scientists (JP18K17925 and JP18K17382) from the Ministry of Education, Culture, Sports, Science and Technology of Japan; by Health and Labour Sciences Research Grants of the Ministry of Health, Labour and Welfare of Japan (H29-Junkankitou-Ippan-003 and H30-Shokuhin-[Sitei]-005); and by the Japan Agency for Medical Research and Development (JP19dk0207025, JP19ek0210082, JP19ek0210083, JP19km0405202, JP19ek0210080, and JP19fk0108075). In addition, this study was sponsored by Suntory Beverage & Food Limited (Tokyo, Japan).
Competing interests TN obtained funding support from Suntory Holdings Limited (Tokyo, Japan). HK, TT, and HM are employed by Suntory Beverage & Food Limited (Tokyo, Japan), which was the sponsor of this study and markets green tea products. SN is a managing executive officer of Suntory Beverage & Food Limited (Tokyo, Japan).
Patient consent for publication Not required.
Ethics approval The present study was carried out with the approval of the Kyushu University Institutional Review Board for Clinical Research (approval no. 2019-237), and all participants provided written informed consent.
Provenance and peer review Not commissioned; externally peer reviewed.
Data availability statement The datasets generated and analyzed in the present study are not publicly available because they contain confidential clinical and demographic data of the study participants. However, the further information about the datasets is available with permission of the principal investigator of the Hisayama Study (TN) on reasonable request for purposes of replicating procedures and results.