Article Text

Abstract
Introduction Diabetes mellitus is a risk factor of chronic kidney disease (CKD); however, the relationship between fasting glucose and CKD remains controversial in non-diabetic population. This study aimed to assess causal relationship between genetically predicted fasting glucose and incident CKD.
Research design and methods This study included 5909 participants without diabetes and CKD from the Korean Genome Epidemiology Study. The genetic risk score (GRS9) was calculated using nine genetic variants associated with fasting glucose in previous genome-wide association studies. Incident CKD was defined as estimated glomerular filtration rate (eGFR) <60 mL/min/1.73 m2 and/or proteinuria (≥1+). The causal relationship between fasting glucose and CKD was evaluated using the Mendelian randomization (MR) approach.
Results The GRS9 was strongly associated with fasting glucose (β, 1.01; p<0.001). During a median follow-up of 11.6 years, 490 (8.3%) CKD events occurred. However, GRS9 was not significantly different between participants with CKD events and those without. After adjusting for confounding factors, fasting glucose was not associated with incident CKD (OR 0.990; 95% CI 0.977 to 1.002; p=0.098). In the MR analysis, GRS9 was not associated with CKD development (OR per 1 SD increase, 1.179; 95% CI 0.819 to 1.696; p=0.376). Further evaluation using various other MR methods and strict CKD criteria (decrease in the eGFR of ≥30% to a value of <60 mL/min/1.73 m2) found no significant relationship between GRS9 and incident CKD.
Conclusions Fasting glucose was not causally associated with CKD development in non-diabetic population.
- insulin resistance
- prediabetic state
- kidney diseases
This is an open access article distributed in accordance with the Creative Commons Attribution Non Commercial (CC BY-NC 4.0) license, which permits others to distribute, remix, adapt, build upon this work non-commercially, and license their derivative works on different terms, provided the original work is properly cited, appropriate credit is given, any changes made indicated, and the use is non-commercial. See: http://creativecommons.org/licenses/by-nc/4.0/.
Statistics from Altmetric.com
Significance of this study
What is already known about this subject?
Diabetes mellitus is a well-known risk factor of chronic kidney disease (CKD).
The relationship between fasting glucose and development of CKD remains controversial in non-diabetic population.
What are the new findings?
The genetic risk score, calculated based on nine genetic variants associated with fasting glucose in previous genome-wide association studies, was strongly associated with fasting glucose.
The genetic risk score was comparable between participants with CKD events and those without.
In Mendelian randomization approach, genetic risk score was not causally associated with CKD development.
How might these results change the focus of research or clinical practice?
Our findings can form the basis of clinical practice that strict controlling of fasting glucose in pre-diabetes is necessary to prevent cardiovascular disease, but may not to prevent CKD.
Introduction
Chronic kidney disease (CKD) is a major global health problem with increasing prevalence.1 CKD imposes substantial socioeconomic burden due to the high prevalence of premature death caused by cardiovascular diseases (CVD).2–4 Therefore, early detection and intervention of risk factors have been considered as an important strategy to prevent CKD occurrence. Among the risk factors, diabetes mellitus (DM) is the leading cause of CKD in all developed countries and many low and middle-income countries,3 and the prevalence of DM is expected to increase to 7.7% in adults by 2030.5 Thus, screening for DM is one of the essential factors for preventing CKD development.
It is well known that pre-diabetes as well as DM were associated with increased risk of CVD.6 Therefore, several researchers assumed that CKD can also occur in pre-diabetes stage because CKD and CVD share common risk factors. Importantly, several studies have reported that up to one-third of patients newly diagnosed with DM already showed signs of renal damage.7–9 However, when evaluated the relationship between pre-diabetes and CKD development, pre-diabetes, which is defined as impaired fasting glucose (IFG), has been identified to be significantly associated with incident CKD in some studies,10 11 but not in others.12–18 In particular, some studies showed that IFG was associated with incident CKD in unadjusted or age and sex-adjusted models; however, the statistical significance was lost when additionally adjusted for cardiovascular risk factors.13 15–17 Therefore, considering the unknown confounding factors and common risk factors shared by DM and CKD, it is difficult to estimate the precise association between pre-diabetes and CKD using a conventional observational study. Recent meta-analysis also showed modest association between pre-diabetes and incident CKD, however heterogeneity among included studies was considerable.19 Accordingly, the relationship between pre-diabetes and CKD development remains controversial.
Mendelian randomization (MR) has been recently used as a method to assess the causality between genetically predicted factors and diseases. Because genetic variants are randomly assorted during meiosis, inherited variants associated with risk factors mitigate the possibility of reverse causality and impact of confounding factors.20 Therefore, to evaluate causal relationship between pre-diabetes and incident CKD without confounding cardiovascular risk factors, this study aimed to examine this relationship in Korean non-diabetic population using MR analysis.
Materials and methods
Study design and population
This study was conducted in the participants of the Korean Genome and Epidemiology Study (KoGES), which is a prospective cohort study launched in 2001. The detailed cohort profile of the KoGES was described previously.21 The participants of this study comprised individuals living in Ansung and Ansan, which are provinces near Seoul, the capital of Korea. Briefly, a total of 10 030 individuals aged between 40 and 69 years were initially recruited between 1 July 2001 and 31 January 2003 for the Ansung and Ansan cohorts. Among these, 8840 individuals were included in the Korea Association Resource (KARE) consortium, which was a genome-wide association study (GWAS) that aimed to identify the underlying genetic risk factors of diseases and metabolic profiles of the Korean population. Detailed quality control steps of KARE consortium were described elsewhere.22 After further excluding 2931 individuals with history of CKD or DM, evidence of CKD or DM, without follow-up data, and without measurement of single nucleotide polymorphisms (SNP) associated with fasting glucose, 5909 individuals were finally included for this study (online supplementary figure 1) and were followed up biennially until 31 December 2014. All participants voluntarily provided an informed consent, and this study was carried out in accordance with the Declaration of Helsinki.
Supplemental material
Data collection
Baseline demographic factors, medical history, and medications were obtained using a standardized questionnaire. Blood pressure (BP) was measured by trained healthcare providers after at least 5 min of rest. All blood samples obtained after 8 hours of fasting and first-voided urine samples were collected and sent to the central laboratory of KoGES (Seoul Clinical Laboratories, Seoul, Republic of Korea). The estimated glomerular filtration rate (eGFR) was calculated using the CKD Epidemiology Collaboration equation,23 and proteinuria was assessed by dipstick test. Pre-diabetes was defined according to the American Diabetes Association criteria.24 Accordingly, participants who had a fasting glucose of 100–125 mg/dL (IFG), a 2-hour glucose of 140–199 mg/dL during the 75 g oral glucose tolerance test (OGTT) (impaired glucose tolerance (IGT)), or glycated hemoglobin (HbA1c) of 5.7%–6.4% were defined as having pre-diabetes. In addition, newly developed DM during follow-up period was defined as follows: fasting glucose ≥126 mg/dL, 2-hour glucose after 75 g OGTT ≥200 mg/dL, HbA1c ≥6.5%, or having antidiabetes medication.
Instrumental variables
Because MR analysis has basic assumptions that genetic variants must be strongly associated with the exposure, and not associated with confounders (online supplementary figure 2), we first selected SNPs which were found to be associated with fasting glucose in previous large GWAS and KARE consortium.25–28 Among the 41 candidate SNPs, 14 present in the data satisfying the linkage disequilibrium pruning (r2<0.2) were used for analysis.29 First, we calculated the magnitude of the effect of 14 SNPs and fasting glucose adjusted for age, sex, and albumin with an additive model (online supplementary table 1). To identify the pleiotropic effect, we identified whether 14 SNPs are associated with major cardiovascular risk factors, such as eGFR, high BP (≥140/90 mm Hg or on medication), high triglyceride (TG) (≥150 mg/dL), low high-density lipoprotein (HDL) (<40 mg/dL in men, <50 mg/dL in women), and central obesity (waist circumference ≥90 cm in men, ≥85 cm in women). As a result, 5 of the 14 SNPs showed associations with at least one trait with a nominal p value of <0.05 (online supplementary table 2). We calculated the weighted genetic risk score (wGRS) using all 14 SNPs (GRS14) and final wGRS using 9 SNPs (GRS9) that were not associated with cardiovascular risk factors. The score was defined as the sum of the number of fasting glucose-increasing alleles at each locus multiplied by the respective β coefficient from our data (online supplementary table 1).30
Study outcome
The primary outcome of this study was incident CKD defined as eGFR less than 60 mL/min/1.73 m2 and/or proteinuria ≥1+ at least two measurements during the follow-up period. The secondary outcome was more strictly defined incident CKD, which was a decrease in the eGFR of ≥30% to a value of <60 mL/min/1.73 m2.18
Statistical analyses
For all data, we used mean±SD for continuous variables and numbers and percentages for categorical variables unless otherwise specified. As a parametric method, the Student’s t-test and χ2 test were used; if the normality was not satisfied, the Mann-Whitney U test and Fisher’s exact test were used. Linear and log-linear regression analysis were used according to the type of dependent variable, and the results were expressed as β coefficient (SE) and OR (95% CI), respectively. We adjusted age, sex, albumin, eGFR, high BP, high TG, low HDL, and central obesity as covariables. In addition, the relationship between glycemic traits and incident CKD was also evaluated using Cox proportional hazards regression model. The significance level was set at 0.05 using a two-sided test.
We performed one-sample MR analyses using the ‘MendelianRandomization’ package (R V.3.6.1)31 with genetic variants as instrumental variables (IV) to identify causality.32 33 This analysis was conducted using inverse-variance weighted (IVW), MR-Egger, and weighted median methods for multiple genetic variants. MR analysis was performed using the summarized association values (β coefficients and SEs) of each gene variant with exposure (fasting glucose) and outcomes.34 Such summary statistics are often publicly available by GWAS meta-analyses.35 36 At first, the IVW method, which is used to satisfy the IV assumptions, was used.37 In addition, the MR-Egger method38 and the weighted median (or median-based) method,39 which are used when the assumption of IVs is weak, were used. Moreover, we used several options, such as the use of robust regression, fixed effects, or random effects models, and the penalization of weights for genetic variants with heterogeneous causal estimates.40 Additionally, the multivariable MR method was used to estimate the causal effect for GRS14 that contains pleiotropic genetic variants.41
Results
Baseline characteristics
The baseline characteristics of participants according to quartiles of GRS9 are presented in table 1. The mean age was 51.5 years and 47.0% of participants were men. There was no age difference between groups, but quartile 3 had more men than other groups. Fasting glucose (p<0.001) and 2-hour OGTT glucose (p=0.03) tended to increase in high GRS9 quartiles. In addition, higher GRS9 quartile groups also had higher percentage of participants with IFG (p=0.03) and IGT (p<0.001). Body mass index in quartile 4 was lower than that of quartile 1, but other clinical parameters were not significantly different between quartiles.
Baseline characteristics of patients according to quartiles of GRS9
Association between GRS, fasting glucose, and eGFR
When we calculated GRS using all 14 SNPs (GRS14) and 9 non-pleiotropic SNPs (GRS9), both GRS14 (β, 0.81; p<0.001) and GRS9 (β, 1.01; p<0.001) were strongly associated with fasting glucose (online supplementary table 1). In addition, after adjusting for confounding factors, such as age, sex, baseline eGFR, and cardiovascular risk factors, GRSs were still significantly correlated with fasting glucose (table 2). In this analysis, all cardiovascular risk factors, including high TG, high waist circumference, low HDL, and high BP, were significantly associated with fasting glucose, but not with eGFR. Moreover, GRS9 was significantly higher in participants with IFG than in those with normal glucose (p=0.002), but not different between participants with CKD event and those without (p=0.58, figure 1).
Association between fasting glucose and genetic risk score
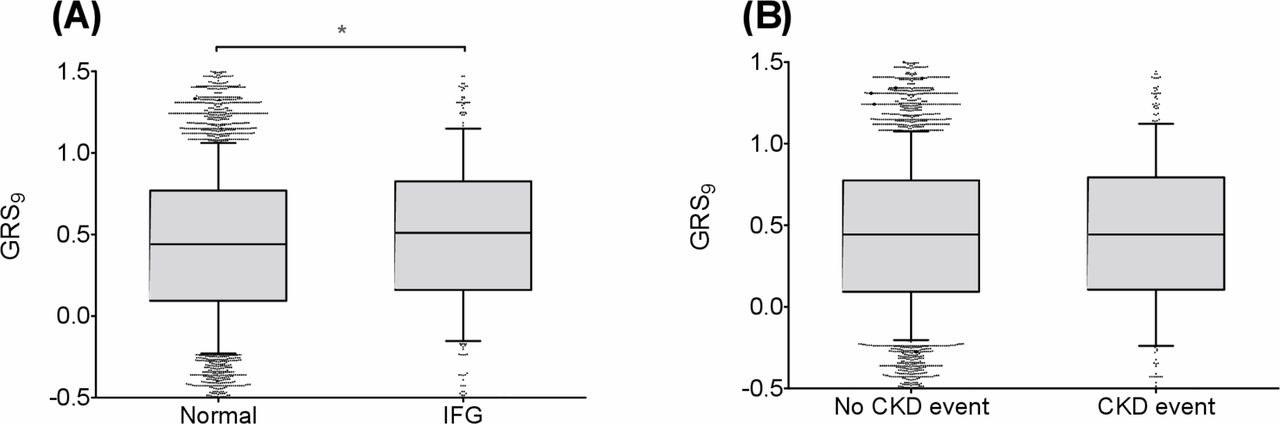
Box plot for weighted genetic risk score (GRS9) according to impaired fasting glucose (IFG) and chronic kidney disease (CKD) event status. (A) IFG, (B) CKD event. *P<0.05.
Association between glycemic traits and incident CKD
During a median follow-up of 11.6 years, 490 (8.3%) CKD events occurred. The incidence of CKD was not different among GRS9 quartiles (p=0.809, table 1). The mean eGFR decline rate was −2.3±2.5 mL/min/1.73 m2/year, and it was also not different among GRS9 quartiles (p=0.203, online supplementary figure 3). In addition, incidence of new DM during follow-up period was higher in quartile 3 group than others, but there was no significant tendency of diabetes incidence among quartiles (p for trend=0.311). When we evaluated the association between fasting glucose and incident CKD, fasting glucose was not associated with incident CKD in both unadjusted (OR per 1 mg/dL increase, 0.993; 95% CI 0.982 to 1.004; p=0.212) and adjusted models (OR per 1 mg/dL increase, 0.990; 95% CI 0.977 to 1.002; p=0.098, table 3). This relationship was persistent when we conducted an analysis of the IFG (compared with normal glucose) and secondary outcome (≥30% to a value of <60 mL/min/1.73 m2). Moreover, GRS9 was not associated with primary (OR per 1 SD increase, 1.114; 95% CI 0.916 to 1.354; p=0.281) and secondary outcomes (OR per 1 SD increase, 1.174; 95% CI 0.921 to 1.497; p=0.195). In GRS9 quartiles, significantly increased risk of CKD was not shown in higher quartiles when compared with quartile 1. When we evaluated the association between 2-hour OGTT glucose and incident CKD, 2-hour OGTT glucose and IGT were significantly associated with incident CKD in the unadjusted model (online supplementary table 3). However, statistical significance has disappeared after adjusting for the confounders. Moreover, the relationship between HbA1c and incident CKD was similar to that of 2-hour OGTT glucose (online supplementary table 4). Similarly, there was no significant relationship between glycemic traits and incident CKD in multivariable Cox proportional hazards regression analysis (online supplementary table 5).
Association between fasting glucose and incident CKD
MR analysis
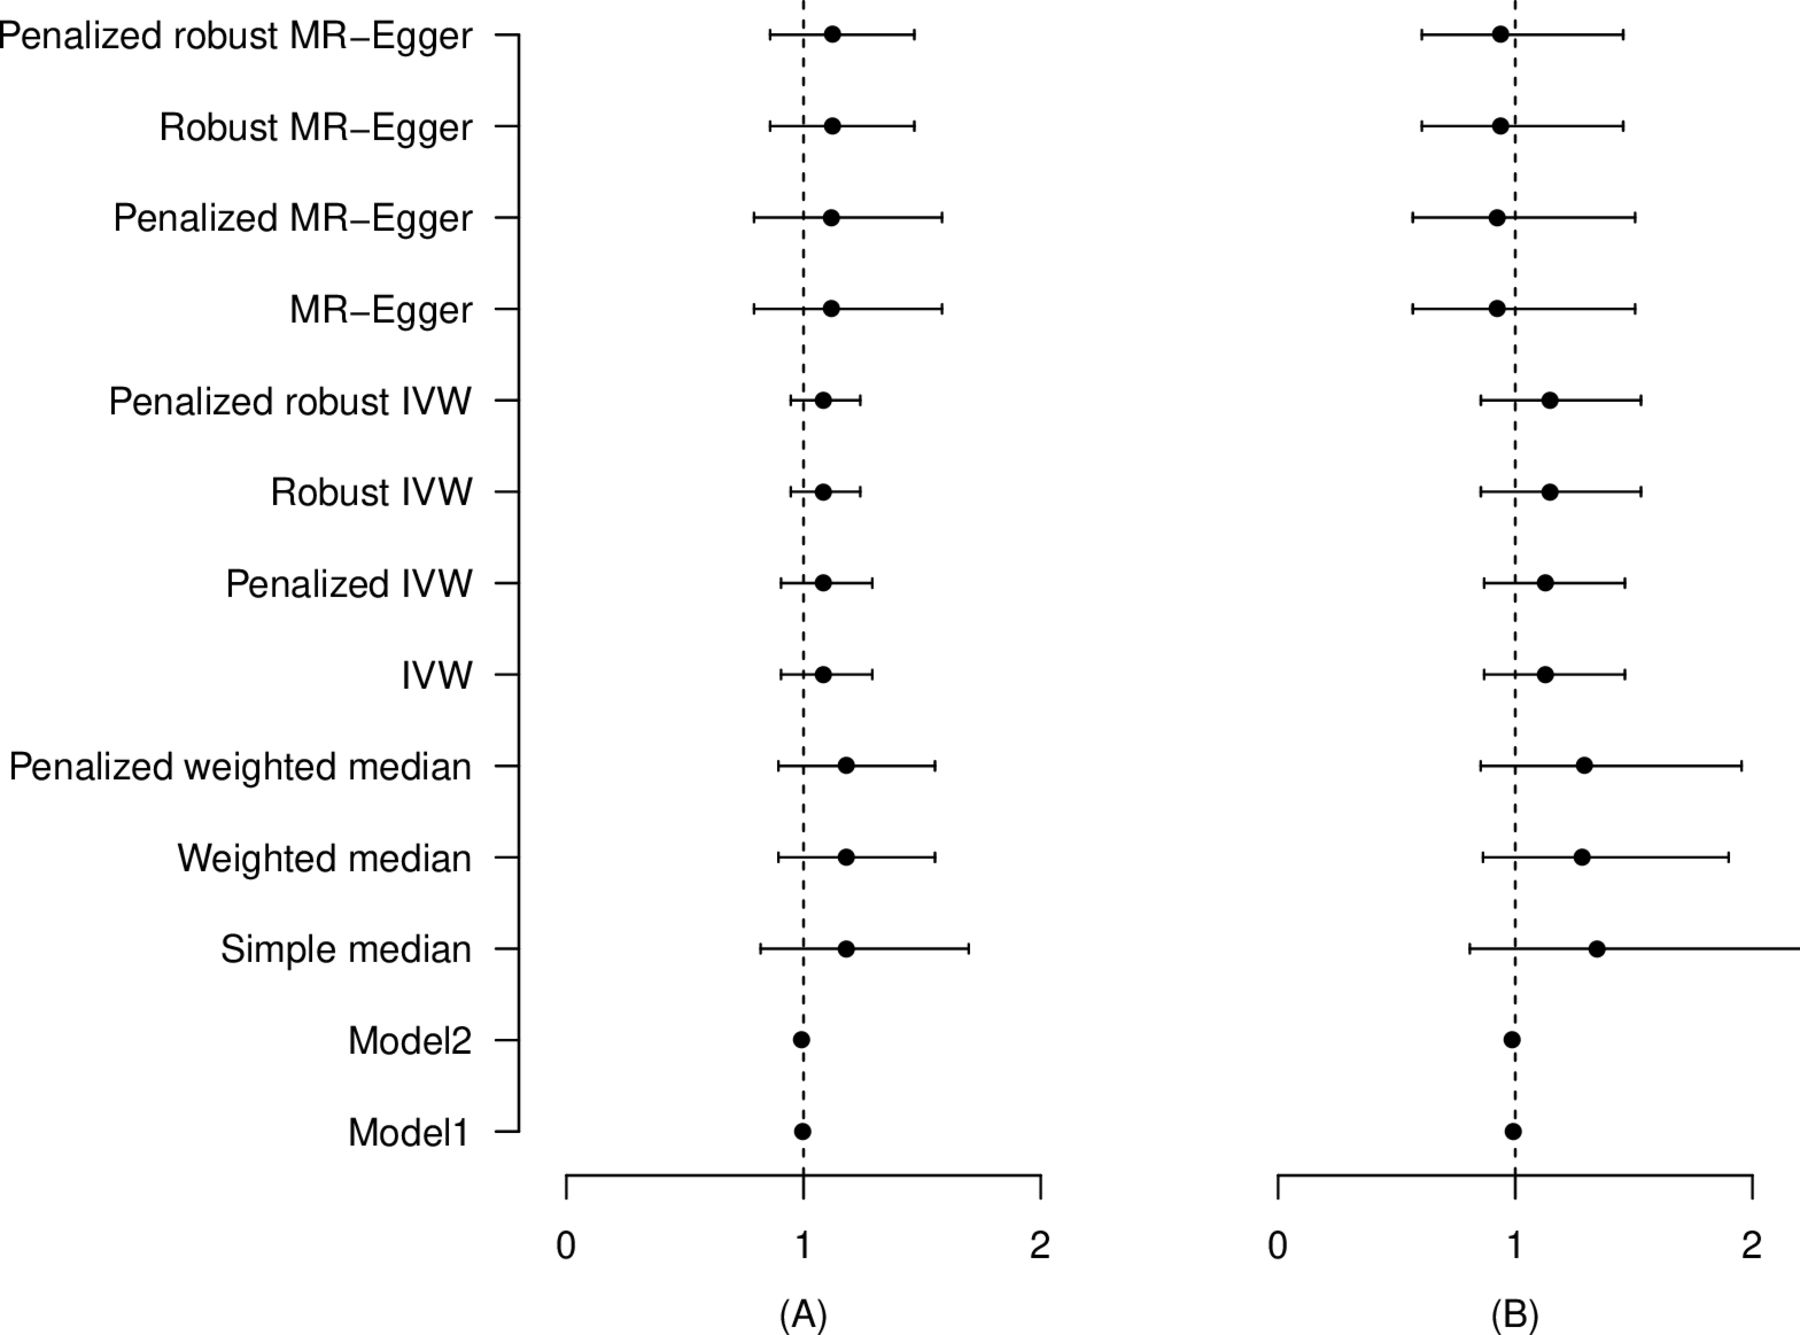
We further evaluated the causality between glycemic traits and incident CKD by MR analysis. As no genetic variant that has been identified to associate with 2-hour OGTT glucose and HbA1c in previous GWAS as well as in our cohort without pleiotropic effect, we could only conduct an MR analysis for fasting glucose, not for 2-hour OGTT glucose and HbA1c. As a result, fasting glucose tended to increase the risk of CKD after adjusting for age, sex, baseline eGFR, and cardiovascular risk factors, but the effect was not significant (figure 2A, online supplementary table 6). The OR per 1 SD increase calculated using the simple median method was 1.179 (95% CI 0.819 to 1.696, p=0.376), the IVW was 1.081 (95% CI 0.905 to 1.290, p=0.391), and the MR-Eger method was 1.119 (95% CI 0.791 to 1.584, p=0.526). In addition, the causal estimate of multivariate MR-IVW was calculated after adjusting for cardiovascular risk factors (eGFR, high BP, high TG, low HDL, and central obesity) as a fixed effect, but no significant difference was observed (OR per 1 SD increase, 1.101; 95% CI 0.866 to 1.400; p=0.433) (online supplementary table 6). Moreover, the MR analysis between fasting glucose and secondary outcome did not show a significant impact of fasting glucose on incident CKD in all methods (figure 2B, online supplementary table 6).
Mendelian randomization analysis for the effect of fasting glucose on incident CKD. (A) CKD defined as eGFR <60 mL/min/1.73 m2 and/or proteinuria ≥1+, (B) CKD defined as ≥30% decrease in eGFR to <60 mL/min/1.73 m2. CKD, chronic kidney disease; eGFR, estimated glomerular filtration rate; IVW, inverse-variance weighted; MR, Mendelian randomization.
Discussion
In this study, we demonstrated that fasting glucose was not associated with increased risk of CKD. When we further examined the relationship with presence of IFG or secondary outcome, there was still no significant association. Therefore, we further conducted MR analysis using genetic variants associated with fasting glucose. However, we found no causal relationship between fasting glucose and CKD development in this analysis.
Several previous studies evaluated the association between metabolic syndrome and incident CKD in population without diabetes.10–12 14–16 All of these studies showed that presence of metabolic syndrome was associated with increased risk of CKD. However, when evaluated with individual components of metabolic syndrome, studies showed conflicting results. In a large study conducted in 118 924 Taiwanese without diabetes, all components of metabolic syndrome, except IFG, were associated with a significantly higher risk of CKD.16 Furthermore, when they evaluated all combinations of metabolic syndrome components, combinations with fasting glucose were associated with lower risk of CKD than those with other components. Another previous studies conducted in Korea evaluated the relationship between metabolic syndrome traits and CKD development as time-varying covariates.15 Results showed that both baseline and time-varying IFGs were not associated with incident CKD. Other studies conducted in Western countries also showed no significant relationship between IFG and CKD12 13 17; however, large studies conducted in Japanese and American Indians showed that IFG is a significant risk factor of CKD.10 11 Recent meta-analysis conducted with the above studies reported that IFG is modestly associated with an increased risk of CKD (HR 1.11; 95% CI 1.02 to 1.21).19 In addition, another meta-analysis regarding the association between metabolic syndrome and CKD development also showed a similar result.42 However, the heterogeneities among included studies in both meta-analyses were quite high. Furthermore, recent post hoc analysis of a large randomized clinical trial (RCT), published after the meta-analysis, reported that IFG was not associated with worsening kidney function.18 In addition, in patients with CKD, pre-diabetes was associated with increased risk of CVD, but not with CKD progression.43
One may insist that progression of diabetic nephropathy has proceeding period of hyperfiltration, which is usually associated with pre-diabetes,44 and relatively short follow-up period can attenuate the significant relationship between IFG and CKD. However, our study clearly showed that there was no significant association between IFG and incident CKD after 10 years of follow-up. In addition, we also showed no significant tendency of diabetes incidence among GRS9 quartiles. Therefore, although we could not evaluate etiology of CKD, it can be assumed that the proportion of diabetic nephropathy in CKD events did not tend to increase in higher GRS9 quartiles. Furthermore, IFG is not usually presented alone and is a result of complex interactions among components of metabolic syndrome. Therefore, the relationship between IFG and CKD can vary depending on the degree of cardiovascular risk factor expressions that patients have. Accordingly, the relationship between IFG and CKD remains a controversial issue.
An MR analysis has been recently used as a method to identify the causal relationship between exposures and outcomes. Many candidate genes associated with several diseases have been identified by GWAS for decades. Because genetic variants such as SNPs are non-modifiable lifelong exposures, there is no concern about reverse causality between exposures and outcomes.45 Moreover, because genetic variants are randomly allocated during gamete formation, MR can minimize the effects of confounders as shown in RCTs. Therefore, MR analysis is a useful method for examining the effect of fasting glucose on CKD, because fasting glucose is highly affected by other cardiovascular risk factors. Moreover, there is a reverse causality that CKD is a risk factor of incident diabetes.46 Recently, one study conducted MR analysis to determine the causal relationship between type 2 diabetes and decreased renal function in 11 502 Chinese population.47 They reported that GRS associated with type 2 diabetes, insulin resistance, and insulin sensitivity had a significant relationship with decreased eGFR. However, that study included patients with diabetes and did not report that GRS was associated with fasting glucose. Therefore, it is hard to determine the effect of fasting glucose on CKD in non-diabetic population based on that study. Another recently published study evaluated the causal effects of cardiovascular risk factors on CKD by MR analysis.48 Result showed that genetically predicted high BP and low HDL cholesterol were associated with CKD, but low-density lipoprotein cholesterol, TG, HbA1c, and fasting glucose did not have any causal association with CKD. In consistent with this study, our MR analysis using various methods did not show that fasting glucose had a significant effect on incident CKD. In addition, results were not different when MR analysis was conducted with secondary outcome (≥30% to a value of <60 mL/min/1.73 m2). Therefore, IFG may not be a risk factor of incident CKD in non-diabetic population.
There are several limitations in this study. First, it is a baseline assumption of MR analysis that genetic variants should be associated with the exposure, but not with confounders. Although we made several efforts to satisfy this assumption, there may be hidden pleiotropic effects of the genetic variants we selected. Second, due to the limited numbers of participants and genetic loci, several SNPs that were previously reported to be associated with fasting glucose were not examined in this study.28 Therefore, further MR studies with larger cohorts are warranted to examine the relationship between glycemic traits and incident CKD. Third, several SNPs identified to be associated with fasting glucose in European population did not have significant relationship with fasting glucose in our cohort. Because of the differences in minor allele frequencies and their effects on exposures, our results may not be generalized to other ethnic groups. Finally, because we calculated eGFR only based on creatinine, there might be misclassification of CKD. However, results were not different when we conducted an analysis using a more strict definition of CKD (secondary outcome).
In conclusion, fasting glucose was not causally associated with incident CKD in Korean non-diabetic population. Additional large GWAS and MR studies are needed to confirm our findings.
References
Footnotes
HK and SP contributed equally.
Correction notice This article has been corrected since it was published. Equal contributorship was missing.
Contributors Study conception and design was collaboratively conducted by HN. Interpretation of data and statistical analyses were performed by HK, SP, and HN. The manuscript was written by HK, SP, SHK, JSJ, DCH, and HN. SHK, JSJ, DCH, and HN critically revised the manuscript for important intellectual content. All authors read and approved the final manuscript.
Funding This research was supported by Soon Chun Hyang University Research Fund (2020-0003).
Competing interests None declared.
Patient consent for publication Not required.
Ethics approval This study was approved by the Institutional Review Board of Soon Chun Hyang University Seoul Hospital (2018-12-006).
Provenance and peer review Not commissioned; externally peer reviewed.
Data availability statement Data may be obtained from a third party and are not publicly available. Korea Centers for Disease Control and Prevention prohibits data sharing at an individual level to guarantee the anonymity of the people in its databases.