Article Text

Abstract
Introduction For older adults with type 2 diabetes, the American Diabetes Association (ADA) Framework uses comorbidities and functional status to categorize patients by estimated life expectancy to guide individualization of glycemic treatment. We evaluated whether modifying the ADA Framework by removing three comorbidities and incorporating age could improve life expectancy stratification and better identify patients likely to benefit from intensive treatment.
Research design and methods We examined 3166 Health and Retirement Study participants aged ≥65 with diabetes from 1998 to 2004, using a prospective cohort design with mortality follow-up through 2016. We classified participants into one of three ADA Framework categories: Healthy, Intermediate Health, and Poor Health. We created modified categories by excluding comorbidities weakly associated with mortality (hypertension, arthritis, and incontinence). Using Gompertz regression, we estimated life expectancy across age strata for both original and modified ADA Framework categories.
Results The original ADA Framework classified 34% as Healthy (likely to benefit from intensive treatment), 50% as Intermediate Health, and 16% as Poor Health (unlikely to benefit from intensive treatment). Our comorbidity modification reclassified 20% of participants from Intermediate Health to Healthy. Using the modified ADA Framework, median life expectancy of the Healthy varied greatly by age (aged 65–69: 16.3 years; aged ≥80: 7.6 years), indicating differing likelihood of benefit. Additionally, age ≥80 made extended life expectancy unlikely (median life expectancy for Healthy 7.6 years, Intermediate Health 5.9 years, Poor Health 2.5 years), suggesting adults ≥80 are unlikely to benefit from intensive treatment.
Conclusions Modifying the ADA Framework by incorporating age and focusing on comorbidities associated with mortality improved life expectancy stratification, resulting in different treatment recommendations for many older adults.
- diabetes mellitus
- type 2
- epidemiology
- ageing
- life expectancy
This is an open access article distributed in accordance with the Creative Commons Attribution Non Commercial (CC BY-NC 4.0) license, which permits others to distribute, remix, adapt, build upon this work non-commercially, and license their derivative works on different terms, provided the original work is properly cited, appropriate credit is given, any changes made indicated, and the use is non-commercial. See: http://creativecommons.org/licenses/by-nc/4.0/.
Statistics from Altmetric.com
Significance of this study
What is already known about this subject?
The likelihood of benefit from intensive glycemic treatment is lower among older adults with shorter remaining life expectancy.
Age, comorbidities, cognition, and functional abilities all impact life expectancy.
The current American Diabetes Association (ADA) Framework for older adults gives treatment recommendations based on an individual’s likelihood of benefit and harm from intensive treatment, but it is unclear whether the Framework accurately stratifies older adults by life expectancy.
What are the new findings?
Removing three comorbidities weakly associated with mortality from the ADA Framework improves stratification by life expectancy.
Incorporating age into the ADA Framework resulted in substantially different life expectancy, suggesting different treatment recommendations by age are needed.
How might these results change the focus of research or clinical practice?
Modest modifications to the ADA Framework for older adults may improve individualization of diabetes treatment for millions of older adults.
Introduction
Older adults are the fastest growing segment of the population with type 2 diabetes.1 Treatment of diabetes in older adults is complex: this highly heterogeneous group requires individualized consideration of the potential benefits and harms from glycemic treatment.2–4 The benefit of intensive glycemic treatment is prevention of long-term complications, but these protective effects can take years to accrue, with a lag time to benefit of 8–10 years.5–7 In contrast, the harms of intensive glycemic treatment, primarily hypoglycemia and its associated risks, may be immediate. Thus, it is critically important to evaluate remaining life expectancy when weighing the benefits and risks of glycemic treatment for older adults.5 8 For some older adults, the lag time to benefit may extend beyond their remaining life expectancy, resulting in unlikely benefit from treatment while exposing them to potential harms, including hypoglycemia. On the other hand, healthy older adults may live for another 15–20 years, leaving them ample time to benefit from intensive glycemic treatment. Thus, accurate estimates of remaining life expectancy are crucial for individualizing glycemic treatment for older adults with diabetes.
To assist clinicians in determining the appropriate intensity of glycemic treatment for older adults, the American Diabetes Association (ADA) Framework classifies older adults into three categories corresponding to their remaining life expectancy: Healthy, Intermediate/Complex Health, and Very Complex/Poor Health.4 Each group has different treatment goals for blood pressure, statin use, and glycemia, with hemoglobin A1c (HbA1c) goals of <7.5% for Healthy, <8.0% for Intermediate/Complex Health, and <8.5% for Very Complex/Poor Health. These HbA1c goals are based primarily on expert opinion. The categories are assigned using a combination of comorbidities, cognitive abilities, and functional status, as suggested by prior literature.9 10 Life expectancy is explicitly named as the rationale for each category: the Healthy group has ‘longer remaining life expectancy’, while for the Poor Health group, ‘limited remaining life expectancy [making] benefit uncertain’.4
However, there has been no validation of the ADA Framework’s classification by life expectancy: the median life expectancy of each group is unknown. It is thus unclear how effectively the ADA Framework stratifies older adults into categories that correspond to the likelihood of benefit from glycemic treatment. Of note, while age strongly influences estimated life expectancy, the current ADA Framework does not explicitly incorporate age in its classification system.
We sought to validate the ADA Framework’s classification by life expectancy using the Health and Retirement Study (HRS), a nationally representative study of US adults. A priori, we hypothesized that focusing on comorbidities associated with mortality (and ignoring comorbidities not strongly associated with mortality) and accounting for age would improve stratification by life expectancy. Specifically, we modified the ADA Framework by: (1) removing three common comorbidities that are weakly associated with life expectancy (arthritis, hypertension, and incontinence) and (2) stratifying by 5-year age categories. For the original ADA Framework and the modified comorbidity framework, we calculated the percent of older adults in the USA who would be classified as Healthy (likely to benefit from intensive glycemic treatment, target HbA1c <7.5%), Intermediate Health (possible benefit from intensive glycemic treatment, target HbA1c <8.0%), and Poor Health (unlikely to benefit from intensive glycemic treatment, target HbA1c <8.5%). We also calculated the median, 25th and 75th percentiles of life expectancy for each group.
Methods
Study population
The Health and Retirement Study (HRS) is an ongoing, prospective cohort study that is nationally representative of adults aged 50 and over in the USA.11 It began in 1992, and participants are recruited in waves to maintain population representativeness over time. Participants are interviewed every 2 years, with active follow-up through regular mail contact and phone interviews. Mortality is ascertained through active follow-up with participants and proxies.
Of the 26 121 HRS participants in waves 1998–2004, we restricted to 15 535 participants aged ≥65 years, and further limited to 3401 participants with a self-report of diabetes. We included participants at their first instance of having both diabetes and age ≥65, with relevant covariates taken from that wave. We excluded participants who were institutionalized (living in a nursing home) during the 1998 wave (n=90) or were missing from the 1998 wave (n=145), for a final sample size of 3166. Follow-up was complete for all-cause mortality through 2016.
ADA Framework categories
We adhered as closely as possible to the ADA Framework outlined in table 12.1 in the ADA Standards of Medical Care (online supplemental table S1).4 The Very Complex/Poor Health category (hereafter, ‘Poor Health’) was defined by the presence of any terminal diagnosis, dementia, or ≥2 activity of daily living (ADL) dependencies. The Complex/Intermediate Health (‘Intermediate Health’) category was defined by ≥3 comorbidities, ≥2 impairments in instrumental activities of daily living (IADLs), or mild cognitive impairment. The Healthy group was defined as <3 comorbidities, intact cognitive function, <2 IADL impairments, and <2 ADL dependencies.
Supplemental material
To categorize HRS participants by the ADA Framework, we used self-reported diseases, functional status, and cognitive data from HRS interviews. We used comorbidities that were specifically listed in the ADA Framework, including: lung disease, stroke, myocardial infarction, congestive heart failure, heart procedures or surgeries, cancer, kidney disease, psychiatric disease, hypertension, arthritis, incontinence, and falls. Incontinence was defined as a self-report of ≥15 days/month of leaking urine.12 Falls included any fall in the past 2 years. Terminal diagnoses included lung disease requiring oxygen, dialysis, and metastasized cancer (metastasized cancer not asked in 2004). All comorbidities and terminal diagnoses were ascertained at core interviews with the exception of dialysis, which was ascertained from exit interviews with a proxy that occurred following a participant’s death. Cognitive status (normal, cognitive impairment without dementia, dementia) was defined using the Langa-Weir dementia classification.13 Impairment in IADLs was defined as a response of ‘any difficulty’ or ‘can’t do’ to questions regarding the participant’s ability to shop for groceries, prepare hot meals, manage money, make phone calls, and take medications. Dependency in ADLs was defined as a response of ‘can’t do’ or ‘gets help’ for questions on a participant’s ability to independently dress, bath, eat, use the toilet, or get in and out of bed.
Statistical analysis
We first examined the baseline characteristics of HRS participants, stratified by original ADA categories (Healthy, Intermediate Health, and Poor Health) using χ2 and t-tests to identify differences across groups. After calculating the proportion of participants in each original ADA category, we applied the modified ADA categorization criteria (removing hypertension, arthritis, and incontinence) and again calculated the proportion of participants in the Healthy, Intermediate Health, and Poor Health categories, both overall and stratified by 5-year age groups (65–69, 70–74, 75–79, 80+).
To evaluate the utility of the ADA Framework in stratifying older adults by life expectancy, our analytical goal was to calculate the 25th, 50th, and 75th percentiles of observed remaining life expectancy within each ADA Framework category. We compared the median remaining life expectancy to the expected time to benefit from intensive glycemic treatment (8–10 years).5–7 Initially, we used Kaplan-Meier curves to examine the 25th, 50th, and 75th percentiles of survival time (remaining life expectancy) for each ADA Framework category. However, because the 75th percentile of life expectancy for the Healthy groups extended beyond the follow-up time in our data, we decided to use Gompertz regression to enable the projection of the 75th percentile of life expectancy. Gompertz regression is a parametric survival model widely used in demography to model life expectancy because its shape fits the observed doubling of mortality rate with every decade of life.14 To ensure an appropriate model fit, we compared the modeled percentiles from the Gompertz regression to the Kaplan-Meier estimates. We stratified the models by ADA category owing to an observed difference in the shape parameter gamma across the ADA categories, which resulted in a poor correlation between the Kaplan-Meier percentile estimates and the Gompertz percentile estimates for the Poor Health group. Our results report the 25th, 50th, and 75th percentiles of observed remaining life expectancy from the Gompertz survival models, both overall and by 5-year age groups, stratified on ADA categories.
All analyses accounted for non-response and the complex survey design of HRS, using weights from the 1998 wave in Stata/SE v15.1 (College Station, TX: StataCorp LLC).
Results
There were 3166 HRS participants aged ≥65 with diabetes. Almost three-quarters died (2301 deaths) during a median follow-up time of 10.0 years. The mean age was 72.8, 52.7% were female, 83.4% were non-Hispanic white and 12.6% were non-Hispanic black (table 1). 24.6% of participants did not take any diabetes medications, while 57.1% used oral medications only and 18.3% used insulin. The most common comorbidities were hypertension (69.2%) and arthritis (69.0%). Only 3.5% had a terminal disease, and 9.5% had dementia. Few participants had dependence in two or more ADLs (6.1%), while 14.9% had difficulty in two or more IADLs.
Baseline characteristics of HRS participants aged ≥65 with diabetes, by ADA Framework categories, n=3166
Using the original ADA Framework categories, 33.6% of participants were categorized as Healthy, 50.0% as Intermediate Health, and 16.4% as Poor Health. As expected, participant characteristics differed substantially across categories (table 1). Notably, participants with Poor Health were more likely to be black (21.7% vs 8.4% black in the Healthy, p<0.001) and to use insulin (29.2% vs 14.4% in the Healthy, p<0.001).
Modifying the ADA Framework criteria by excluding arthritis, hypertension, and incontinence reclassified 20% of older adults from Intermediate Health to Healthy. This resulted in 53.6% classified as Healthy, 30.0% classified as Intermediate Health, and 16.4% (unchanged) in Poor Health.
Stratifying by age found that older participants were more likely to be classified as Poor Health (28.0% in ages 80+ vs 11.7% in ages 65–69, p<0.001) (figure 1). Additionally, applying the modified ADA Framework reclassified a larger proportion of younger versus older participants from Intermediate Health to Healthy (23.3% reclassified in ages 65–69 vs 14.1% reclassified in ages 80+).
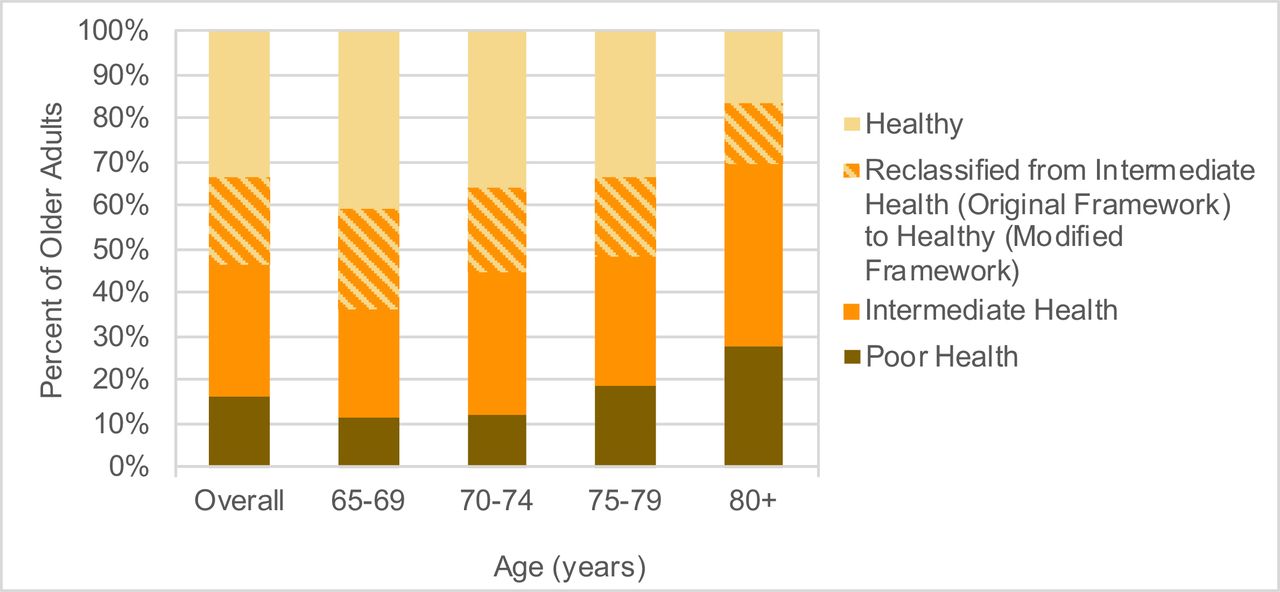
Percent of US adults aged 65+ meeting original and modified American Diabetes Association (ADA) criteria, overall and by age group.
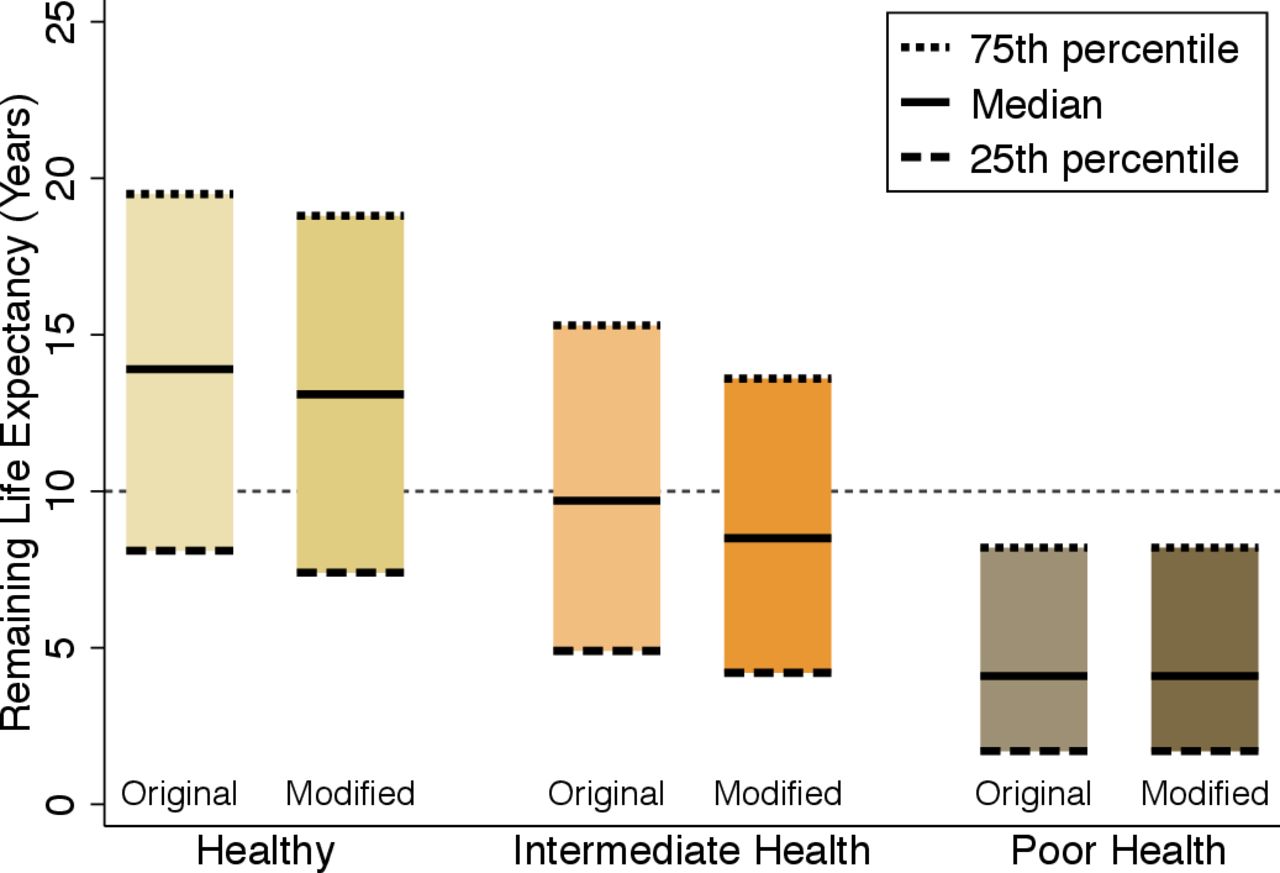
Using the modified ADA Framework changed the median life expectancy of the Healthy and Intermediate Health groups, making the Intermediate Health group have a slightly shorter life expectancy that was better aligned with the 8–10 years’ time frame for possible benefit from intensive glycemic treatment (figure 2). The median life expectancy in the Intermediate Health group was 9.7 years (95% CI 9.3 to 10.2) in the original ADA Framework and 8.5 years (95% CI 7.9 to 9.0) in the modified ADA Framework. The median life expectancy of the Healthy group changed slightly but was still aligned with the high likelihood of benefit from intensive treatment (original ADA Framework, 13.9 years (95% CI 13.3 to 14.5); modified ADA Framework, 13.1 years (95% CI 12.6 to 13.7)).
IQR and median life expectancy, by original and modified American Diabetes Association (ADA) categories.
Older age was associated with substantially shorter life expectancy. Using age stratification combined with the modified ADA Framework categories resulted in more specific estimates of life expectancy that could improve individualization of treatment for older adults with type 2 diabetes, indicated by color coding in table 2. Green indicates a median life expectancy ≥11 years and likely benefit from intensive glycemic treatment (Healthy aged 65–74). Yellow indicates intermediate life expectancy (8–10 years) with possible benefit from intensive glycemic treatment (Intermediate Health aged 65–79 and Healthy aged 75–79). Red indicates median life expectancy <8 years, with unlikely benefit (Poor Health all ages, Healthy and Intermediate Health aged 80+). The Gompertz models were well fit, showing no deviations from the Kaplan-Meier curves (online supplemental figure S1).
Median remaining life expectancy (25th, 75th percentiles) by modified ADA Framework and age categories
Using age stratification with the original ADA Framework found that Intermediate Health adults aged 65–69 had a median life expectancy of 12.2 years (95% CI 11.4 to 13.1), beyond the 10-year threshold indicating likely benefit from intensive glycemic treatment (online supplemental table S2). With the modified ADA Framework, Intermediate Health adults aged 65–69 had a median life expectancy of 10.5 years (95% CI 9.5 to 11.5), better aligned with the 8–10 years’ timeframe for possible benefit from intensive glycemic treatment. Across all age groups, individuals who were reclassified from Intermediate Health to Healthy had life expectancies that were more similar to the Healthy group (online supplemental figure S2).
With the new proposed approach using age and the modified ADA Framework categories, 38.8% of older adults were classified as likely to benefit from intensive treatment (green), 33.4% as possible benefit (yellow), and 27.8% as unlikely to benefit (red). In comparison to the original ADA Framework, this is a slightly larger number of people for whom intensive glycemic treatment is likely beneficial (38.8% vs 33.6%), a smaller number for whom intensive treatment is possibly beneficial (33.4% vs 50.0%), and a larger number for whom intensive treatment is unlikely to benefit (27.8% vs 16.4%).
Discussion
Our study was the first to validate the ADA Framework for older adults, evaluating whether the ADA Framework defined life expectancy categories that are clinically useful for individualizing glycemic treatment. Using a nationally representative data set, we demonstrated that modifications to the current ADA Framework resulted in improved stratification on life expectancy that better corresponded to the timeframe for benefit for intensive glycemic treatment. Modifying the ADA Framework by removing three common comorbidities resulted in an Intermediate Health group that had appropriately shorter life expectancies (8.5 years vs 9.7 years) and captured only 30% of the older adult population with diabetes, instead of 50%. Similarly, stratifying by age within the ADA Framework categories found dramatically different life expectancies that correspond to different likelihoods of benefit from intensive glycemic treatment. Combined, these modifications resulted in a greater proportion of older adults being in either the most likely or least likely to benefit categories compared with the current ADA Framework. These changes could lead to improvement of clinical decision-making around glycemic treatment goals for millions of older adults with type 2 diabetes.
Previous studies categorizing older adults with diabetes focused on 5-year mortality risk rather than life expectancy.10 15 Five-year mortality risk provides the percent that will die in 5 years, but does not give useful information beyond 5 years, which is the timeframe for benefit of intensive glycemic control. Additionally, life expectancy is better for clinical decision-making because it provides a projected timeframe for that individual, whereas risk gives the chance of death at a certain time.8 Thus, life expectancy is a more natural, individual-level concept that is easier to interpret for patients and clinicians alike. Comparing estimated life expectancy to the time needed to benefit from a preventative treatment is a well-established method to assess the potential for benefit for an individual.5 6 16–18
Our results found substantial heterogeneity in remaining life expectancy within each age-stratified ADA category, as demonstrated by a nearly 10-year spread between many of the 25th and 75th percentiles. For example, among those aged 70–74 with Intermediate Health, the median life expectancy was 8.9 years, but 25% lived ≤4.5 years and 25% lived ≥14.0 years. While our modifications improved the correlation between the median life expectancy and the timeframe for benefit, our modifications did not change the width of the 25th and 75th percentiles. Future research should determine if other methods of estimating life expectancy can narrow the 25th and 75th percentiles. Thus, while our work refines the ADA Framework, it reinforces the central recommendation that glycemic treatment decisions must be individualized and that any framework is a starting point for decision-making discussions, not a directive that all patients and clinicians must follow.
In evaluating the clinical utility of life expectancy categories, we relied on the assumption that the lag time to benefit for intensive glycemic treatment was 8–10 years.5–7 However, others have proposed that glycemic treatment may require only 5 years to provide clinically meaningful benefits.19 20 Specifically, subclinical microvascular benefits are seen within 3–5 years,21–23 but the prevention of outcomes that meaningfully impact a patient’s quality of life takes substantially longer.24 25 Importantly, it is likely that an individual’s baseline health state, including their duration of diabetes, influences their time to benefit.20 26 Unfortunately, there are very limited data on time to benefit in many subgroups of older adults, including those ≥80 years, with dementia, or with frailty. It is critical to communicate this uncertainty during shared decision-making conversations around glycemic treatment.
It is also important to note that the ADA Framework also seeks to identify older adults at high hypoglycemia risk who may benefit from less intensive treatment. We did not consider hypoglycemia risk in our evaluation of the ADA Framework; separate hypoglycemia risk assessments have been developed.27–29 While many risk factors for mortality30–32 and hypoglycemia33 34 overlap, future studies should examine whether separate or combined calculators for life expectancy and risk of hypoglycemia would improve the individualization of glycemic treatment.
Overall, the ADA Framework provides structure and rationale to assist clinicians in treatment decisions for older adults with diabetes. Thus, the ADA Framework is not meant to be prescriptive, but should be used as a flexible guide that incorporates a patient’s values into a preference-concordant care plan. Regardless of an individual’s health status, it is important to use shared decision-making and elicit patient preferences to understand their own health goals, whether it is preserving mobility, avoiding hypoglycemia, or preventing advanced complications.35 While there is certainly room to improve the ADA Framework (and the similar guidelines from the Endocrine Society36), we believe these guidelines are critical to improve diabetes treatment, as many adults in poor health continue to have aggressive glycemic treatment, putting them at high risk of hypoglycemia.
Our study has several limitations. First, we were only able to incorporate diseases that HRS recorded, and thus we may have missed rare diseases that could have a large impact on life expectancy. Second, for Healthy, younger participants, fewer than 75% died and so the 75th percentile of life expectancy is an extrapolation from the Gompertz model. Finally, HRS is representative of the USA and it is not clear whether our results would be generalizable to ageing populations in other nations.
Our study also has noteworthy strengths. First, to our knowledge, we are the first to evaluate the validity of the ADA Framework in stratifying older adults by life expectancy. Second, we proposed easily incorporated modifications to the ADA Framework that resulted in substantial improvements to life expectancy prediction and thus individualization of glycemic treatment goals. Third, we used a nationally representative cohort with a long follow-up in which approximately three-quarters of participants died, enabling accurate predictions of life expectancy.
In summary, our study supports modifying the ADA Framework by removing arthritis, hypertension, and urinary incontinence from the considered comorbidities and stratifying by 5-year age groups. In our study, these modifications resulted in improved stratification on life expectancy that better corresponded to the timeframe for benefit for intensive glycemic treatment. These modifications also reduced the number of older adults for whom the benefits and harms of treatment are equivocal. In the future, the framework for older adults could be improved on by including performance-based measures such as gait speed and frailty, as performance-based measures strongly predict mortality37 38 and may be more sensitive to early declines in physical health than ADLs and IADLs.39 Future studies should validate the ADA Framework in populations outside the USA and better understand how life expectancy tools are used in shared decision-making for diabetes treatment in older adults.
Acknowledgments
The Health and Retirement Study (HRS) is sponsored by the National Institute on Aging (grant number NIA U01AG009740) and is conducted by the University of Michigan.
References
Footnotes
Contributors AKL developed the research question, analyzed the data, and drafted the manuscript. MAS and SJL interpreted the data and revised the manuscript for critical intellectual content. AKL is the guarantor of this work and takes full responsibility for the content of the article.
Funding AKL was supported by NIH/NIA grant T32AG000212. MAS was supported by NIH/NIA grants K24AG049057, P30AG044281, and R24AG064025. SJL was supported by NIH/NIA grants R01AG047897, R01AG057751, and VA HSR&D grant IIR 15-434.
Competing interests AKL, MAS, and SJL report grants from the National Institute on Aging during the conduct of this study.
Patient consent for publication Not required.
Provenance and peer review Not commissioned; externally peer reviewed.
Data availability statement Data are available in a public, open access repository. The Health and Retirement Study is a publicly available data set; registered users may download data on: http://hrsonline.isr.umich.edu.