Article Text

Abstract
Introduction We aimed to test whether the serum adipokines leptin and adiponectin are more strongly associated with body fat percentage (BF%) than body mass index (BMI) in adolescents with type 1 diabetes (T1D) and overweight/obesity.
Research design and methods We studied all participants in the T1D Exchange Metformin Study (n=122, median age 12.9 years, range 12–19.5; 32% males; 77% non-Hispanic whites, 100% overweight or obesity; median diabetes duration 6.7 years, range 1.4–15) with a baseline serum sample where we measured leptin and adiponectin concentrations. Anthropometric, clinical, laboratory and dual-energy X-ray absorptiometry (DEXA) scan measurements were analyzed. We compared correlation coefficients between variables of interest.
Results BF% by DEXA was significantly correlated with BMI Z-score (r=0.38, p<0.0001), BMI per cent of the 95th percentile (BMI%95) (r=0.45, p<0.0001), waist circumference (r=0.46, p<0.0001), leptin (r=0.58, p<0.00001) and leptin/adiponectin ratio (r=0.36, p<0.0001), while it was not significantly correlated with absolute body weight, adiponectin or insulin dose (total or basal). BF% was significantly more strongly correlated with leptin than with BMI Z-score in the overall group (p=0.022). However, there were sex-based differences. Among the significant correlations in the overall group, BF% was most strongly associated with leptin (r=0.75) in boys (n=39) but with waist circumference (r=0.58) in girls (n=83) (all p<0.0001).
Conclusions Serum leptin could be used as a surrogate convenient marker of adiposity in overweight/obese adolescent boys with T1D, equivalent to BMI Z-score or BMI%95. In girls, waist circumference was the best performing marker overall, and was also strongly correlated with %BF in boys.
- diabetes mellitus
- type 1
- obesity
- adipokines
- leptin
This is an open access article distributed in accordance with the Creative Commons Attribution Non Commercial (CC BY-NC 4.0) license, which permits others to distribute, remix, adapt, build upon this work non-commercially, and license their derivative works on different terms, provided the original work is properly cited, appropriate credit is given, any changes made indicated, and the use is non-commercial. See: http://creativecommons.org/licenses/by-nc/4.0/.
Statistics from Altmetric.com
Significance of this study
What is already known about this subject?
Obesity is an important comorbidity in type 1 diabetes (T1D) but its assessment is challenging.
Measures of body composition are not widely available in clinical practice or large research studies.
Anthropometric measures are imperfect correlates and often are not available.
Adipokines are proteins secreted by the adipose tissue that regulate obesity-induced inflammation and can be measured in serum or plasma.
Whether serum adipokines could be used as convenient, surrogate markers of adiposity in obese/overweight adolescents with T1D is not known.
What are the new findings?
Body fat percentage (BF%) was significantly more strongly correlated with leptin than with body mass index Z-score in the overall group.
Leptin was the marker most strongly associated with BF% in boys.
Waist circumference was the marker, among those that were statistically correlated in the overall group, most strongly associated with BF% in girls.
How might these results change the focus of research or clinical practice?
Serum leptin could be used as a surrogate convenient marker of adiposity in overweight/obese adolescent boys with T1D.
Waist circumference seems the best marker for %BF in girls and was also strongly correlated with %BF in boys.
The sex bias in the relationship between adipokines and BF% warrants further studies.
Introduction
Obesity is a comorbidity in 30%–40% of US youth with type 1 diabetes (T1D).1 Obesity is associated with higher prevalence of cardiovascular risk markers among children with T1D possibly through adiposity-induced chronic inflammation.2 Visceral fat accumulation specifically has been linked to an increased risk of diabetes and cardiovascular disease.3 However, body composition measurements are difficult to obtain in both community research and clinical settings. While obesity is defined on the basis of body mass index (BMI) values, BMI is an imperfect measure of adiposity.4 Furthermore, obtaining anthropometric values necessary for BMI calculations is often challenging in the research setting.
Adipokines are proteins secreted by the adipose tissue that regulate obesity-induced inflammation and can be measured in serum or plasma. Pro-inflammatory adipokines include leptin, while adiponectin has anti-inflammatory actions. We previously showed among children with new-onset T1D, those with obesity had significantly higher serum leptin and lower adiponectin compared with the children who were lean.5 However, whether adipokines can be used as a surrogate marker of adiposity in adolescents with T1D has not been evaluated. Therefore, we aimed to test the hypothesis that leptin and adiponectin are more strongly associated with body fat percentage (BF%) than BMI in adolescents with T1D and overweight/obesity. If our hypothesis is true, serum adipokine levels could be used instead of BMI as a more convenient marker of obesity in both clinical and research settings, perhaps both as a diagnostic tool and a therapeutic target to improve clinical outcomes in individuals with T1D and obesity.
Methods
Participants
The T1D Exchange Metformin Study6 assessed the efficacy and safety of metformin as an adjunct to insulin in treating obese/overweight adolescents with T1D. T1D was defined based on continuous use of exogenous insulin with either an age of diagnosis <10 years of age or positive islet cell antibodies. A total of 140 youth aged 12 to <20 years, with T1D for at least 1 year and BMI ≥85th percentile participated in this randomized controlled trial. They were recruited across 26 clinical sites of the T1D Exchange Clinic Network. In this analysis, we included all the participants in both arms, metformin and control, who had a baseline serum sample (n=122).
Procedures
Participants in the T1D Exchange Metformin Study underwent extensive characterization including anthropometric and clinical measurements (height, weight, waist circumference, blood pressure), laboratory measurements (eg, lipid levels, liver enzymes, C-peptide and a panel of adipokines, cytokines and other inflammatory markers) and imaging test (dual-energy X-ray absorptiometry (DEXA) scan), as previously published.6 Of note, the adipokine panel did not include leptin. All registry study materials have been reviewed and approved by Western IRB (Olympia, Washington, USA).
Laboratory tests
Serum from all available subjects who provided biological samples at baseline (randomization) (n=122) was obtained from the T1D Exchange. The samples were obtained in fasting conditions between October 2013 and February 2014, and stored in frozen at −80C for an average of 5 years until they were assayed. Leptin and adiponectin levels were measured using Milliplex Human adipocyte magnetic bead assay which has an inter-assay and intra-assay coefficient of variation <10%.
Statistical analysis
We used descriptive statistics to summarize characteristics in the overall cohort as well as by group. Chi-square tests were used to compare proportions among groups. Continuous measures were compared between groups using t-tests. Correlation coefficients were calculated between variables of interest, and then compared using computer software available from http://quantpsy.org.7 We used weight, height, age and gender collected from the registry to calculate BMI (weight in kg/height in m2) and the BMI Z-score based on the Center for Disease Control standards (https://www.cdc.gov/growthcharts/zscore.htm). We also calculated BMI per cent of the 95th percentile (BMI%95) as the subject’s BMI for age and gender divided by the BMI equal to the 95th percentile for their age and gender ((https://www.cdc.gov/growthcharts/percentile_data_files.htm) and multiplied by 100 (subject’s BMI/BMI at the 95th percentile×100). BMI%95 has been shown in other studies to better represent weight abnormalities in the severely obese.8 All tests were two-tailed. P values <0.05 were considered to be statistically significant.
Results
We analyzed serum leptin and adiponectin in 122 adolescents (median age 12.9 years, range 12–19.5; 32% males; 77% non-Hispanic whites) with overweight/obesity and T1D who participated in the T1D Exchange Metformin Study. Their median duration of diabetes was 6.7 years (range 1.4–15), mean BMI Z-score was 2.03 (SD 0.79), mean BMI%95 was 117.6% (SD 23.2) and mean BF% by DEXA scan was 37.4% (SD 7.83). Median (IQR) serum leptin and adiponectin were, respectively, 8316 (4832–14177) pg/mL and 18.1 (12.7–30.7) µg/mL. Other baseline characteristics are illustrated in table 1.
Baseline characteristics of study participants
We found that the BF% by DEXA in these adolescents with overweight/obesity and T1D was significantly correlated with BMI Z-score (r=0.38, p<0.0001), BMI%95 (r=0.45, p<0.0001), waist circumference (r=0.46, p<0.0001), leptin (r=0.58, p<0.00001) and leptin/adiponectin ratio (r=0.36, p<0.0001), while it was not significantly correlated with absolute body weight, adiponectin or insulin dose (total or basal) (table 2).
Correlation between percentage of body fat by DEXA and markers of adiposity in overweight and obese adolescents with type 1 diabetes
Next, we compared the strength of the correlation between BF% and each of the obesity measures that were significantly correlated with it. We observed that BF% was significantly more strongly correlated with leptin than with BMI Z-score (p=0.022) or leptin/adiponectin ratio (p=0.001). On the other hand, the strength of the correlation between BF% and leptin was not significantly different than those of BF% with each of BMI%95 (p=0.11) or waist circumference (p=0.17).
Girls had a higher mean BF% (40.3%, SD 5.41) compared with boys (31.4%, SD 8.6, p<0.00001). We did not find any significant association between BF% and age (p=0.88) or race/ethnicity (p=0.95). There were sex-based differences in the relationships between BF% and each of the remaining obesity measures (table 3).
Correlations between body fat percentage (BF%) by DEXA and markers of adiposity in overweight and obese by sex
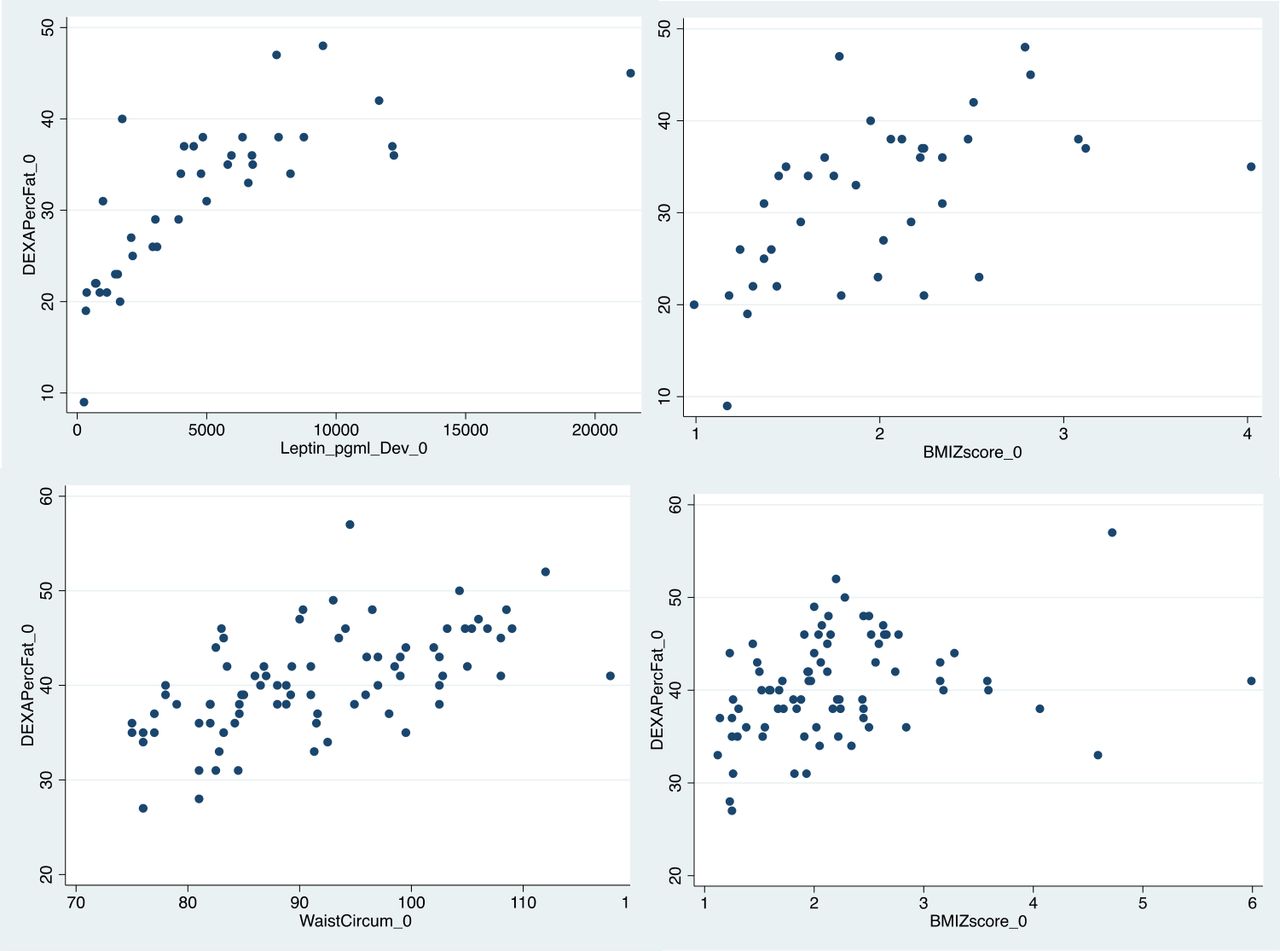
In boys (n=39), the correlation coefficient between BF% and leptin (r=0.75) tended to be stronger than that between BF% and BMI-Z score (r=0.55; p=0.071 for the comparison between the two correlation coefficients) (figure 1, panels A and B). Similarly, the correlation between BF% and leptin (r=0.75) tended to be stronger than BF% and BMI%95 (r=0.57; p=0.063 for the comparison between correlation coefficients). The correlation between BF% and leptin (r=0.75) was statistically stronger than those between BF% and waist circumference (r=0.52; p=0.027) and ratio of leptin/adiponectin (r=0.32; p<0.0001). In girls (n=83), the strength of the correlations between BF% and each of weight (r=0.60) and waist circumference (r=0.58) were not statistically different (p=0.77), but weight was not statistically correlated with BF% in the overall group (table 2). The correlation between BF% and waist circumference (r=0.58) was statistically stronger than those of BF% and leptin (r=0.32, p=0.025) and BF% and BMI Z-score (r=0.30, p=0.01) (figure 1, panels C and D), but not statistically stronger than that of BF% with BMI%95 (r=0.43; p=0.13).
Body fat percentage (BF%) is more strongly correlated with serum leptin (r=0.75, p=0.00001, panel A) than with body mass index (BMI) Z-score (r=0.55, p=0.0003, panel B) in boys (n=39, p=0.07), while it is more strongly correlated with waist circumference (r=0.58, p=0.0001, panel C) than with BMI Z-score (r=0.30, p=0.006, panel D) in girls (n=83, p=0.01). DEXA, dual-energy X-ray absorptiometry.
Discussion
The goal of this project was to test whether a serum marker (ie, leptin, adiponectin) could be used as a measure of BF% instead of BMI Z-score, percentile or waist circumference. We observed that leptin and BF% are statistically and strongly correlated and thus, leptin could be an adequate marker of BF% in overweight/obese adolescent boys with T1D. Furthermore, we observed a trend for BF% being more strongly correlated with leptin than with BMI Z-score or BMI%95; therefore, serum leptin could be used as a convenient marker of adiposity in overweight/obese adolescent boys with T1D, certainly not worse than BMI Z-score or BMI%95, and possibly more accurate reflection of BF% (figure 1). In boys, serum leptin was more strongly correlated with BF% than waist circumference or the leptin/adiponectin ratio. Height and weight are in dynamic flux during the growth spurt years of adolescence and BMI calculation uses total weight (bone, muscle, fat, connective tissue, etc). Individual differences in growth velocity, bone lengthening, muscle mass, etc, during the growing phase could affect the correlation between BMI and body fat. In contrast, leptin is secreted by fat cells, which can explain why its levels correlate better with body fat than BMI.
Many research studies performed in community settings do not obtain anthropometric data and thus secondary analyses of their outcomes with measures of obesity are not possible. On the other hand, serum is often available from these studies that thus allow researchers to measure metabolites such as adipokines. Our study shows that serum leptin can be used as a marker of adiposity in overweight/obese adolescent boys with T1D, which will facilitate these studies. Further research on the relationship of leptin with outcomes of interest such as insulin resistance and cardiovascular disease is needed to understand if serum leptin could be advantageous over anthropometric markers of adiposity for diagnosis and as a therapeutic target in the clinical setting, where height and weight are usually available.
In girls, out of the measures that were statistically correlated with BF% in the overall group, waist circumference was the best performing, and was more strongly correlated with BF% than BMI Z-score (figure 1, panels C and D) and leptin. While in the overall cohort of boys and girls leptin was strongly correlated with adiposity, and the relationship was statistically significant in each of the male and female groups, the strength was relatively weak in girls. Therefore, serum leptin, although convenient, may not reflect adiposity better than anthropometric measures in studies that include adolescent girls. Since it is often necessary to evaluate the same variable in males and females, waist circumference was the measure that performed best separately in boys and girls, and, after leptin, also in the combined group.
There are several studies showing that the leptin/adiponectin ratio is an emerging biomarker to measure insulin resistance.9 In our study, leptin/adiponectin ratio was statistically correlated with BF% in the overall cohort but the stratified analysis indicated that this held true in boys but not in girls.
The reason for the different performance of leptin as a marker of adiposity between boys and girls is unclear. A previous study in children with obesity showed higher levels of leptin in otherwise healthy children with obesity compared with lean.10 In our data, although girls had higher percentage of body fat and narrower range (mean 40.3%, SD 5.4) than boys (mean 31.4%, SD 8.6), the correlation between leptin and adiposity was not strong. A potential explanation is the narrower range of BF% in girls than boys in our data. Supporting this hypothesis, in a study of children with obesity with a narrow range of BMI distribution, leptin had a slightly less strong correlation to BF% compared with BMI or waist circumference despite being predominantly male.10 However, there were additional differences between the studies, such as the populations (overweight and obese children with T1D vs healthy children with obesity) and methodology to measure body fat (DEXA vs bioimpedance) that could also explain the different results. Clearly, more research is needed to understand this sex-based heterogeneity. In addition, our observation of dissimilarities between boys and girls in the relationship between markers of adiposity and BF% (table 3) support the need for studies in this field to address potential sex differences.
A unique characteristic of our subject population was the administration of exogenous insulin. While insulin is crucial for glucose control, it is also important for adipogenesis. In addition, insulin is a leptin secretagogue.11 A previous study found that changing insulin delivery from multiple daily injections to a continuous subcutaneous system may influence leptin levels in women with T1D.12 While we did not see any association between adipokines in our adolescent subjects with T1D and their total daily insulin dose, it is possible that residual endogenous insulin secretion and exogenous insulin administration had influence on the leptin levels observed in the study participants.
We did not see any association of race/ethnicity on leptin levels. However, leptin levels have been previously shown to be higher in African-American and non-Hispanic whites compared with Hispanic subjects with T1D.13 Thus, it is possible that effects of race/ethnicity were masked by the more homogenous population in these data since our sample included a predominantly white population (75%).6
There are some limitations to this study. Body fat distribution is important for metabolic risk, with visceral fat contributing more to metabolic derangements than subcutaneous fat.14 This dataset did not include differences in visceral versus subcutaneous fat distribution, so these correlations could not be performed. There was marked heterogeneity in serum leptin levels among individuals of similar %BF, although less than for other markers of adiposity, as seen in figure 1. This wide range for leptin is consistent with prior reports,15 and could be due, in part, to intrinsic differences in insulin sensitivity.16 The relatively modest sample sizes studied for boys and girls could have affected the findings regarding strengths of correlations.
In conclusion, we studied serum adipokine levels in overweight/obese adolescents with T1D who participated in the T1D Exchange Metformin Study. Our findings suggest that serum leptin could be used as an accurate marker of adiposity in boys. In girls, waist circumference was the best performing marker and was also strongly correlated with %BF in boys.
Acknowledgments
The authors are grateful to the T1D Exchange and the patients who provided their time and effort in contributing critical information. Without their assistance, this research would not have been possible. The authors would like to thank Kara Page for her assistance with coordinating study sample shipments and data transfer.
References
Footnotes
Presented at Part of the contents of this manuscript were presented at the American Diabetes Association Scientific Meetings in June 2019.
Contributors MJR designed the study, obtained approval from the T1D Exchange, contributed to data analysis and interpretation and wrote the first draft of the manuscript. AFS, MT and MB contributed to data interpretation and manuscript revisions. XG conducted statistical analyses and contributed to manuscript revisions. SD supervised laboratory methods and contributed to data interpretation and manuscript revisions. SS critically contributed to conceptual data interpretation, manuscript writing and revisions. All authors have approved the version of the manuscript to be published.
Funding This work was supported by the American Diabetes Association (1-17-JDF-037) to SS and the US Department of Agriculture, Agriculture Research Service (cooperative agreement no. 58-6250-6-001) to SS.
Competing interests SS receives support from Rhythm Pharmaceuticals for scientific advisory boards and for Speakers Bureau engagements.
Patient consent for publication Not required.
Ethics approval The Metformin Therapy for Overweight Adolescents with Type 1 Diabetes (NCT01881828) was sponsored by the Jaeb Center for Health Research with collaboration from the Juvenile Diabetes Research Foundation. The study was approved by the Jaeb Center for Health Research IRB (registration number: IRB00000766), and by local institutional review boards at each participating institution. All participants and/or their guardians provided written informed consent.
Provenance and peer review Not commissioned; externally peer reviewed.
Data availability statement Data are available in a public, open access repository. T1D Exchange Metformin Study data are publicly available. Serum leptin and adiponectin data are available on reasonable request.