Article Text

Abstract
Introduction As a population-wide intervention, it has been proposed to raise taxes on unhealthy products to prevent diseases such as type 2 diabetes. In this study, we aimed to estimate the effect of tax policy interventions in 2020 on the projected prevalence and number of people with type 2 diabetes in the German adult population in 2040.
Research design and methods We applied an illness-death model and the German Diabetes Risk Score (GDRS) to project the prevalence and number of adults with type 2 diabetes in Germany under a base case scenario and under a tax policy intervention scenario. For the base case scenario, we assumed constant age-specific incidence rates between 2020 and 2040. For the intervention scenario, we assumed a 50% price increase for sugar-sweetened beverages, tobacco and red meat products in the year 2020. Based on price elasticities, we estimated the impact on these risk factors alone and in combination, and calculated subsequent reductions in the age-specific and sex-specific GDRS. These reductions were used to determine reductions in the incidence rate and prevalence using a partial differential equation.
Results Compared with the base case scenario, combined tax interventions in 2020 resulted in a 0.95 percentage point decrease in the prevalence of type 2 diabetes (16.2% vs 17.1%), which corresponds to 640 000 fewer prevalent cases of type 2 diabetes and a relative reduction by 6%.
Conclusions Taxation of sugar-sweetened beverages, tobacco products and red meat by 50% modestly lowered the projected number and prevalence of adults with type 2 diabetes in Germany in 2040. Raising taxes on unhealthy products as a stand-alone measure may not be enough to attenuate the future rise of type 2 diabetes.
- diabetes mellitus
- type 2
- diet
- smoking
- primary prevention
This is an open access article distributed in accordance with the Creative Commons Attribution Non Commercial (CC BY-NC 4.0) license, which permits others to distribute, remix, adapt, build upon this work non-commercially, and license their derivative works on different terms, provided the original work is properly cited, appropriate credit is given, any changes made indicated, and the use is non-commercial. See: http://creativecommons.org/licenses/by-nc/4.0/.
Statistics from Altmetric.com
Significance of this study
What is already known about this subject?
Despite evidence that tax policy interventions might be effective to reduce smoking prevalence or the consumption of unhealthy foods and sugar-sweetened beverages (SSB), the effect on the prevalence of type 2 diabetes is largely unknown.
What are the new findings?
Compared with no change in prices, a 50% increase in prices for SSB, tobacco and red meat products in 2020 may prevent 640 000 prevalent cases of type 2 diabetes in 2040 (10.86 million vs 11.50 million).
This decrease in cases corresponds to a 0.95 percentage point reduction and a 6% relative reduction in the prevalence of type 2 diabetes compared with no tax policy intervention.
Raising taxes on risk factors as a stand-alone measure is likely not to be enough to attenuate the future rise of type 2 diabetes in Germany significantly.
How might these results change the focus of research or clinical practice?
Estimating the impact of taxation policies and other population-based interventions on the projected prevalence and number of cases with type 2 diabetes provides evidence that can aid health policy decisions on the prevention and control of type 2 diabetes in Germany.
Introduction
Depending on future incidence and mortality, the number of people with type 2 diabetes in Germany will increase by 54%–77% between 2015 and 2040.1 This increase would result in 10.7 million to 12.3 million people with type 2 diabetes in 2040. In particular, it has been shown that the trend of the incidence rate of type 2 diabetes may have a large impact on future case numbers.1 In order to attenuate the growing disease burden due to type 2 diabetes in Germany, preventive measures are necessary.
Several established risk factors are associated with an increased risk of type 2 diabetes. In Germany, the German Diabetes Risk Score (GDRS)2 3 has been validated as an instrument to assess the individual risk to develop type 2 diabetes within the next 5 years. In addition to unmodifiable risk factors, such as age and family history of diabetes, several modifiable risk factors are included in the GDRS and could potentially be targeted by an intervention. Among these, waist circumference, smoking and consumption of red meat have a strong impact on the predicted risk of type 2 diabetes.2–4
WHO and the United Nations have proposed to raise taxes on unhealthy products to reduce the consumption of these products in the whole population due to increases in prices.5 6 This approach is based on the idea that consumption patterns of a population are influenced by purchasing prices. Despite these recommendations, only taxes on tobacco products have been introduced in Germany. However, the amount of these taxes as percentage of retail price is only rated as ‘moderate policy’ by WHO, meaning that Germany’s tobacco tax policy does not fully comply with WHO recommendations.7 Tobacco and red meat consumption can be directly affected by such tax raises. In contrast, waist circumference cannot be directly targeted by taxes. However, tax interventions for reducing the consumption of unhealthy foods and sugar-sweetened beverages (SSB) are likely to affect waist circumference as well. Several systematic reviews provide evidence that food taxation results in reducing the consumption of unhealthy foods, and in decreasing anthropometric measures such as body mass index.8–10 Probably the most frequently implemented tax intervention is the taxation of SSB11 and evidence suggests its effectiveness in reducing SSB consumption.12
To inform about the future burden of type 2 diabetes and associated healthcare needs, it is of particular interest, how many cases could be theoretically prevented, if such taxes were introduced. Estimating the impact of taxation policies on the projected prevalence and number of persons with type 2 diabetes can provide evidence to guide health policy decisions on population-based interventions for the prevention of type 2 diabetes in Germany. Most previous studies on this topic investigated the effect of SSB taxes with regard to different cardiometabolic outcomes; for instance, with regard to diabetes and cardiovascular disease in Mexico,13 14 cardiovascular and diabetes-related deaths in the USA,15 several obesity-related diseases in Australia16 and obesity and overweight in Germany.17 Although some of these studies provide evidence for the effect of SSB taxes on diabetes, the results may not be applicable to Germany due to differing levels of SSB consumption across countries.18 Furthermore, national health policy and public health agencies might be better served with studies investigating the effect of taxes on more than one risk factor.
Hence, in this study we aimed to estimate the effect of raising taxes on SSB, tobacco and red meat products on the projected prevalence and number of people with type 2 diabetes in the German adult population in 2040.
Research design and methods
Population and study design
The German population aged 18–100 years was considered as the target population. We projected the prevalence and the number of people with type 2 diabetes between 2020 and 2040 considering different intervention scenarios. The projection was based on an illness-death model, which is governed by a partial differential equation that incorporates future trends in the incidence rate of type 2 diabetes, the mortality rate of the general population and the excess mortality associated with type 2 diabetes.19
Projection model
Illness-death model
In the illness-death model, members of a population can be in the state healthy (in our case with respect to type 2 diabetes), diseased and dead. Transiting between the states is expressed in terms of rates. Hence, the incidence rate is the rate at which people change from the healthy state to the diseased state. Accordingly, the rate at which people die in the healthy and diseased state are the mortality rates of people without and with type 2 diabetes, respectively. This model is governed by a partial differential equation.19 20 Details on using this equation to project prevalence can be found in the online supplemental material 1 and in the study by Tönnies et al.1
Supplemental material
In brief, the partial differential equation was solved by integration to calculate the age-specific prevalence in each year between 2020 and 2040. The difference in mortality between people with versus without type 2 diabetes was incorporated using age-specific mortality rate ratios (MRR) and the mortality rate of the general population. The MRR is the mortality rate of people with type 2 diabetes divided by the mortality rate of people without type 2 diabetes.21 All modeling procedures were performed for women and men separately.
Due to data availability, 2010 was the first year of the prevalence projection based on the age-specific prevalence and incidence rate estimated for 65 million people in the German statutory health insurance.22 As described above, we report results for the years 2020–2040. The age-specific mortality rate of the general population between 2010 and 2040 was taken from official statistics and population projections of the German Federal Statistical Office.23 The Federal Statistical Office assumes reductions in the mortality rate of the general population based on trends since the year 1871. Hence, the impact of future trends in mortality on the prevalence of type 2 diabetes is incorporated. For the age-specific MRR, we used estimates from statutory health insurance data analyzed as part of the national diabetes surveillance in Germany (online supplemental figure 2).21 Temporal trends in MRR are not available for Germany. However, evidence from several countries (eg, the USA,24 Denmark)25 26 suggests that the MRR decreased in recent decades. Hence, we assumed an annual decrease of the MRR by a factor of 0.98 based on Danish data.25 26 Due to geographical proximity and comparable healthcare systems, we think the available Danish data are reasonable substitutes for missing German data on MRR trends. Future trends in incidence rates depended on the hypothetical interventions described below. For the intervention scenarios, the incidence rate was calibrated to the GDRS distribution in the population, such that changes in the GDRS distribution could be converted into changes in the incidence rate. This method was developed and its validity assessed in a recent methodological paper.27
Supplemental material
Combining the partial differential equation and the German Diabetes Risk Score
Hoyer et al27 showed that the partial differential equation can incorporate risk factors, if information on the incidence rate and the distribution of risk factors are available for the same population. This enables analyses of how changes in the distribution of the risk factors affect the incidence rate on the population level and in turn, how these changes affect future disease prevalence. In the current study, the distribution of the GDRS in the German population was used. The GDRS is an epidemiological prediction model for incident type 2 diabetes, developed in the European Prospective Investigation into Cancer and Nutrition (EPIC)—Potsdam study and validated in various populations, including the German general population 18–79 years of age.28 The GDRS assigns points to risk factors according to their effect on the predicted 5-year risk of type 2 diabetes as shown in the following equation4:

Information on the age-specific and sex-specific distribution of GDRS components among adults in Germany aged 18–79 years without known diabetes was available from the German Health Interview and Examination Survey for Adults 2008–2011 (DEGS1).4 Since SSB consumption is not included in the GDRS, we obtained SSB consumption for Germany using the same data set, and simulated the indirect effect of an SSB tax through waist circumference on the GDRS based on available evidence.29
As proposed,27 we included the available information on GDRS components into the partial differential equation describing the illness-death model, along with estimates of diabetes incidence, mortality in the general population and diabetes-associated MRR. In order to combine the GDRS and the partial differential equation, the GDRS distribution in 2010 was calibrated to the diabetes incidence rate in 2010.22 This calibration enabled us to translate age-specific changes in the population-wide GDRS distribution into relative changes of the age-specific incidence rate in terms of incidence rate ratios (online supplemental figures 3 and 4) as well as the subsequent prevalence and number of people with type 2 diabetes up to the year 2040 (details in online supplemental material 1 and in the study by Hoyer et al27). Below, we describe how and when the tax policy interventions were assumed to change single GDRS items.
Supplemental material
Supplemental material
Intervention scenarios
Taxes on tobacco products, red meat and sugar-sweetened beverages
For the population-wide intervention scenario, we assumed that changes in the GDRS due to taxation of SSB, red meat and tobacco products determined trends in the incidence rate. The effect of taxes on consumption was quantified with the price elasticity of demand (PED). The PED indicates relative changes in consumption following relative changes in price. For instance PED=−1 means that 10% increase in price leads to 10% decrease in consumption. We used age-specific values of red meat and SSB consumption and smoking prevalence observed in the national health survey mentioned above and empirically justified assumptions on PED to calculate the change in consumption (details in online supplemental material).
For smoking prevalence, we assumed a PED of −0.15, based on studies by WHO.30 Furthermore, we assumed that the proportion of former smokers among non-smokers remains constant. This assumption means that reductions in smoking prevalence are partly caused by a higher probability to quit smoking among current smokers and partly caused by a lower probability to initiate smoking among present never-smokers. As an adverse effect of tobacco taxes, we assumed quitting smoking results in an increase of waist circumference by 2.6 cm as observed in the literature.31 32 For red meat, we assumed a PED of −0.6 based on a meta-analysis, which estimated the PED for meat overall.9 We also assumed that such a PED results in a reduction of waist circumference by 0.44 cm per 100 g/day reduction in red meat consumption. This association was observed in a representative survey among US adults.33 The PED for SSB was −1.0 based on a recent meta-analysis.12 Since SSB is not included in the GDRS, the effect of the SSB tax was estimated through reductions in waist circumference. For this reduction, we assumed that one serving of SSB (330 mL) contained 130 kcal and that a reduction of daily SSB consumption equivalent to a decrease of energy intake of 100 kcal led to a decrease in waist circumference by 1.1 cm as observed in a prospective cohort study among Spanish adults.29
We simulated a 50% increase in prices for SSB, red meat and tobacco products in the year 2020. Based on the assumed PEDs, this price increase was assumed to reduce consumption of SSB, red meat and smoking prevalence by 50%, 30% and 7.5%, respectively. We chose an increase of 50% since this is the largest price change investigated in previous studies.8 As a sensitivity analysis, we also simulated a price increase of 30%. We assumed that the resulting decrease in GDRS will occur linearly over a period of 5 years until 2025 and that these decreases in GDRS will immediately translate into decreases of the type 2 diabetes incidence rate. We calculated the effects of the intervention for each single GDRS item (red meat, smoking and waist circumference) separately as well as for all items combined.
Results
Table 1 shows the age-specific values of the risk factors between 2008 and 2011 that were targeted by the hypothetical interventions. Among women, there is no clear trend in meat consumption across age groups, whereas the prevalence of current smoking decreased with age. Among men, the magnitude of both risk factors decreased with increasing age. Red meat consumption and the prevalence of heavy smokers (at least 20 cigarettes/day) was markedly higher among men up to age 60–64 years. Waist circumference was higher among men and increased with increasing age among women and men. SSB consumption decreased with increasing age and was higher among men.
Red meat and SSB consumption, smoking prevalence and waist circumference in Germany
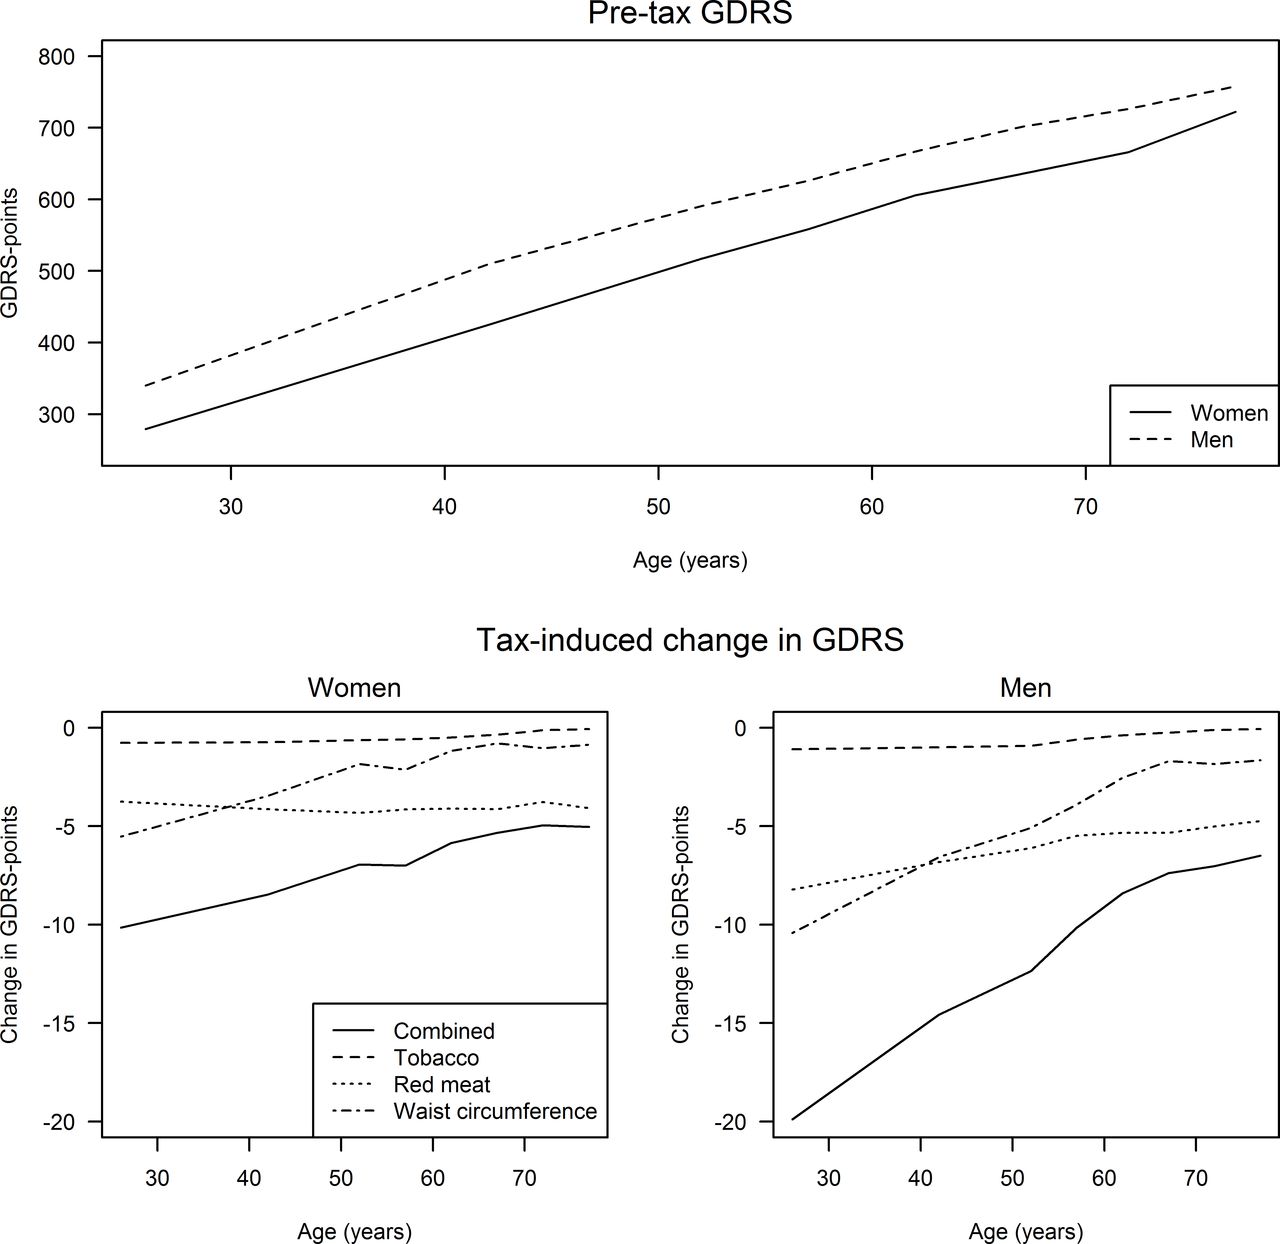
The age-specific and sex-specific baseline (pre-tax) distribution in mean GDRS is illustrated in figure 1. In order to assess the effect of a 50% increase in prices for SSB, tobacco products and red meat on the prevalence, we calculated the corresponding age-specific and sex-specific reductions in GDRS points overall and by target of intervention (figure 1). The reductions in GDRS points were larger with regard to price increases for red meat than for tobacco products. This is mainly caused by a higher price elasticity for red meat consumption (PED=−0.6) than for smoking prevalence (PED=−0.15). The amount of reduction achieved by the price increases also depends on the absolute pre-tax level of the risk factor, since price elasticity is a relative measure. Hence, high mean age-specific meat consumption contributed to high absolute differences in meat consumption and resulted in large absolute reductions of GDRS points. The indirect effect of price increases for tobacco products, SSB and red meat on waist circumference resulted in larger reductions in age-specific mean waist circumference among younger age groups compared with older age groups.

Effect of tax policy interventions on the German Diabetes Risk Score (GDRS). Age-specific mean GDRS (in GDRS points) before introduction of tax policy interventions and age-specific reductions in GDRS due to a 50% increase in price of tobacco products, red meat and sugar-sweetened beverages (SSB) in Germany. Changes in the waist circumference item were based on the indirect effect of tobacco, red meat and SSB taxes on waist circumference.
For the projection of the type 2 diabetes prevalence, the reductions in GDRS points were translated into reductions in the age-specific incidence rate (online supplemental figures 3 and 4). From year 2025 onward, the overall prevalence between 2020 and 2040 in the base case and tax intervention scenarios diverge, leading to an increasing difference in prevalence until 2040 (figure 2A). Similarly, the age-specific prevalence in 2040 is lower in the intervention scenario compared with the base case among persons 50 years of age and older (figure 2B).

Projected prevalence of type 2 diabetes in Germany. The projected prevalence refers to the population in Germany aged between 18 and 100 years between 2020 and 2040 (A) and to the age-specific prevalence in 2040 (B). GDRS, German Diabetes Risk Score.
As shown in table 2, a 50% increase in prices for SSB, tobacco products and red meat resulted in 640 000 fewer prevalent cases of type 2 diabetes in 2040 as compared with the base case scenario (11.50 million cases vs 10.86 million cases). Among men, the difference was larger (410 000 fewer cases) than among women (230 000 fewer cases). Overall, this corresponds to a 6% relative reduction in prevalence (prevalence ratio of 0.94). In absolute terms, this means a 0.95 percentage point reduction in prevalence. The strongest effect is due to reductions in red meat consumption.
Effect of tax policy interventions on the prevalence of type 2 diabetes in 2040
In a sensitivity analysis, we also estimated a 30% price increase, which resulted in 390 000 avoided prevalent cases in the combined intervention scenario (detailed results in online supplemental table 1).
Supplemental material
Discussion
We estimated the impact of a tax intervention resulting in a 50% price increase for tobacco products, SSB and red meat in the year 2020 on the prevalence and number of adults with type 2 diabetes in Germany in 2040. The impact on prevalence was modest with a 0.95 percentage point reduction in prevalence and a 6% relative reduction in prevalence (prevalence ratio: 0.94) compared with no intervention. Nevertheless, in terms of case numbers this means 640 000 fewer cases of prevalent type 2 diabetes by 2040.
One comparable study simulated a 20% tax increase on SSB in Australia. Veerman et al16 estimated that 25 years after introduction of the tax, there would be 16 000 fewer prevalent cases of type 2 diabetes. For Mexico, it was estimated that a 10% and 20% tax increase on SSB could reduce the prevalence of type 2 diabetes in 2050 by 1.3% and 2.0%, respectively, compared with no taxes.13 This effect is lower than our estimate of a 6% reduction in prevalence, which seems plausible given that we modeled a 50% tax increase on three type 2 diabetes risk factors.
Some studies investigated the impact of taxes on the number of incident cases in a given time period. In the Mexican population aged 35–94 years, it was estimated that 189 300 (5%) of incident cases could be prevented between 2013 and 2022 by a tax-induced 10% decrease in SSB consumption.14 Similarly, a 10% SSB tax could prevent 240 000 incident cases between 2015 and 2050 in Mexico according to Barrientos-Gutierrez et al.13 In the Indian population aged 25–65 years, the incidence may be reduced by 1.6% due to a 20% SSB tax, resulting in 400 000 prevented incident cases between 2014 and 2023.34
Implications for public health
Our study provides evidence that increasing prices of SSB, red meat and tobacco products combined may have a modest impact on future prevalence of type 2 diabetes in Germany. These results reinforce the need for a comprehensive prevention program, possibly combining tax interventions with other environmental public health policies, for example, food labeling and setting-based approaches,35 to increase the availability and choice of healthy foods. On the other hand, taxes have the potential to generate revenues and have shown to be cost-effective.16 36–40 Hence, the potential to lower the number of prevalent type 2 diabetes cases in 2040 by 640 000 might still be considered sufficient to implement taxes on the considered products. Furthermore, there is evidence that groups of lower socioeconomic position are more responsive to changes in price.9 Hence, taxes may reduce socioeconomic inequalities with regard to health behavior and risk of type 2 diabetes.15 41 Moreover, populations of lower socioeconomic position are considered hard to reach when implementing individual behavioral interventions.42 From a public health perspective, it should also be noted that the simulated tax intervention might positively impact the risk of other chronic non-communicable diseases.16 Thus, future studies should consider multiple health outcomes. To put the number of potentially avoided prevalent cases into perspective, future studies may also compare these results with other population-wide and high-risk interventions. For instance, a Dutch study compared different public health interventions such as screening programs during pregnancy, tobacco control and vaccination for influenza with regard to the annual number of avoided deaths and cases of disease.43 For Germany, we are only aware of studies investigating public health interventions targeted at single risk factors and/or outcomes. For instance, it was found that a comprehensive set of tobacco control policies (eg, plain packaging, marketing ban) could avert approximately 40 000 deaths in the year 204044 and 57 000 incident cancer cases in 2050.45 Another example is a web-based physical activity intervention which may avert approximately 8000 disease cases and 13 000 deaths among the population aged >55 years in Germany over a 10-year period.46 Similar comparisons might be useful with regard to screening programs for people at high risk of type 2 diabetes and with regard to the effects of food labeling such as the Nutri-Score, which was recently introduced to Germany.47
Our results demonstrate differences in the impact of tax interventions according to the type of target product. One determinant of the strength of effect was the PED. Hence, before implementing a tax, careful review of the evidence on PED for the considered product is warranted. In addition, the results indicated that reductions in the predicted risk of type 2 diabetes (as indicated by changes in GDRS points due to the intervention) on the population level were influenced by the prevalence or mean of the risk factor. Hence, risk factors with a high prevalence or mean on the population level can be important, even if the effect on the risk of type 2 diabetes for an individual is comparably small.
A key issue that is beyond the scope of this work refers to the practical implementation of tax policy interventions. For instance, it is debatable, whether a 50% tax is realistic. We chose this value because it represents the highest price increase investigated in previous studies8 and has been implemented in several countries.11 Sensitivity analyses showed that a price increase of 30% instead of 50% led to substantially smaller effect of the tax intervention. Hence, our main analysis may be interpreted as a scenario estimating what effect is potentially possible, when considering the upper end of the tax range implemented in other countries. The results corresponding to 30% tax provide an idea on how the effect of taxes varies with the degree of taxes. Related to this point is the question of acceptability of tax policy interventions. Evidence suggest that acceptability depends on various factors such as beliefs about effectiveness, appropriateness and public mistrust of government.48 Hence, it is generally recommended to transparently communicate the purpose of the tax intervention and to use the revenue for health initiatives.37 48
Strengths and limitations
One strength of this study is that the input values were based on nationally representative data. The GDRS is a validated instrument for assessing diabetes risk in individuals. Hence, the assumed effect of changes in risk factors on the predicted risk of diabetes are backed up by strong empirical evidence. Another strength lies in the method we used, since future trends in mortality and population size could be incorporated. Furthermore, the method allows to translate changes in consumption of red meat, SSB and tobacco products into reductions in the incidence rate to estimate changes in prevalence. Although there is much evidence on the effect of taxes on consumption, the subsequent effect on prevalence and number of cases of type 2 diabetes on the population level has not been investigated thoroughly. However, estimating the impact of interventions on reducing the prevalence and number of cases is probably more relevant for decisions on public health policy interventions.
As a drawback, we had to rely on findings from other countries for the temporal trends in the MRR.25 26 However, the resulting error might be small, since it has been shown that trends in MRR have a rather little impact on future prevalence.1 Furthermore, it is known that reductions in consumption of one food may be substituted by the consumption of another food (cross-price elasticity).49 50 The implicit assumption of our study is that red meat and SSB are only substituted with foods that do not increase diabetes risk, which may have led to an overestimation in the reductions of type 2 diabetes incidence. For instance, the association between red meat, poultry, sea food and waist circumference were similar in the study that informed our model.33 If tax-induced reductions of red meat consumption were replaced by poultry and/or sea food, the effect on waist circumference could be offset. Conversely, one limitation that might have led to an underestimation of the effect is that we did not account for advantageous long-term effects of the tax policy interventions on other risk factors, such as hypertension and family history of type 2 diabetes. Moreover, the variables in our model were limited to the GDRS items, which also could result in an underestimation of the effect. For instance, since SSB is not part of the GDRS, we only considered the effect of SSB consumption on waist circumference, although there might be various pathways between SSB and the incidence of type 2 diabetes. Due to limited data, some assumptions regarding the effects on the risk factors are based on rather weak empirical evidence. For instance, the indirect effects of reductions in red meat and SSB consumptions on waist circumference were based on single studies, which were not performed in Germany. It is questionable whether these associations also apply to the German population.
The results show that the PED of the product which is targeted by a tax is important for the impact on type 2 diabetes prevalence; thus, the choice of PEDs is a crucial modeling decision. In general, country-specific PED estimates should be preferred to account for cultural aspects. Since German PED estimates were not available, we had to rely on meta-analyses based on data from different countries. Furthermore, we used a PED estimate for meat in general and not red meat in particular. The direction and degree of the resulting bias is unclear. However, our assumptions on PED are in line with previous studies. For instance, we assumed a PED of −1.0 for SSB, which is within the range of comparable studies assuming PEDs between −0.613 16 and −1.2.13 17 In particular, our assumptions are comparable to another German study, which assumed PEDs for SSB of −0.9 and −1.2 for high-income and low-income groups, respectively.17 With regard to red meat, a meta-analysis estimated PEDs by type of meat. Results ranged from −0.7 for poultry and −0.9 for lamb.51 However, we preferred the more conservative estimate by Green et al9 derived from results that were stratified by country wealth category. This yields more appropriate input data for our study, because populations in high-income countries such as Germany usually are less responsive to price changes than populations in low-income and middle-income countries.9
With regard to the GDRS, it should be noted that it was developed as a risk prediction model and therefore does not necessarily represent causal effects of the risk factors. On the other hand, for most GDRS components, evidence for a causal relationship with type 2 diabetes is strong.2
Given the weak empirical basis for some of our assumptions, it should be noted that there are still many uncertainties with regard to tax increases on consumer products and its effects on health-related behavior. This has also been shown for taxes on sugar-added foods/unprocessed sugar11 and total fat/saturated fat52 in two recent Cochrane reviews. For instance, knowledge about long-term effects of tax interventions, switching to alternative products and the effectiveness of tax interventions in high-risk groups is limited. As has been shown for SSB consumption, a need for intensified research is also apparent concerning alternative or complementary population-based approaches, such as food labeling.35 In addition, the role of policy context is considered an important factor with regard to the effectiveness of taxes.53 Such considerations are not included in our illness-death model. Yet, our results might serve as a starting point to estimate the potential impact of assumed tax increases on type 2 diabetes, although we are aware that more complex models may be needed in future research to incorporate the impact of societal and political context. Finally, the speculative nature of any projection should be kept in mind when interpreting the findings of our study.
In summary, increasing prices of SSB, tobacco products and red meat by 50% in 2020 had a modest impact on the prevalence of type 2 diabetes in Germany in 2040. Nevertheless, the increase in prices might reduce the number of prevalent cases in 2040 by approximately 640 000. However, raising taxes on risk factors as a stand-alone measure is likely not to be enough to attenuate the future rise of type 2 diabetes significantly. These results suggest that extended public health strategies are needed for the prevention and control of type 2 diabetes. Estimating the impact of taxation policies and other population-based interventions on the projected prevalence and number of cases with type 2 diabetes may aid health policy decisions on the prevention and control of type 2 diabetes in Germany. Future models need to consider other modifiable risk factors, such as physical activity, and should be extended to other non-communicable diseases sharing these risk factors with type 2 diabetes.
Supplemental material
References
Supplementary materials
Supplementary Data
This web only file has been produced by the BMJ Publishing Group from an electronic file supplied by the author(s) and has not been edited for content.
Footnotes
RB and AH contributed equally.
Contributors TT analyzed the data and wrote the manuscript. RP contributed to the analysis and discussion and reviewed the manuscript. CH and CS-N contributed to the discussion and reviewed the manuscript. ES-J researched data, contributed to the discussion and reviewed the manuscript. RB and AH are the initiators of the project and contributed to all aspects of the study. RB and AH contributed equally to this work. All authors revised the manuscript for critically important content and approved the final version of the manuscript.
Funding This study was supported by the German Federal Ministry of Health as part of the project ‘Establishing a national diabetes surveillance at the Robert Koch Institute’ in Berlin (grant no. GE20150323).
Competing interests None declared.
Patient consent for publication Not required.
Provenance and peer review Not commissioned; externally peer reviewed.
Data availability statement All data relevant to the study are included in the article or uploaded as supplemental information. We only used data on an aggregated level. The data are available from this manuscript and the sources referenced in the ‘Research design and methods’ section.
Supplemental material This content has been supplied by the author(s). It has not been vetted by BMJ Publishing Group Limited (BMJ) and may not have been peer-reviewed. Any opinions or recommendations discussed are solely those of the author(s) and are not endorsed by BMJ. BMJ disclaims all liability and responsibility arising from any reliance placed on the content. Where the content includes any translated material, BMJ does not warrant the accuracy and reliability of the translations (including but not limited to local regulations, clinical guidelines, terminology, drug names and drug dosages), and is not responsible for any error and/or omissions arising from translation and adaptation or otherwise.