Article Text

Abstract
Introduction We investigated trends in the proportion of diabetes treatment and glycemic control, which may be altered by recent advances in insulin and non-insulin drugs, in Japanese patients with type 2 diabetes.
Research design and methods A serial cross-sectional study was performed using a multicenter large-population database from the Japan Diabetes Clinical Data Management study group. Patients with type 2 diabetes who attended clinics belonging to the study group between 2002 and 2018 were included to examine trends in glycated hemoglobin A1c (HbA1c) by treatment group using multivariable non-linear regression model.
Results The proportion of patients with insulin only decreased from 15.0% to 3.6%, patients with insulin+non-insulin drugs increased from 8.1% to 15.1%, patients with non-insulin drugs increased from 50.8% to 67.0%, and those with no drugs decreased from 26.1% to 14.4% from 2002 to 2018, respectively. The HbA1c levels of each group, except for no drugs, continued to decrease until 2014 (unadjusted mean HbA1c (%) from 2002 to 2014: from 7.89 to 7.45 for insulin only, from 8.09 to 7.63 for insulin+non-insulin, and from 7.51 to 6.98 for non-insulin) and remained unchanged thereafter. Among insulin-treated patients, use of human insulin decreased, use of long-acting analog insulin increased, and concomitant use of non-insulin drugs increased (from 35.1% in 2002 to 80.9% in 2018), which included increased use of dipeptidyl peptidase 4 inhibitors, sodium-glucose cotransporter 2 inhibitors, and glucagon-like peptide 1 receptor agonists, and the persistently high use of metformin.
Conclusions During the past two decades, combined use of insulin and non-insulin drugs increased and glycemic control improved and leveled off after 2014 in Japanese patients with type 2 diabetes. Further studies of the trend in association with age and factors related to metabolic syndrome are necessary to investigate strategies aiming at personalized medicine in diabetes care.
- diabetes mellitus, type 2
- drug therapy
- insulin
Data availability statement
Data are available upon reasonable request.
This is an open access article distributed in accordance with the Creative Commons Attribution Non Commercial (CC BY-NC 4.0) license, which permits others to distribute, remix, adapt, build upon this work non-commercially, and license their derivative works on different terms, provided the original work is properly cited, appropriate credit is given, any changes made indicated, and the use is non-commercial. See: http://creativecommons.org/licenses/by-nc/4.0/.
Statistics from Altmetric.com
Significance of this study
What is already known about this subject?
Previous studies showed that glycemic control in type 2 diabetes improved.
In the past two decades, new medicines have become available in clinical practice, such as analog insulin and several non-insulin drugs.
The clinical practice guideline for type 2 diabetes was modified considering the prevention of hypoglycemia and cardiovascular disease especially in elderly patients.
What are the new findings?
From 2002 to 2018, the proportion of patients with insulin only decreased from 15.0% to 3.6%, patients with insulin+non-insulin drugs increased from 8.1% to 15.1%, patients with non-insulin drugs increased from 50.8% to 67.0%, and those with no drugs decreased from 26.1% to 14.4%.
Glycated hemoglobin A1c levels continued to decrease until 2014, except for those receiving no drugs, and remained unchanged thereafter.
Among insulin-treated patients, concomitant use of non-insulin drugs increased markedly.
How might these results change the focus of research or clinical practice?
Such analysis in trends would strongly suggest that findings of increasing use of a combination of insulin and non-insulin drugs and of non-insulin drugs only should be directed to personalized medicine in diabetes care.
Introduction
Type 2 diabetes is a worldwide pandemic and represents a major threat to public health and economic burden in many countries. Long-term maintenance of a strict glycemic control is important to improve the prognosis of patients with type 2 diabetes and to prevent the development of its serious complications. While most clinical practice guidelines for diabetes care recommend a glycated hemoglobin A1c (HbA1c) of less than 7.0% as the therapeutic goal for glycemic control in non-pregnant adults,1 2 some people have difficulty in achieving and maintaining such goal. In particular, elderly people with type 2 diabetes, whose population is markedly increasing with extension of life expectancy in many countries, often have several comorbidities concomitantly to be susceptible to severe hypoglycemia and to be less tolerable.3 Thus, recent clinical guidelines have shifted and emphasized that glycemic targets must be individualized in terms of shared decision-making to address the needs and preferences of each patient and the individual characteristics that influence the risks and benefits of therapy to each patient in order to optimize patient engagement and self-efficacy.1–3
Over the past two decades, a great deal of efforts to develop new glucose-lowering drugs have been made and several new medicines are now available in clinical practice of diabetes care, such as analog insulin, dipeptidyl peptidase 4 inhibitors (DPP4i), glucagon-like peptide 1 receptor agonists (GLP-1RA), and sodium-glucose cotransporter 2 inhibitors (SGLT2i). The introduction of these new medicines into diabetes practice is expected to expand the options for diabetes treatment regimen, including their combination, and to relatively achieve safer and better glycemic control. In fact, a series of studies have indicated an advantage of adding long-acting insulin to oral glucose-lowering drugs4 5 and reversely adding oral glucose-lowering drugs to insulin therapy.6 7 The outcome of diabetes treatment, including glycemic control, in patients with type 2 diabetes has improved8 9 and the prevalence of diabetic vascular complications has been decreasing.9 10
It is likely that recent advances in insulin and non-insulin drugs have altered the proportion of diabetes treatment and glycemic control during the past two decades. However, few studies have investigated detailed trends in those with insulin therapy or the combination of insulin and oral glucose-lowering drugs,11 although several studies have reported a trend in glycemic control in patients with type 2 diabetes.8 12 13 Thus, it would be important to clarify the trend in the proportion of patients and their glycemic control according to each diabetes treatment regimen. Understanding these trends in diabetes practice is critical for future studies and strategies for personalized medicine in diabetes care.
The objectives of our study were to investigate and compare the trends in glycemic control in patients with insulin only, insulin+non-insulin, non-insulin drugs only, and no drugs for over nearly two decades using real-world data of Japanese subjects with type 2 diabetes. In particular, we focused on the tendency of insulin therapy and investigated it in detail.
Research design and methods
Data source
The database from the Japan Diabetes Clinical Data Management (JDDM) study group is a real-world data set of people with diabetes attending nearby medical clinics. This study group was founded in 2001 and organized mainly by general practitioners voluntarily gathering from all over Japan in order to elucidate the actual status of Japanese diabetes care and promote clinical diabetes research based on daily clinical practice since there was no nationwide registry system in Japan. Majority of the physicians in this study were practitioners conducting daily general practice while specializing in or being interested in diabetes care (see online supplemental appendix). Clinical data and medical prescriptions in daily clinical practice were accumulated over time at the central office using the same software.
Supplemental material
Study design and measurements
A serial cross-sectional study was performed using a multicenter large-population database from the JDDM study group. All patients with type 2 diabetes who regularly attended JDDM clinics from 2002 to 2018 were included in this study, where data were collected every 2 years. Type 2 diabetes was diagnosed according to the Japan Diabetes Society (JDS) criteria: presence of fasting plasma glucose level ≥7.0 mmol/L or casual glucose level ≥11.1 mmol/L and an HbA1c value ≥6.5% (47 mmol/mol). Patients with type 1 diabetes, gestational diabetes, and were pregnant were excluded. Patients attended the clinic monthly or bimonthly to undergo HbA1c measurement, which was analyzed using high-performance liquid chromatography and presented as National Glycohemoglobin Standardization Program (%) and International Federation of Clinical Chemistry and Laboratory Medicine (mmol/mol) values. Patients were treated with the aim of achieving the targets recommended by the JDS of an HbA1c value of <7.0% (53 mmol/mol), blood pressure <130/80 mm Hg, and serum concentrations of low-density lipoprotein cholesterol <3.1 mmol/L (120 mg/dL), high-density lipoprotein cholesterol (HDL) ≥1.0 mmol/L (40 mg/dL), and non-HDL cholesterol <3.8 mmol/L (150 mg/dL), and body mass index of 20–24 kg/m2.2 Considering age, duration of diabetes, presence of organ damage, risk of hypoglycemia, and access to any support available, HbA1c targets were further detailed as follows: <6.0% (41 mmol/mol) when aiming for normal glycemia, <7.0% (52 mmol/mol) when aiming to prevent complications, and <8.0% (63 mmol/mol) when intensification of therapy was considered difficult. Data from the last visit between May and July were collected every 2 years from 2002 to 2018. All patients provided informed consent.
Classification of glucose-lowering drugs
Insulin was grouped into four categories according to the Anatomical Therapeutic Chemical Classification System:14 intermediate-acting (A10AC), long-acting (A10AE), fast-acting (A10AB), and combined intermediate-acting or long-acting with fast-acting insulin (A10AD30). The types of insulin were further classified into human insulin, that is, Neutral Protamin Hagedorn (NPH) (A10AC01), regular (A10AB01), and mixed (A10AD01), and analog insulin, that is, long-acting (A10AE04–06), prandial (A10AB04–06), and premixed (A10AD04–06). Glucose-lowering drugs other than insulin, defined as non-insulin drugs, were classified into eight categories: metformin (A10BA), sulfonylureas (A10BB), α-glucosidase inhibitors (αGI) (A10BF), pioglitazone (A10BG), glinide (A10BX), DPP4i (A10BH), GLP-1RA (A10BJ), and SGLT2i (A10BK).
Statistical analysis
Treatment groups were classified into four categories: insulin-only, insulin+non-insulin drugs, non-insulin drugs only, and no drugs. Proportions of HbA1c categories (<6.0%, 6.0%–<7.0%, 7.0%–<8.0%, 8.0%–<9.0%, and ≥9.0%) in each treatment group from 2002 to 2018 were calculated. To evaluate the trends of HbA1c in each treatment group, we performed a multivariable non-linear regression analysis with the HbA1c level within the observed periods as the objective variable. This model included a cross-product term between assessment year and treatment group as the explanatory variables to examine the difference in trends according to treatment group. We estimated non-linear trends through a restricted cubic spline approach with five knots. In this model, we adjusted for the following covariates: sex, age, and duration of diabetes at the first time observation. For insulin therapy, two types of human and analog insulin were categorized, where human insulin included NPH, regular, and mixed insulin, and analog insulin included long-acting (basal), prandial, and premixed insulin. Regarding the insulin regimen, basal included NPH human insulin and long-acting analog insulin; bolus included regular human insulin and prandial analog insulin; and premixed included mixed human insulin and premixed analog insulin. Changes in the percentage of insulin use from 2002 to 2018 were analyzed by χ2 test, and p value for trend using the Mantel-Haenszel test was given. The trend in HbA1c level among insulin-treated patients using non-insulin drugs was also examined using a non-linear regression model similar to that described above. This model included a variable indicating the insulin regimen instead of the treatment group as the explanatory variable. Furthermore, we conducted a similar analysis among insulin-treated patients not using non-insulin drugs. Changes in the proportion of concomitantly used non-insulin drugs among insulin-treated patients with type 2 diabetes from 2002 to 2018 were investigated, while changes in all patients with type 2 diabetes are reported elsewhere.15 Hypothesis tests were conducted using a two-sided 5% significance level. All analyses were performed using IBM SPSS Statistics V.25 statistical software package and R V.4.0.3 (https://cloud.r-project.org/).
Results
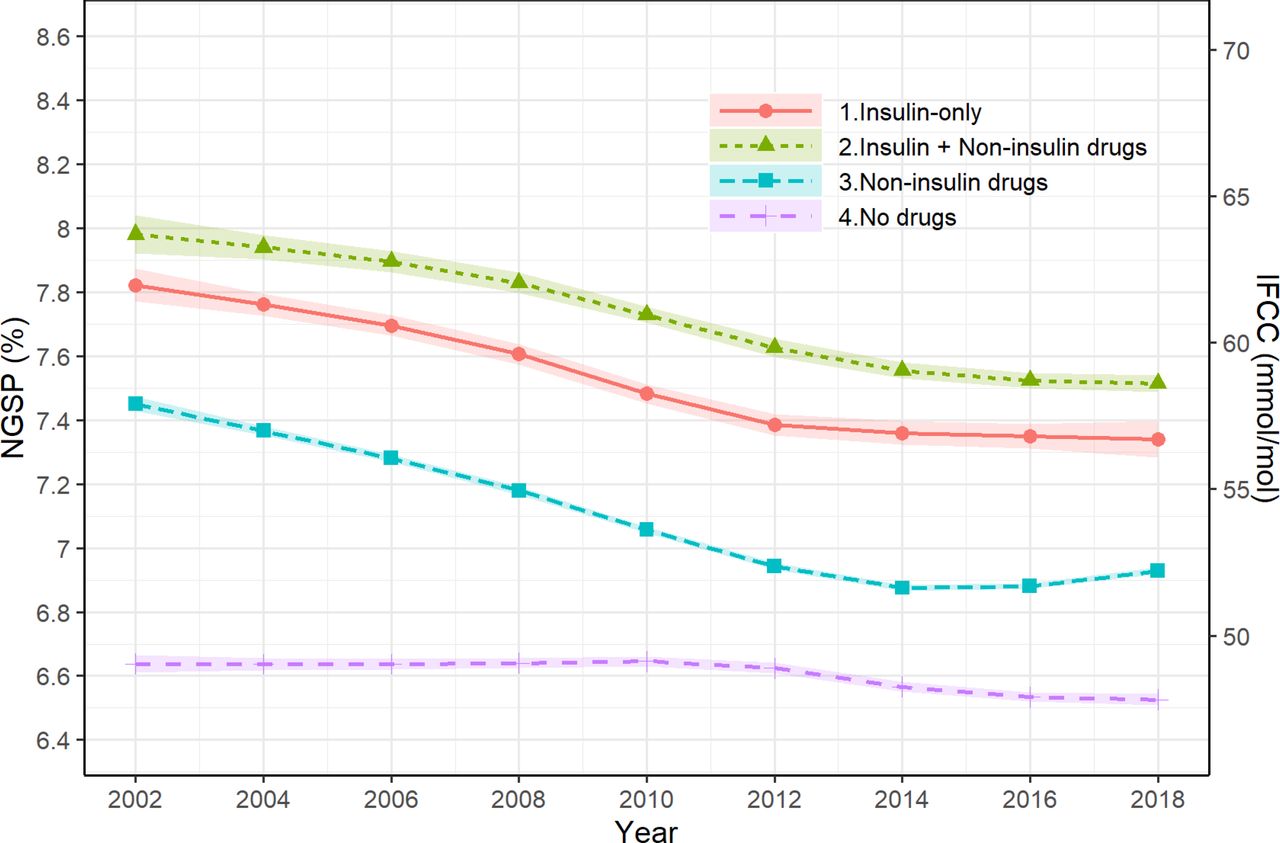
Table 1 shows the clinical characteristics of patients with type 2 diabetes in the JDDM study between 2002 and 2018. The average age and duration of diabetes increased from 62.7 to 66.8 years and from 10.9 to 15.0 years, respectively. The proportion of patients with insulin only decreased from 15.0% to 3.6% and of patients with insulin+non-insulin drugs increased from 8.1% to 15.1%. The proportion with non-insulin drugs increased from 50.8% to 67.0%, while the proportion with no drugs decreased from 26.1% to 14.4%. Figure 1 shows the adjusted slopes of HbA1c level by each treatment group. The unadjusted mean of HbA1c (%) continued to decrease from 2002 to 2014 in patients with any glucose-lowering drug: from 7.89 to 7.45 for insulin only, from 8.09 to 7.63 for insulin+non-insulin, and from 7.51 to 6.98 for non-insulin drugs only (online supplemental table 1). After 2014, the levels in each group remained unchanged or slightly increased. In contrast, it was stable in patients with no drugs. Similarly, the proportions of HbA1c <7.0% in 2002 and 2018 were 29.5% and 38.4% in insulin only, 20.5% and 27.2% in insulin+non-insulin drugs, 37.4% and 55.2% in non-insulin drugs, and 70.8% and 80.0% in no drugs, respectively (figure 2).
Supplemental material
Clinical characteristics of all patients with type 2 diabetes and changes in insulin type and proportion of use of non-insulin drugs in association with insulin regimen among insulin-treated patients in the JDDM study between 2002 and 2018

Trends in HbA1c level by treatment group: insulin only, insulin+non-insulin, non-insulin, and no drugs, shown as adjusted slopes from 2002 to 2018. HbA1c, glycated hemoglobin A1c; IFCC, International Federation of Clinical Chemistry; NGSP, National Glycohemoglobin Standardization Program.
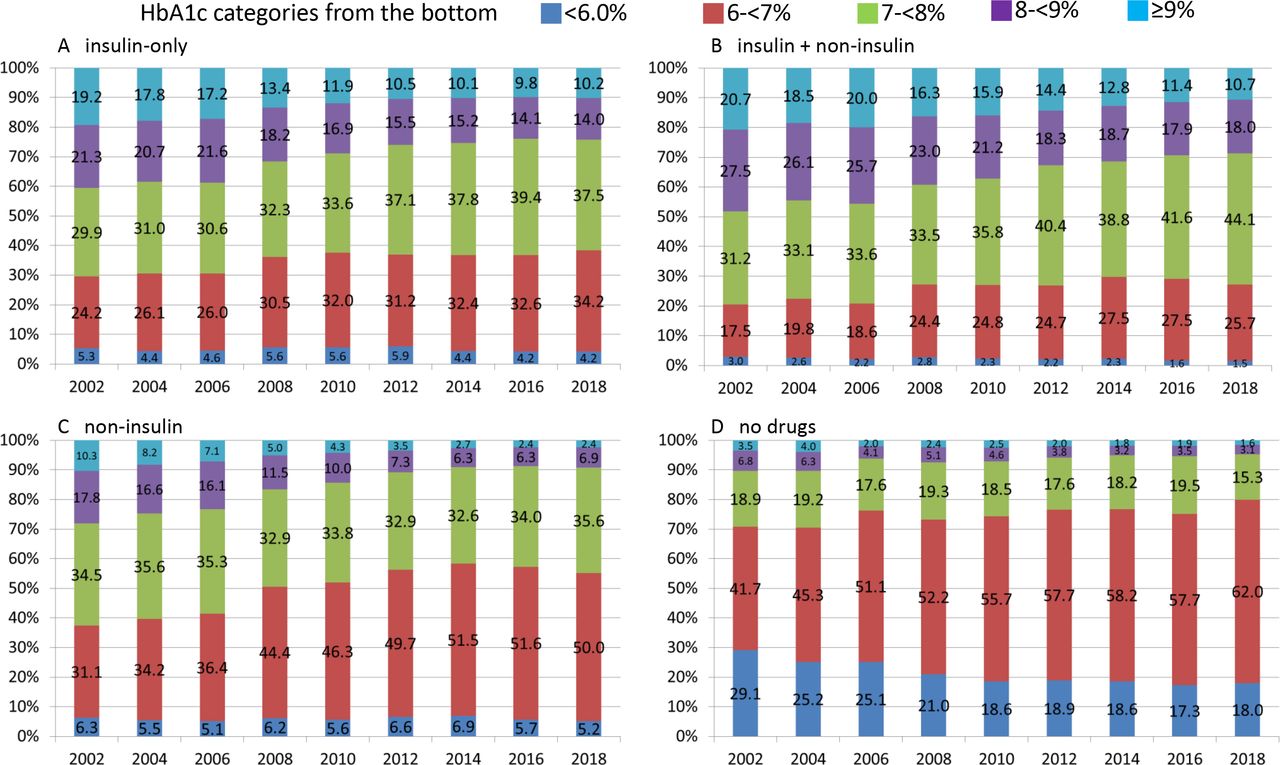
Proportion of HbA1c categories (from the bottom: <6.0%, 6%–<7%, 7%–<8%, 8%–<9%, and ≥9%) from 2002 to 2018: (A) insulin only, (B) insulin+non-insulin, (C) non-insulin, and (D) no drugs. HbA1c, glycated hemoglobin A1c.
The total proportion of patients receiving any insulin therapy, including insulin only and insulin+non-insulin drugs, gradually decreased from 23.1 in 2002 to 18.7% in 2018 (table 1). Regarding the type of insulin, human insulin including NPH, regular, and mixed decreased markedly. For analog insulin, long-acting insulin continually increased, and prandial and premixed insulin increased until 2014 and 2012, respectively, and thereafter slightly decreased. In insulin-treated patients, use of non-insulin drugs increased markedly from 35.1 in 2002 to 80.9% in 2018, while the proportion of insulin only (not using non-insulin drugs) decreased from 64.9 in 2002 to 19.1% in 2018 (table 1).
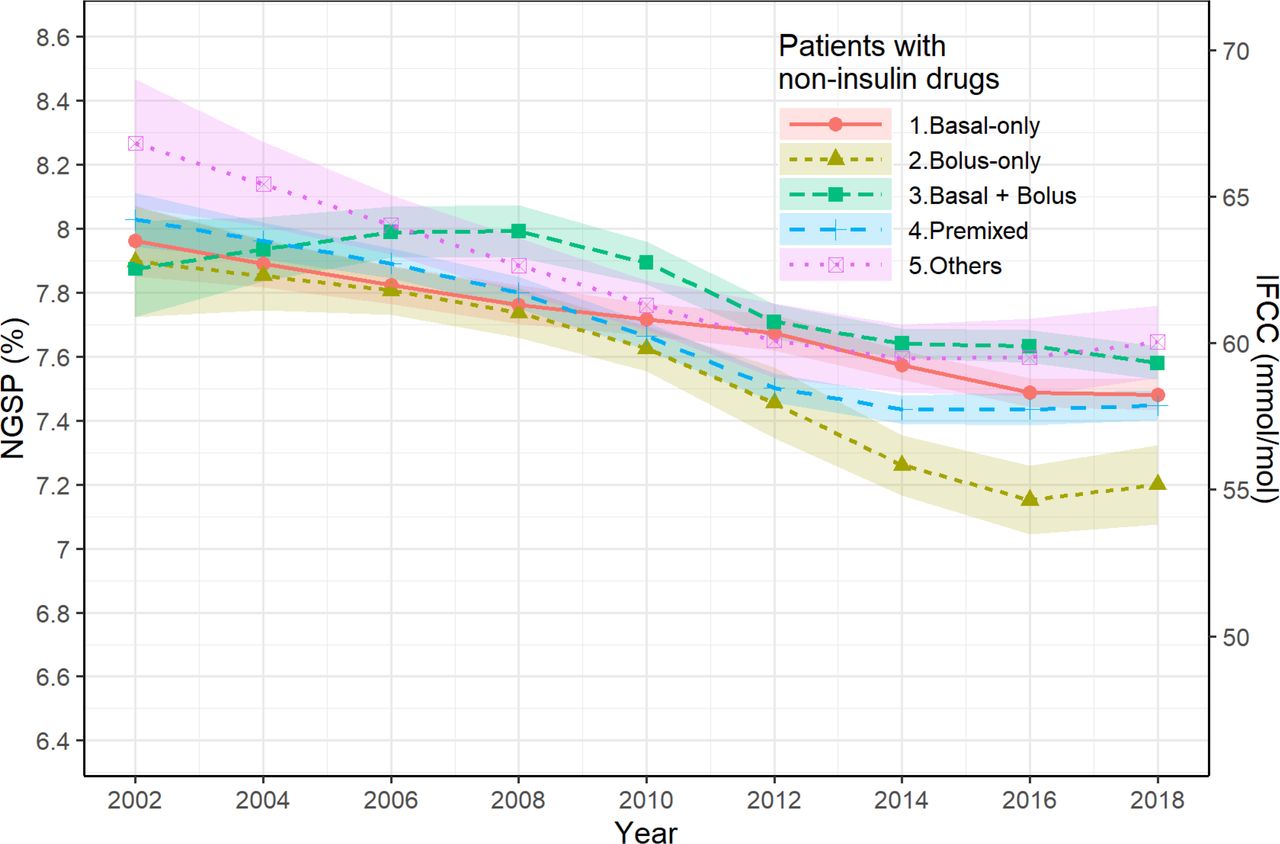
With regard to insulin regimen, among those using non-insulin drugs, the proportion of basal only and basal bolus increased, while that of bolus only and premixed decreased (table 1). The adjusted slopes of HbA1c level by insulin regimen are shown in figure 3. The basal bolus group showed an increase in HbA1c until 2008 and a decrease thereafter, while a gradual decrease in HbA1c was observed in the other regimen groups. After 2014 or 2016, the decrease in HbA1c stabilized and an increase occurred in premixed and bolus groups (online supplemental table 1).

Trends in HbA1c level by insulin regimen in insulin-treated patients using non-insulin drugs, shown as adjusted slopes from 2002 to 2018. HbA1c, glycated hemoglobin A1c; IFCC, International Federation of Clinical Chemistry; NGSP, National Glycohemoglobin Standardization Program.
With regard to insulin regimen, among those not using non-insulin drugs, the majority shifted from premixed (45.4% in 2002) to basal bolus (55.1% in 2018) and the proportion of basal only and bolus only remained small (table 1). Both the basal bolus group and the premixed group showed a gradual decrease in HbA1c until 2014, respectively, and leveled off thereafter (online supplemental figure 1 and online supplemental table 1).
Supplemental material
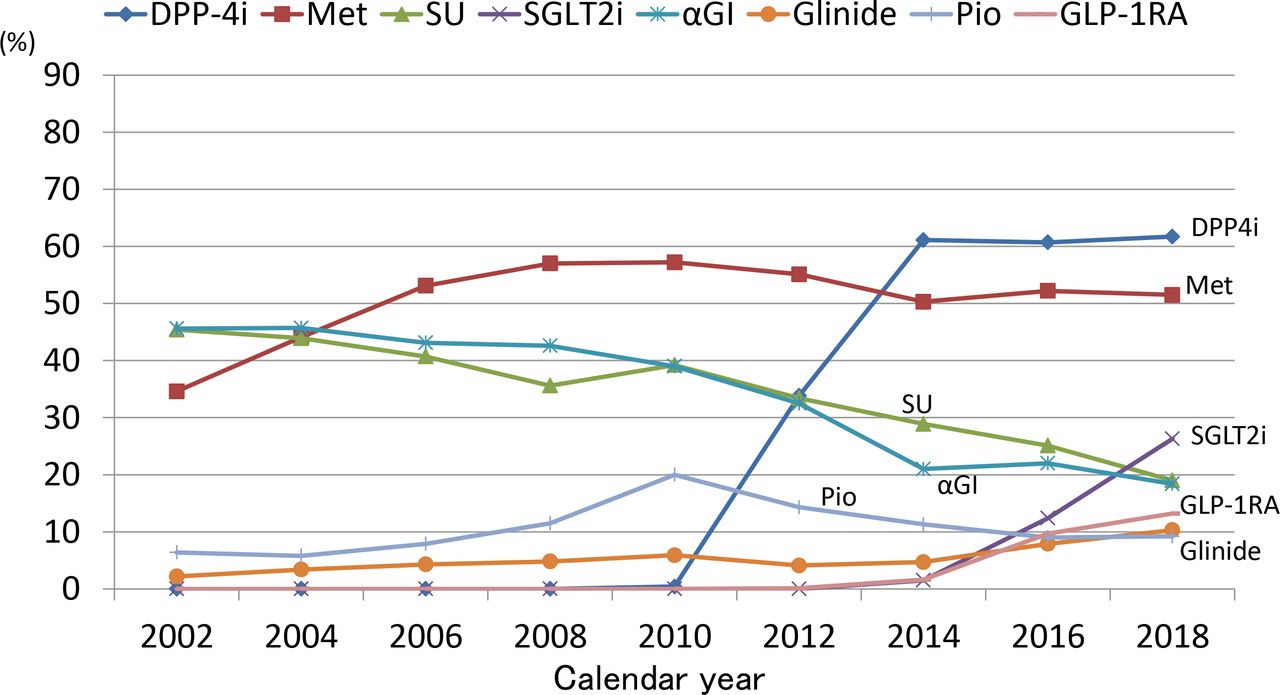
Changes in the proportion of concomitantly used non-insulin drugs in addition to insulin from 2002 to 2018 are shown in figure 4. The proportion of metformin exceeded 50% (51.5% in 2018) overall and that of DPP4i and SGLT2i increased from 2010 and 2014 (up to 61.9% and 26.3% in 2018), respectively. The proportion of GLP-1RA exceeded 10% from 2016 (up to 13.2% in 2018). In contrast, the use of both sulfonylureas and αGI decreased from 46% to 19%.

Changes in the proportion of concomitantly used non-insulin drugs in insulin-treated patients with type 2 diabetes from 2002 to 2018. αGI, α-glucosidase inhibitors; DPP-4i, dipeptidyl peptidase 4 inhibitors; GLP-1RA, glucagon-like peptide 1 receptor agonists; Met, metformin; Pio, pioglitazone; SGLT2i, sodium-glucose cotransporter 2 inhibitors; SU, sulfonylureas.
Discussion
This study demonstrated that the proportion of patients treated with any of non-insulin drugs (insulin+non-insulin drugs and non-insulin drugs only) increased with a secular trend over the last two decades, while the proportion of those with insulin only or with no drugs gradually decreased. HbA1c levels gradually decreased in all groups receiving any of the glucose-lowering drugs, while the level was stable in the group with no drugs. The decline in HbA1c levels in those using any of the glucose-lowering drugs was, however, stalled after 2014 and a slight increase was observed thereafter. In patients treated with insulin, the proportion of those using non-insulin drugs increased markedly and the majority (80.9%) used non-insulin drugs in 2018, that is, most frequently DPP4i (61.7%), followed by metformin (51.5%) and SGLT2i (26.3%). Until now, few studies have investigated trends in glycemic control including patients treated with insulin+non-insulin drugs, as compared with insulin only and non-insulin drugs only. Thus, it is worthwhile to investigate the secular trend in glycemic control in patients treated with insulin+non-insulin drugs compared with those receiving other treatments, including the new drugs DPP4i, GLP-1RA, and SGLT2i.
The stalled decrease in HbA1c after 2014 found in this study was consistent with the trend observed in other countries.12 13 This is partly explained by a change in practice guidelines.1–3 The JDS announced that individualization of the glycemic target should be taken into account, which includes age, duration of diabetes, risk of hypoglycemia, cognitive function, and basic/instrumental activities of daily living.3 The risk of hypoglycemia increases with aging and it must be particularly avoided in elderly patients. Furthermore, the stall likely reflected a finding of major clinical trials that intensive glycemic control (HbA1c level <6.0% or <6.5%) had no cardiovascular benefit and increased the risk of hypoglycemia,16 17 which prompted us to renew support for individualized glycemic targets.
The decrease in HbA1c from 2002 among insulin-treated patients may be explained by a large shift of insulin from human to analog and an increase in use of long-acting (basal) insulin in combination with non-insulin drugs. Prandial insulin analog, as compared with human regular insulin, has faster onset and offset of insulin effect. Basal insulin analog, as compared with human NPH insulin, has longer duration of action, less variability, higher predictability, less hypoglycemia (especially nocturnal), and favorable effect on weight.18 19 It was shown that an addition of a long-acting analog insulin to oral therapy (metformin+sulfonylurea) caused significantly less hypoglycemia and less weight gain than NPH while achieving equivalent glycemic control.4 5 Furthermore, a study which compared adding biphasic insulin aspart two times per day, prandial insulin aspart three times a day, or basal insulin detemir to metformin and sulfonylurea indicated that basal insulin detemir was associated with fewer hypoglycemic episodes and less weight gain, despite fewer patients achieving an HbA1c below 6.5% than others.20 These studies facilitated earlier and effective insulin use in routine medical practice. Reversely, the addition of oral agents to insulin therapy has also been reported. Physiologic evidence for combining metformin or pioglitazone with insulin was shown in terms of insulin-sparing actions and tissue insulin-sensitizing effects.6 7 21 Accordingly, the addition of metformin or pioglitazone to insulin increased up to 2010 in the present study. Apart from the merits of analog insulin, a recent report suggested switching from analog to human insulin.19 22 Analog insulin is very convenient, with a more physiologic action, but human insulin costs less with a small increase in HbA1c. This may raise concerns in the future.
Alternatively, the constant decrease of HbA1c in patients with non-insulin drugs from 2002 may be partly explained by a shift of patients to insulin-treated groups, that is, the addition of basal analog insulin to a failure of oral therapy. Furthermore, there were several factors which led to a decrease in HbA1c in patients with non-insulin drugs. The use of metformin increased throughout the period, with a maximal dose permitted from 1500 mg to 2250 mg from 2010 in Japan. The use of pioglitazone also increased from 2002 to 2010, which could induce better glycemic control in combination with metformin with less weight gain than pioglitazone alone.23 The combination of multiple non-insulin drugs undoubtedly contributed to the decrease of HbA1c in patients with non-insulin drugs.24
After the introduction of DPP4i from 2009, the three new drugs DPP4i, GLP-1RA, and SGLT2i likely had a great impact not only on improving glycemic control, but also on the distribution of insulin and non-insulin drugs. Notably, compared with other countries, the use of DPP4i, GLP-1RA, and SGLT2i was high in our patients both with and without insulin use: 62% and 70% for DPP4i, 13% and 5% for GLP-1RA, and 26% and 22% for SGLT2i, respectively (data not shown for those without insulin). The percentages of using DPP4i, GLP-1RA, and SGLT2i were 40%, 13%, and 27% in the UK by 2016,25 20%, 12%, and 7% in the USA by 2016,26 and 31%, 9%, and 1% in Singapore by 2017,27 respectively. DPP4i alone or in combination with metformin steadily decreases HbA1c,28 reduces the dose of insulin and sulfonylureas with less risk of hypoglycemia, and improves glycemic control in insulin-treated patients.29 30 One explanation for the greater use of DPP4i in Japan may be that DPP4i is more efficacious for Asian (especially Japanese) than non-Asian patients.31–33 Incretin-based therapies were likely attributable to the decreased use of bolus only and premixed regimens (ie, decreased use of prandial and premixed insulin) due to the effect on inhibiting postprandial hyperglycemia. The three new drugs were also likely to have caused the decreased use of sulfonylureas, αGI and pioglitazone, in line with reports from other countries.8 25–27 These new drugs could offer much better glycemic control with decreasing postprandial hyperglycemia, less hypoglycemia, and less weight gain, and often provide benefits with a smaller dose of insulin in insulin-treated patients.34–36 Clinical advantages and adverse effects should be taken into consideration for individualization of glycemic control, cost-effectiveness, and health management to explore the positioning of these new drugs within older established therapies.37
There were some limitations to this study that must be addressed. First, we were unable to incorporate data on hypoglycemia. All subjects attended clinics every 1–2 months and the risk of hypoglycemia was evaluated at each visit according to practice guideline; however, the criteria for hypoglycemia were not predefined in the study and the frequency was not included in the database. We believe that the prescription patterns of each physician were modified to avoid hypoglycemia. Second, we did not perform subanalyses of glycemic control according to the combination of drugs and stratification by age and body mass index in the present study. Young age and obesity are important determinants of trends in glycemic control, as shown in previous studies,9 38 39 and clinical parameters associated with metabolic syndrome, including blood pressure and lipid profiles as well as body weight and use of blood pressure-lowering and lipid-lowering drugs, should be investigated when assessing trends in glycemic control in future studies. Third, doses and time of daily insulin injection in connection with the three new drugs should also be investigated in future studies. Fourth, potential bias or imprecision in our results may be lessened because the present data were obtained from more than 50 clinics in primary care setting from each area in Japan. Therefore, the trends in glycemic control and use of medications were likely representative of Japan, although the bias caused by physicians specializing in diabetes care directed to incorporating up-to-date knowledge should be taken into account. Fifth, the number of patients markedly increased from 2002 to 2010 because the number of participating clinics has increased since 2001 after the foundation of JDDM. The marked increase in the number of patients unlikely affected the main results of the study because every clinic had simultaneously shared common medical knowledge and information connected to the JDS in the same period. Finally, the interpretation of the results of this study in comparison with those in other countries, that is, external validity, may be limited due to differences in medical insurance systems and frequency of clinic visits between countries. Patients with type 2 diabetes visit clinics every 1–2 months in Japan and 3–6 months in Western countries. However, under the same conditions in terms of availability of analog insulin and new drugs, we believe that investigation on such trends will stimulate future studies on individualized care.
In conclusion, during the past two decades, an improvement in glycemic control in Japanese patients with type 2 diabetes treated with insulin only, insulin+non-insulin drugs, and non-insulin drugs only was observed, which leveled off after 2014. In patients on insulin therapy, shifting from human to analog insulin occurred, concomitant use of non-insulin drugs increased, including DPP4i followed by metformin and SGLT2i, and the proportion of insulin only decreased. Future studies are needed to investigate trends in glycemic control in association with other confounding factors.
Data availability statement
Data are available upon reasonable request.
Ethics statements
Patient consent for publication
Ethics approval
This study involves human participants and was approved by the JDDM ethical committee (approval number 2021-4). The study was performed in accordance with Helsinki Declaration II. Participants gave informed consent to participate in the study before taking part.
Acknowledgments
The authors thank Sanae Horiguchi-Watanabe, Risa Sasajima-Yamashita, Suguho Takahashi (Jiyugaoka Medical Clinic), and Daisuke Mutou (JDDM Data Center, Tsukuba, Japan) for skillful data collection and analyses.
References
Supplementary materials
Supplementary Data
This web only file has been produced by the BMJ Publishing Group from an electronic file supplied by the author(s) and has not been edited for content.
Footnotes
Collaborators The following physicians from the JDDM study group contributed to the present study (by prefecture, in alphabetical order): (Hokkaido) Dr. Atsushi Hasegawa, Dr. Masakazu Kato, Dr. Yoshio Kurihara, Dr. Naoki Manda, Dr. Kazuhiro Miyazawa, Dr. Tetsuya Moriai, Dr. Kenichi Tsuchida, Dr. Daishiro Yamada, Dr. Hiroki Yokoyama, and Dr. Haruhiko Yoshimura; (Aomori) Dr. Makoto Nakazono; (Iwate) Dr. Yasushi Ishigaki and Dr. Yoshihiko Takahashi; (Miyagi) Dr. Fuminobu Okuguchi; (Yamagata) Dr. Hiroshi Yamaguchi; (Fukushima) Dr. Takashi Ajihara; (Ibaraki) Dr. Takeshi Osonoi, Dr. Miyoko Saito, Dr. Katsuya Yamazaki, and Dr. Koichi Kawai; (Chiba) Dr. Shigetake Ko, Dr. Susumu Nakamura, Dr. Akira Tsuruoka, and Dr. Daigaku Uchida; (Tokyo) Dr. Mitsutoshi Kato, Dr. Hiroshi Takamura, Dr. Osamu Tomonaga, and Dr. Akio Ueki; (Kanagawa) Dr. Koichi Hirao, Dr. Kotaro Iemitsu, Dr. Akira Kanamori, Dr. Hajime Maeda, Dr. Masahiko Takai, and Dr. Hiroshi Takeda; (Niigata) Dr. Masato Takaki; (Toyama) Dr. Hikari Suzuki; (Nagano) Dr. Yuki Kono; (Shizuoka) Dr. Sumio Kato; (Mie) Dr. Hiroshi Hayashi, (Shiga) Dr. Atsunori Kashiwagi, Dr. Hiroshi Maegawa, and Dr. Ituko Miyazawa; (Nara) Dr. Akiko Hosokawa and Dr. Takashi Noto; (Yamaguchi) Dr. Koichi Iwasaki; (Kagawa) Dr. Masahiro Iwamoto; (Fukuoka) Dr. Masae Minami, Dr. Hiroshi Ninomiya, Dr. Kokichi Tanaka, and Dr Yoshifumi Yokomizo; (Kumamoto) Dr. Kohei Yamaguchi; (Oita) Dr. Katsushige Abe, and Dr. Nobuyuki Abe; (Miyazaki) Dr. Nobuki Yano; (Kagoshima) Dr. Michiko Chosa; (Okinawa) Dr.Noriharu Yagi and Dr. Takako Arakaki. Writing goups; HY, SA, and HM.
Contributors HY, S-iA, and HM designed the study. HY, KY, KK, S-IS, MO, AK, and NY generated the data. HY, S-iA, DK, and AS performed the statistical analysis. All authors contributed to the interpretation of the data. HY, S-iA, and HM drafted the manuscript. HY takes responsibility for the statistical method, and organizing and performing the multivariate analysis. All authors critically reviewed the manuscript. HY is the guarantor of this work and as such had full access to all data in the study and takes responsibility for the integrity and accuracy of the data analysis.
Funding The research reported in this publication was supported by the Japan Society for the Promotion of Science (KAKENHI grant number JP19K10483) and a research program grant from the Japan Diabetes Society.
Competing interests None declared.
Provenance and peer review Not commissioned; externally peer reviewed.
Supplemental material This content has been supplied by the author(s). It has not been vetted by BMJ Publishing Group Limited (BMJ) and may not have been peer-reviewed. Any opinions or recommendations discussed are solely those of the author(s) and are not endorsed by BMJ. BMJ disclaims all liability and responsibility arising from any reliance placed on the content. Where the content includes any translated material, BMJ does not warrant the accuracy and reliability of the translations (including but not limited to local regulations, clinical guidelines, terminology, drug names and drug dosages), and is not responsible for any error and/or omissions arising from translation and adaptation or otherwise.