Article Text

Abstract
Introduction Several new oral drug classes for type 2 diabetes (T2DM) have been introduced in the last 20 years accompanied by developments in clinical evidence and guidelines. The uptake of new therapies and contemporary use of blood glucose-lowering drugs has not been closely examined in Canada. The objective of this project was to describe these treatment patterns and relate them to changes in provincial practice guidelines.
Research design and methods We conducted a longitudinal drug utilization study among persons with T2DM aged ≥18 years from 2001 to 2020 in British Columbia (BC), Canada. We used dispensing data from community pharmacies with linkable physician billing and hospital admission records. Laboratory results were available from 2011 onwards. We identified incident users of blood glucose-lowering drugs, then determined sequence patterns of medications dispensed, with stratification by age group, and subgroup analysis for patients with a history of cardiovascular disease.
Results Among a cohort of 362 391 patients (mean age 57.7 years old, 53.5% male) treated for non-insulin-dependent diabetes, the proportion who received metformin monotherapy as first-line treatment reached a maximum of 90% in 2009, decreasing to 73% in 2020. The proportion of patients starting two-drug combinations nearly doubled from 3.3% to 6.4%. Sulfonylureas were the preferred class of second-line agents over the course of the study period. In 2020, sodium-glucose cotransporter type 2 inhibitors and glucagon-like peptide-1 receptor agonists accounted for 21% and 10% of second-line prescribing, respectively. For patients with baseline glycated hemoglobin (A1C) results prior to initiating diabetic treatment, 41% had a value ≤7.0% and 27% had a value over 8.5%.
Conclusions Oral diabetic medication patterns have changed significantly over the last 20 years in BC, primarily in terms of medications used as second-line therapy. Over 40% of patients with available laboratory results initiated T2DM treatment with an A1C value ≤7.0%, with the average A1C value trending lower over the last decade.
- diabetes mellitus, type 2
- drug utilization
- health services research
- practice guideline
Data availability statement
Data may be obtained from a third party and are not publicly available. Data used in this study may be obtained from a third party (Population Data BC) and are not publicly available.
This is an open access article distributed in accordance with the Creative Commons Attribution Non Commercial (CC BY-NC 4.0) license, which permits others to distribute, remix, adapt, build upon this work non-commercially, and license their derivative works on different terms, provided the original work is properly cited, appropriate credit is given, any changes made indicated, and the use is non-commercial. See: http://creativecommons.org/licenses/by-nc/4.0/.
Statistics from Altmetric.com
WHAT IS ALREADY KNOWN ON THIS TOPIC
The availability of new classes of blood glucose-lowering drugs and evolving guideline recommendations have increased the complexity of treatment options for patients with type 2 diabetes and physicians. Contemporary trends in pharmacologic treatment patterns for type 2 diabetes mellitus in British Columbia (BC) are not well described.
WHAT THIS STUDY ADDS
Our findings provide an overview of how treatment patterns have transformed with the availability of new classes of medications and evolving guidelines and clinical evidence. Treatment with sulfonylureas was the preferred drug class for second-line therapy over the last 20 years and remains so, although new classes of medications are increasingly being used. The prevalence of combination therapy is increasing as first and second-line choice. The average baseline glycated hemoglobin value at treatment initiation has trended lower over the last decade.
HOW THIS STUDY MIGHT AFFECT RESEARCH, PRACTICE OR POLICY
The complexity of treatment choice reflects the availability of new classes of medications, Pharmacare coverage policies, guideline recommendations to individualize treatment based on patient characteristics, lower glycated hemoglobin thresholds to initiate treatment, and lower glycated hemoglobin targets. Sulfonylureas remain the most common second-line treatment despite the availability of potentially safer and more effective alternatives, emphasizing the need for continued knowledge translation and quality improvement aimed at improving diabetes pharmacotherapy in BC.
Introduction
Paths of treatment for type 2 diabetes mellitus (T2DM) have become increasingly complex with the availability of new medication classes and accompanying updates in clinical evidence and practice guidelines. T2DM is one of the most prevalent chronic conditions globally, including in Canada.1 It is estimated that approximately 8.8% of Canadians were living with diabetes in 2019,2 up from an estimated 4.8% in 2002.3 Approximately 90% of all diabetes diagnoses are type 2 diabetes.4 T2DM has a substantial economic burden attributable to severe microvascular and macrovascular complications (eg, blindness, cardiovascular disease (CVD)).5 6 Diabetes cost is a burden on Canada’s healthcare system, with an estimated annual direct cost of almost $4 billion; this amount is expected to reach almost $5 billion by 2030.7
Different classes of drugs, both oral and parenteral preparations, are widely available and effectively manage type 1 and type 2 diabetes. They are classified according to the mechanisms through which they reduce blood glucose, and include insulins, biguanides, sulfonylureas (SUs), meglitinides (glinides), alpha-glucosidase inhibitors (AGIs), thiazolidinediones (TZDs), incretin-dependent therapies such as glucagon-like peptide-1 receptor agonists (GLP1a) and dipeptidyl peptidase-4 inhibitors (DPP4i), sodium-glucose cotransporter type 2 inhibitors (SGLT2i), and combinations thereof.8 Newer agents such as SGLT2i and GLP1a have demonstrated clinical benefits among persons with T2DM, such as reduced risk of cardiovascular (CV) events among those with CVD, or slowing progression of chronic kidney disease.9–16 In contrast, evidence of clinical benefit is lacking for other classes (eg, DPP4i) while there is potential for harm and unclear benefit from others (eg, hypoglycemia from SUs among older persons).17–20
Practice guidelines regularly evaluate the efficacy and safety of medications to treat T2DM, thresholds to initiate treatment, and glycated hemoglobin (A1C) targets, in the face of evolving evidence. Diabetes Canada guidelines were updated in 2013, 2018, and again in 2020, to incorporate new evidence and treatments.21–23 The patterns of medication usage for T2DM in the face of evolving evidence and contemporary guideline updates have not been evaluated recently in British Columbia (BC). Contemporary data on blood glucose-lowering drug utilization are needed to provide insight into the current profile of patients with T2DM and their drug management. Such information will have substantial public health and clinical implications in understanding the need for implementation of local policies, education, and quality improvement initiatives for people residing in BC with resultant improvement in health and well-being of persons living with T2DM.
The objectives of this project were: (1) to describe blood glucose-lowering drug utilization patterns over the last 20 years in BC, and (2) to examine incident use of T2DM medication in relation to baseline A1C.
Methods
Study setting
We conducted a longitudinal and cross-sectional retrospective study using data obtained between 1996 and 2020 from the BC Ministry of Health Healthideas database that include dispensing data from all community pharmacies in the province.24 This database has been a source for multiple observational studies25 26 and includes information on patient demographics, drug dispensing records, outpatient physician fee-for-service claims, hospital admissions, and laboratory test results (from 2011 onwards). Detailed information on the dispensed medication, dispensing date, quantity and number of dispensed days supply is available in the database. Medication dispensing records for federally insured patients (military veterans, RCMP and their families) and beneficiaries of the First Nations Health Benefits Program were not available. Our research is presented in accordance with the Reporting of studies conducted using observational routinely-collected data guidelines.27
Classification of medications to treat T2DM
Blood glucose-lowering drugs were identified and classified according to Anatomical Therapeutic Chemical codes. Drug categories included: AGIs (A10BF), biguanides (A10BA), combinations of oral blood glucose-lowering drugs (A10BD), DPP4i (A10BH), GLP1a (A10BJ), insulins and analogues for injection (A10AB–A10AE), meglitinides (A10BX), SGLT2i (A10BK), SUs (A10BB), and TZDs (A10BG).
Study population
The cohort was comprised of people who received their first-ever dispensing of a non-insulin blood glucose-lowering drug during the study period (January 01, 2001–December 31, 2020). Data from January 01, 1996 were used to determine first use. The date of the first dispensed blood glucose-lowering drug was selected as the cohort entry date. Patients were eligible for inclusion in the study if they had at least 3 months of Medical Service Plan (MSP) eligibility as of cohort entry date. Patients were excluded if they were younger than 18 years old at cohort entry, had one physician visit or one hospitalization with a diagnosis of polycystic ovary syndrome (International Classification of Diseases, Ninth Revision (ICD-9): 256.4, ICD-10: E28.2) within 5 years of cohort entry date (to exclude people using biguanides for this indication instead of T2DM), had insulin dispensed any time prior to cohort entry, were federally insured or formerly federally insured (military veterans, RCMP and their families, and beneficiaries of the First Nations Health Benefits Program). To minimize the risk of possible type 1 diabetes misclassification, individuals who were initially treated with insulin as monotherapy during the study period were also excluded.
Defining sequence of therapy
Treatment initiation was defined as an initial dispensing of a non-insulin blood glucose-lowering drug between January 01, 2001 and December 31, 2020, in the absence of any blood glucose-lowering drug dispensed in the 5 years prior. We determined if a subsequent dispensing represented continuous therapy, concomitant therapy, or switch of therapy by examining use of the first medication and the date of the subsequent medication. The duration of a prescription was defined using the dispensed days supply, a mandatory pharmacist-entered field in the province’s PharmaNet system, and full patient compliance was assumed. A follow-up dispensing of the same medication class within 30 days of the end of days supply was considered continuous therapy. The 30-day buffer allows for any gaps that may occur due to irregular filling patterns. Therapy discontinuation occurred when a patient was not dispensed another within-class medication within 30 days of the end of days supply. We defined add-on therapy when medication from a different class was dispensed within 30 days of a prescription of another class. We defined therapy switch as a medication from a different medication class being dispensed after discontinuation occurs. The discontinuation date was the date when the days supply ran out, not including the 30-day buffer period. Additionally, discontinuation of an individual medication class previously a component of concomitant therapy was considered a subsequent line of therapy. Patients were followed from treatment initiation until the end of continuous health plan enrollment (defined as a gap >30 days), death, or end of data availability (December 31, 2020).
Statistical analysis
Descriptive statistics were used to summarize the characteristics of people in BC treated for T2DM with oral pharmacotherapy, and stratified by 5-year periods in calendar time to provide understanding of secular trends over time. A1C values were summarized for the most recent laboratory test in the 6 months prior to cohort entry. Treatment patterns and characteristics for patients with a history of CVD were explored further. CVD was defined as having one hospital admission or two physician visits with a diagnosis of ischemic heart disease or heart failure, or a procedure code for a percutaneous coronary intervention or coronary artery bypass grafting. Intensity of treatment initiation in patients with elevated A1C was also described.
Sequence of therapy was determined for each patient in the cohort using SAS V.9.4 (SAS Institute). We reported the most frequent therapy initiation and the most frequently observed three-step combinations of therapy, by period of cohort entry. Using Microsoft Power BI, we presented the three-step therapy sequence as a Sankey diagram to visualize the treatment paths of the study cohort.28 Therapy sequences with under 10 patients were not included. The Sankey diagram was presented on the logarithmic scale to accurately visualize both common and atypical treatment paths. The study protocol and associated programming code are available from the lead author upon request.
Results
Baseline characteristics
A total of 402 318 patients received their first-ever prescription for a non-insulin antidiabetic medication during the study period (2001–2020). We excluded 2379 patients who were <18 years of age, 5739 patients with a diagnosis of polycystic ovary syndrome in the 5-year period prior to cohort entry, 13 716 patients with an insulin dispensing prior to cohort entry, 13 768 patients with less than 3 months of MSP insurance eligibility, 4325 patients federally insured or beneficiaries of the First Nations Health Benefits plan during the study period. Our study cohort included 362 391 eligible patients (figure 1).

Study flow chart. MSP, Medical Service Plan.
As shown in table 1, mean age at the cohort entry date was 57.7 (SD=14.3) and 53.5% were male (table 1). At the time of cohort entry, 32.7% were aged 65 years or over. Age and sex distributions were consistent throughout the study period. A diagnosis of T2DM prior to or on the date of cohort entry was identified in 79.2% of patients. Gestational diabetes was identified in 0.3% of the study cohort. The mean number of days from therapy initiation until adding or switching therapy was 1102 days. Laboratory results were not widely available until 2011. A1C values were available within 6 months prior to cohort entry for 43.5% of patients who entered the cohort between 2011 and 2015, and for 75% of patients who entered the cohort between 2016 and 2020. In patients with available A1C laboratory results, 41.0% had a value of ≤7.0%, and 26.8% had a value >8.5%, immediately preceding initiation of an antidiabetic agent (figure 2). The mean A1C value for those initiating therapy decreased between 2011 and 2020 (table 2).
Baseline characteristic of blood glucose-lowering drugs
Glycated hemoglobin test values by year of cohort entry

Glycated hemoglobin value immediately preceding treatment initiation.
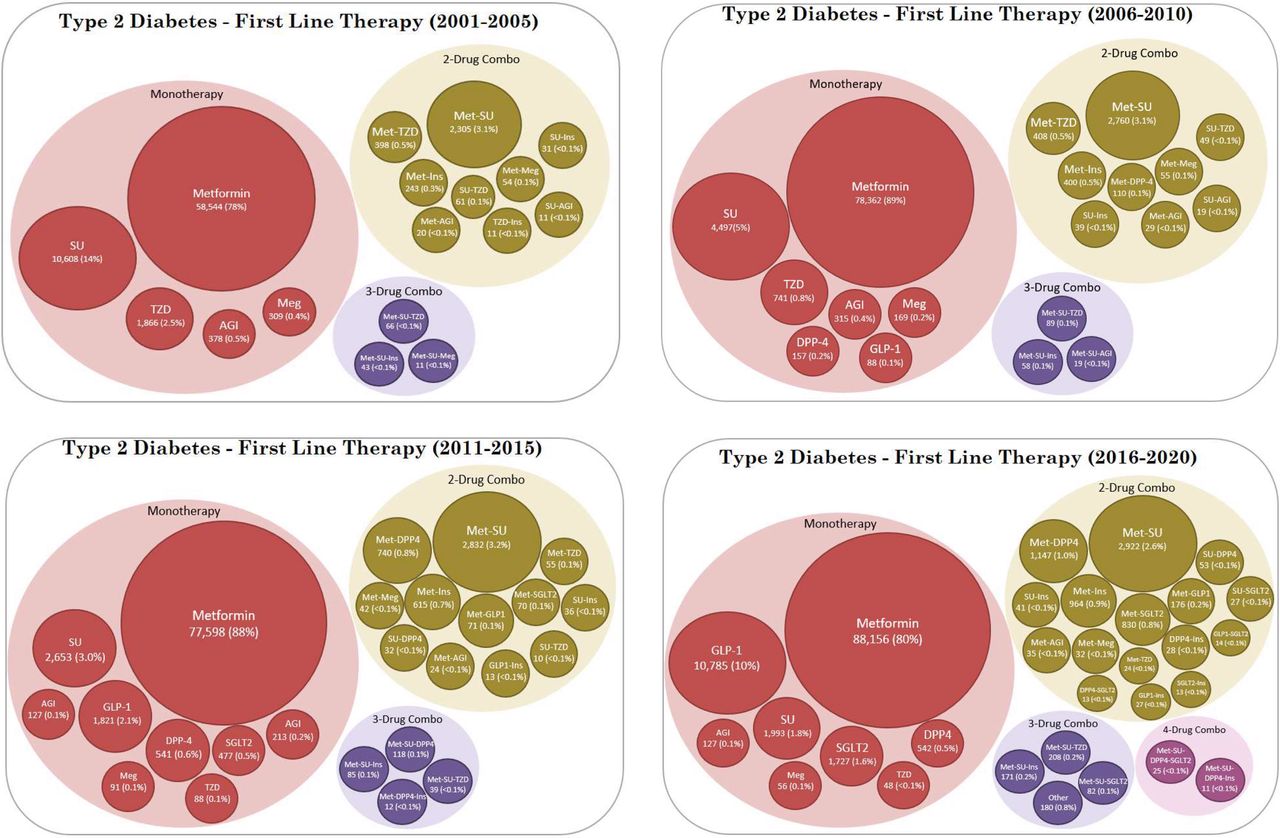
First-line therapy stratified by cohort entry period is shown in figure 3. Metformin monotherapy was the most frequently observed first-line treatment throughout the study period, although the proportion of metformin monotherapy use declined from a peak of 90% in 2009 to 73% in 2020 (figure 4). The most common alternative to metformin monotherapy as a first-line treatment was SU (14%) in 2001–2005, SU (5%) in 2006–2010, metformin–SU combination (3%) in 2011–2015, and GLP1a (10%) in 2016–2020. As new drug classes entered the market, a wider variety of prescribing for first-line therapy was observed, with multidrug combinations as first-line therapy rising from 4.4% in the 2001–2005 period to 6.4% in the 2016–2020 period.

First-line therapy by period of cohort entry. AGI, alpha-glucosidase inhibitor; DPP4, dipeptidyl peptidase-4; GLP1, glucagon-like peptide-1 receptor; Ins, insulin; Meg, meglitinide; Met, metformin; SGLT2, sodium-glucose cotransporter type 2; SU, sulfonylurea; TZD, thiazolidinedione.
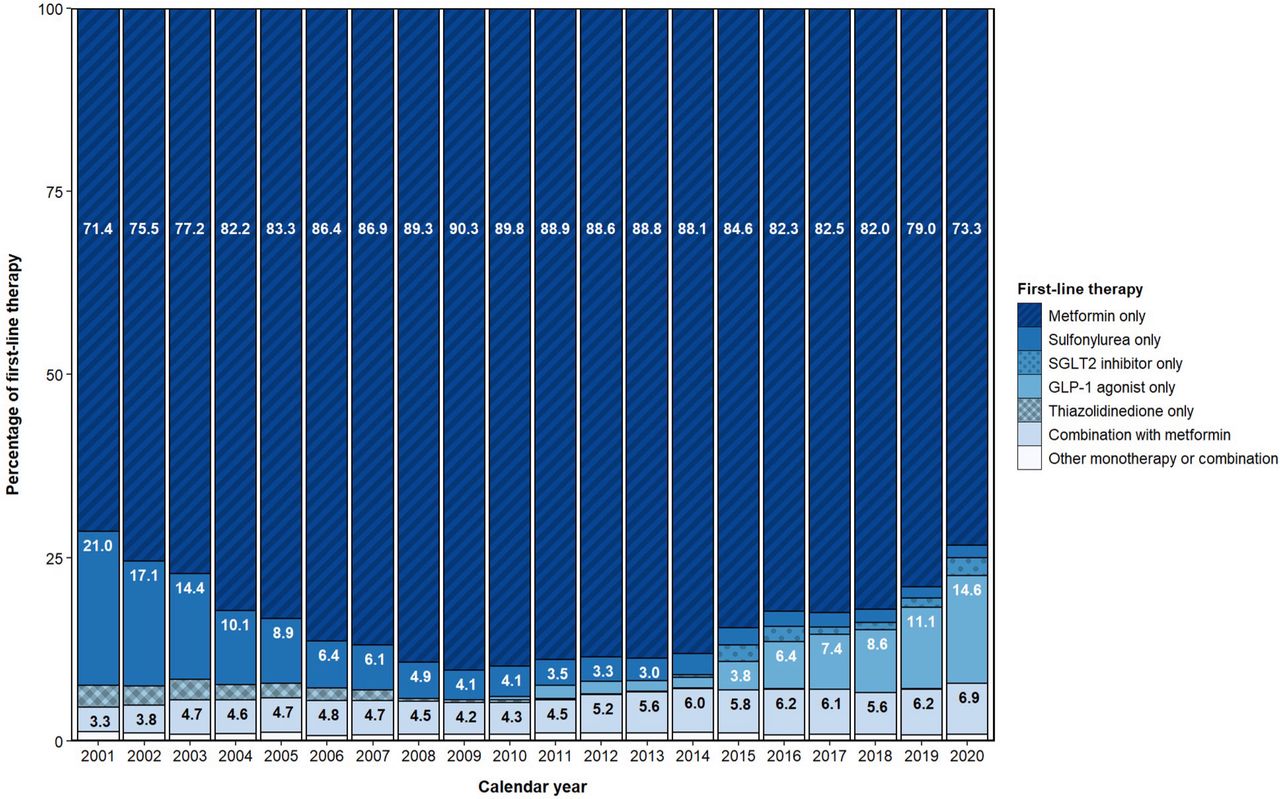
Annual proportion of incident users of blood glucose-lowering drugs. GLP1, glucagon-like peptide-1 receptor; SGLT2, sodium-glucose cotransporter type 2.
The proportion of drug classes used for second-line therapy during the study period is presented in figure 5. SUs were the most common second-line therapy each year throughout the study period, although it decreased over the study period as DPP4i, SGLT2i, and GLP1a entered the market. After Health Canada approval in 2014, SGLT2i quickly became the second highest used drug class for second-line therapy, accounting for 18.5% of second-line use in 2015 and 20.8% in 2020. Use of GLP1a as second-line therapy steadily increased from 2015 to 2020, accounting for 9.7% of second-line use in 2020. Use of DPP4i as second-line therapy peaked at 20.0% in 2014, and declined in recent years down to 8.0% in 2020. Second-line insulin use was between 4.7% and 9.0% throughout the study period. Next to SUs, TZDs were the most used second-line therapy between 2001 and 2007, before use declined and became negligible by 2010. Similar patterns of second-line use were observed in patients with a history of CVD.

Second-line prescribing of blood glucose-lowering drugs post-metformin monotherapy. DPP4, dipeptidyl peptidase-4; GLP1, glucagon-like peptide-1 receptor; SGLT2, sodium-glucose cotransporter type 2.
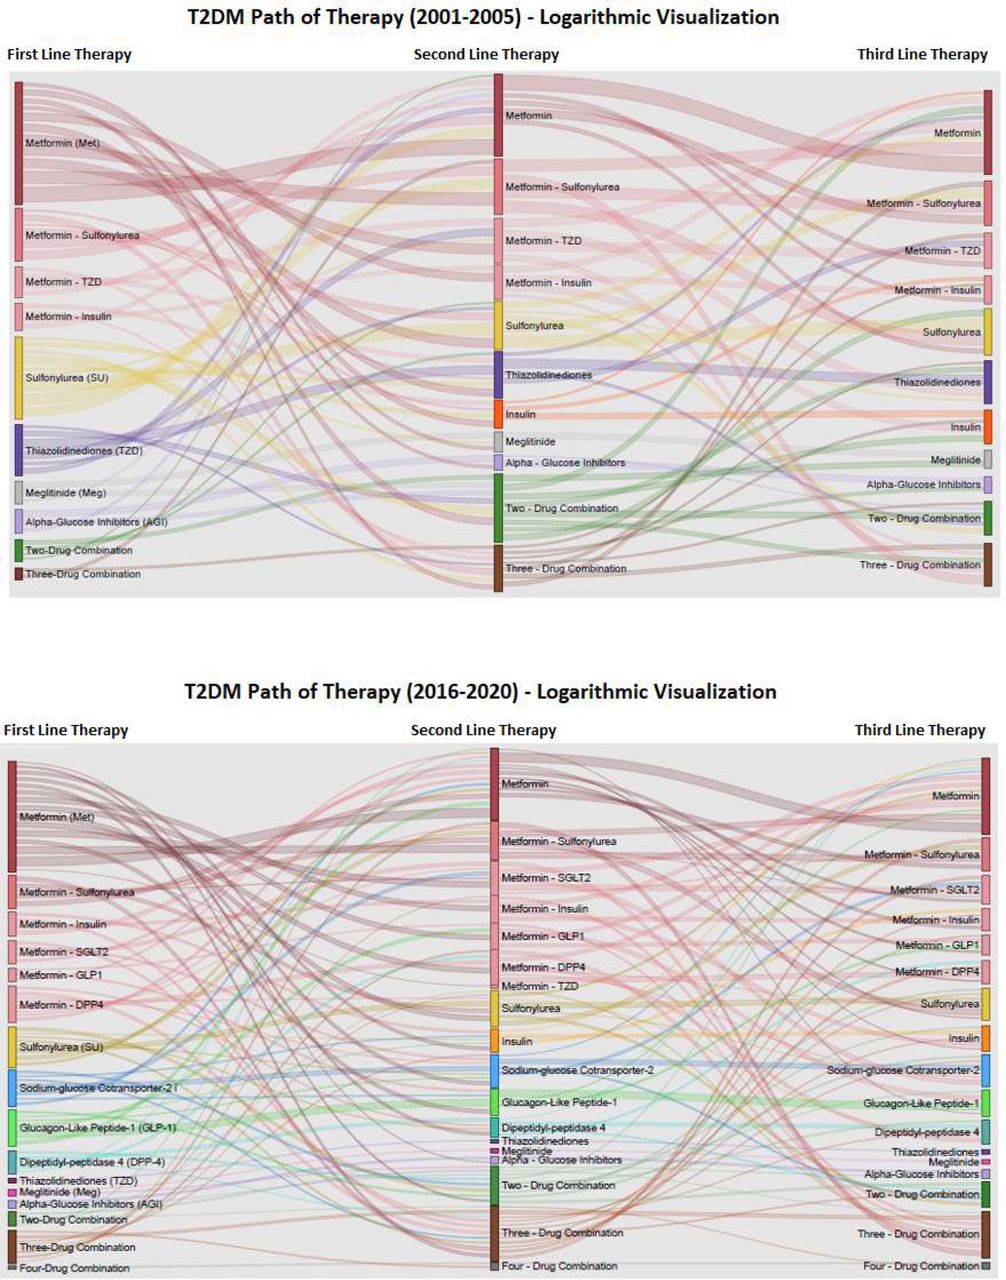
The Sankey diagrams in figure 6 show the most frequently observed pharmacologic treatment sequences on the logarithmic scale for the earliest period (2001–2005) and latest period (2016–2020) of cohort entry. The sequence of therapy visualization shows the increased complexity of treatment patterns between the earliest and latest period. Among 75 002 patients in the earliest period, there were 617 unique three-step combinations of therapy of which 124 were included in the diagram for having at least 10 patients. Among 110 560 patients in the latest period, there were 1563 unique three-step combinations of therapy of which 224 were included for having at least 10 patients. The availability of new medication classes can be seen in the most recent period, particularly with the number of medications used concomitantly with metformin, although metformin plus SU remained the most frequently observed combination therapy.
Path of therapy: blood glucose-lowering drug use by cohort entry period. T2DM, type 2 diabetes mellitus.
Discussion
This is the first large-scale study to investigate blood glucose-lowering drug utilization patterns in BC in over a decade. Baseline characteristics for new users of oral agents did not substantially differ across the 20-year study period. Metformin monotherapy was the most frequently observed first-line treatment over the study period, and SUs were the most common medication class for second-line treatment and remained so in 2020. Among those with an A1C value available prior to cohort entry, we found over 40% initiated treatment with a relatively low A1C value (≤7.0%). We observed an uptake in second-line use of new medication classes after their approval, including DPP4i, GLP1a and SGLT2i. The wide variety in treatment pathways highlights the increasing complexity of drug therapy regimens among persons with T2DM.
The Canadian Network for Observational Drug Effect Studies (CNODES) evaluated blood glucose-lowering drug utilization trends among patients with type 2 diabetes in four Canadian provinces, including Manitoba, Ontario, Quebec and Saskatchewan.29 The study found a secular increase in total blood glucose-lowering drug prescription rates in all study provinces except Saskatchewan during the study period from 1993 to 2013. Due to the perceived safety and lack of effect on weight gain, metformin gained popularity as a monotherapy and combination therapy after the 1990s.30 Moreover, TZDs grew in popularity from the onset of their availability until 2006, at which point they rapidly declined as the increased risk of myocardial infarction and CV mortality for rosiglitazone surfaced.31 Utilization of DPP4i was also found to increase after its marketing in 2008. Although the CNODES served as a valuable resource for illustrating Canada‐wide blood glucose-lowering drug utilization, in which provincial variances in drug utilization were evaluated simultaneously, data from BC were not included. The rise and fall of TZD prescribing in the early 2000s and growth of DPP4i observed by the CNODES are consistent with the prescribing patterns identified in our study during the same period. The rapid growth of SGLT2i and increased use of GLP1a observed in our study occurred in more recent years, beyond the study period of the CNODES. However, an international drug utilization study including data on 30 849 persons in Canada up to 2017 found that SGLT2i use rose from 0.8% in 2014 to 11.6% 2017 among patients aged ≥40 years with T2DM, which is consistent with our findings.32
Guideline recommendations for pharmacologic management of T2DM changed considerably over the study period. In 1998, the Canadian Diabetes Association revised and expanded their 1992 guidelines for the management of diabetes in Canada. Lack of standardization of the hemoglobin A1C test precluded its use in the diagnosis of diabetes. First-line pharmacologic treatment recommendations included monotherapy of an oral AGI, biguanide (eg, metformin) or SU. Combination therapy was not recommended until after 2–4 months of monotherapy.33 In 2008, the Canadian Diabetes Association recommended differentiating first-line treatment choice based an A1C threshold of 9.0%.34 Metformin monotherapy was recommended for most patients, with exception of symptomatic patients with A1C ≥9.0%, where metformin in combination with another agent from a different class, including insulin, was recommended. By 2016, the threshold A1C value had lowered from 9.0% to 8.5% in which first-line treatment choice was differentiated.35 In 2018, the Diabetes Canada Clinical Practice Guidelines expert committee recommended starting metformin plus a second agent if A1C is >1.5% above target.36 The expert committee also recommended intense glycemic control to target A1C ≤7.0% in most people with T2DM to reduce the risk of microvascular and CV complications.36 Additionally, more intensive glucose control of A1C ≤6.5% was recommended for users of blood glucose-lowering drugs with low risk of hypoglycemia and shorter duration of diabetes and longer life expectancy.
A recent manuscript in the BC Medical Journal identified three principal sources of T2DM treatment recommendations for physicians: Diabetes Canada, the Guidelines and Protocols Advisory Committee, and the Therapeutics Initiative.37–39 They found contradictory recommendations on important clinical issues such as A1C targets and pharmacological therapy. The authors also state restrictive Pharmacare coverage complicates physicians’ decisions by paring patient affordability against up-to-date and robust evidence.40 Therefore, the variation in treatment patterns is likely partially attributable to physicians in BC receiving contradictory guideline recommendations and facing formulary restrictions via reimbursement policies.
Our study found an increased use in first-line combination therapy over the study period, particularly combination therapy with metformin. This is likely due to recent guideline recommendations to initiate patients with A1C values ≥1.5% above target with metformin in combination with another blood glucose-lowering medication.22 We also found the proportion of patients initiating metformin–SU combination therapy decreased over the study period as metformin in combination with newer blood glucose-lowering drugs, such as SGLT2i and DPP4i, increased. Recent studies have shown the incidence of hypoglycemia was significantly lower when using combination metformin plus DPP4i versus metformin+SU while comparatively effective for A1C reduction.41 Other studies have found SU use in Canada has trended lower, but not at the same rate as other countries with similar high functioning, publicly funded healthcare systems, such as England and Australia.42 The continued dominance of SUs as second-line therapy despite the availability of potentially safer and more effective alternatives in BC emphasizes the need for further knowledge translation and quality improvement initiatives aimed at improving diabetes pharmacotherapy.
The main strength of our study was the use of the BC Ministry of Health’s Healthideas database, a large population-based administrative database providing comprehensive linkable patient-level data on medication dispensing, fee-for-service physician visits, hospital admissions, and laboratory results. We developed a robust algorithm to identify sequences of T2DM medication treatment for each patient in the study cohort, and applied data visualization tools to illustrate complex treatment patterns over time. Our study also had limitations that warrant discussion. First, patients without T2DM may have been included in the study cohort if their medication use was due to an off-label indication. Second, patients who entered the study cohort in the later years of our study period will have had a shorter follow-up period than patients who entered the study cohort in earlier years. This may limit their treatment patterns and influence some of the treatment sequence results. Third, we know the date and quantity of medications dispensed at community pharmacies, but we do not know with certainty if patients have taken the medications as instructed. We also do not have information on medications dispensed within hospital or as free samples. Finally, there is a possibility of patients with type 1 diabetes and women with gestational diabetes being misclassified as patients with T2DM. However, we have minimized type 1 diabetes misclassification by excluding patients who had an insulin dispensing prior to cohort entry, and we have identified patients with a gestational diabetes diagnosis in the 1-year period prior to cohort entry.
Conclusions
We found increasingly complex treatment patterns in BC for T2DM between 2001 and 2020. Our study showed metformin monotherapy was the prevailing first-line therapy in BC over this period, with decreasing frequency of use in recent years. Second-line SU use declined as SGLT2i and GLP1a use increased up to 2020, although SU remained the most common second-line agent in those with and without CVD. For patients with laboratory results available, over 40% initiated antidiabetic therapy with a baseline A1C value ≤7.0%. Paths of therapy sequencing suggest the availability of new medication classes, contradictory guideline recommendations, and formulary restrictions have shaped a complex treatment decision environment for patients and physicians.
Data availability statement
Data may be obtained from a third party and are not publicly available. Data used in this study may be obtained from a third party (Population Data BC) and are not publicly available.
Ethics statements
Patient consent for publication
Ethics approval
This study involves human participants and was approved by the University of British Columbia Clinical Research Ethics Board (UBC CREB number H21-03240). This study used anonymous administrative data.
Acknowledgments
The British Columbia (BC) Ministry of Health approved access to and use of BC data for this study. Data sources were as follows (https://www2.gov.bc.ca/gov/content/health/conducting-health-research-evaluation/data-access-health-data-central): BC Ministry of Health (creator) (2022): Medical Services Plan (MSP) Payment Information File. BC Ministry of Health (publisher). MOH (2022); BC Ministry of Health (creator) (2022): ClaimsHist (PharmaNet). BC Ministry of Health (publisher). Data Stewardship Committee (2022); Canadian Institute for Health Information (creator) (2022): Discharge Abstract Database (Hospital Separations). BC Ministry of Health (publisher). MOH (2022). BC Ministry of Health (creator) (2022): Consolidation File (MSP Registration & Premium Billing). BC Ministry of Health (publisher). MOH (2022); BC Ministry of Health (creator) (2022): Provincial Laboratory Information Solutions. BC Ministry of Health (publisher). MOH (2022).
References
Footnotes
Contributors GC acquired the data, interpreted the data, and drafted the manuscript. CRD was responsible for the conception and design of the study, acquired funding for the study, and guided data analysis and interpretation. JDK performed the data analysis and assisted with interpretation. All authors contributed to the critical revision of the manuscript for important intellectual content. GC and CRD were responsible for the overall study supervision and are the study guarantors. All authors approved the final version of the manuscript.
Funding The study was funded through a contribution agreement to the University of British Columbia from the British Columbia Ministry of Health.
Competing interests None declared.
Provenance and peer review Not commissioned; externally peer reviewed.