Article Text

Abstract
Introduction Observational studies support the relationship between C-reactive protein (CRP) level and diabetic nephropathy (DN) in patients with diabetes. The research question regarding whether the relationship between serum high-sensitivity C-reactive protein (hsCRP) level and DN is causal lacks experimental evidence. Therefore, this study aimed to evaluate the causality between hsCRP and DN based on Mendelian randomization (MR) analysis.
Research design and methods A total of 2332 participants with type 2 diabetes from the Taiwan Biobank database was analyzed. Genetic risk scores (GRSs), which comprise four validated CRP loci as two instrumental variables, were calculated as unweighted and weighted scores to evaluate the causal relationship of hsCRP with DN risk. The two-stage regression model was used to estimate OR and 95% CI.
Results The analyses of the observational study showed that the hsCRP level was significantly associated with DN after multivariate adjustment (adjusted OR 1.15; 95% CI 1.01 to 1.32). Unweighted/weighted GRSs for log-transformed hsCRP satisfied MR assumptions 1 and 3, respectively; that is, a significant association with hsCRP was observed but that with DN was absent (adjusted OR 1.00, 95% CI 0.92 to 1.09; 1.00, 0.72 to 1.39, respectively). The MR analyses demonstrated that a 1-unit increase in the log-transformed genetically predicted hsCRP by unweighted and weighted GRSs was associated with DN, demonstrating ORs of 1.80 (95% CI 1.51 to 2.14) and 1.67 (95% CI 1.40 to 1.98), respectively.
Conclusions The current study provided experimental evidence that hsCRP level was causally related to DN. These findings suggest that the elevated hsCRP may be a causal risk factor for DN in patients with type 2 diabetes.
- C-Reactive Protein
Data availability statement
All data relevant to the study are included in the article or uploaded as supplementary information.
This is an open access article distributed in accordance with the Creative Commons Attribution Non Commercial (CC BY-NC 4.0) license, which permits others to distribute, remix, adapt, build upon this work non-commercially, and license their derivative works on different terms, provided the original work is properly cited, appropriate credit is given, any changes made indicated, and the use is non-commercial. See: http://creativecommons.org/licenses/by-nc/4.0/.
Statistics from Altmetric.com
WHAT IS ALREADY KNOWN ON THIS TOPIC
Observational studies support the relationship between C-reactive protein (CRP) level and diabetic nephropathy (DN) in patients with diabetes.
However, randomized trials of interventions specific to CRP have not yet been performed to demonstrate the experimental evidence of association between high-sensitivity C-reactive protein (hsCRP) and DN risk.
WHAT THIS STUDY ADDS
This is the first evidence of a causal link between hsCRP and DN using Mendelian randomization (MR) approach.
A 1-unit increase in log-transformed hsCRP was associated with a 15% increase in DN risk.
HOW THIS STUDY MIGHT AFFECT RESEARCH, PRACTICE OR POLICY
Our findings support a causal role of CRP in the inflammatory process on development of DN.
Higher CRP levels could help identify patients with type 2 diabetes mellitus at high risk of DN and make useful clinical decisions for heath professional of diabetes care.
Introduction
Chronic kidney disease (CKD), associated with an elevated cardiovascular risk manifesting as arrhythmias, heart failure, coronary artery disease, and sudden cardiac death, is a global public health issue.1 CKD has been recently identified as the most common risk factor for severe COVID-19; it is associated with increased mortality in critically ill patients with COVID-19.2 3 As lifestyle behaviors westernized, the prevalence of type 2 diabetes has rapidly increased in Taiwan. According to the Nutrition and Health Survey in Taiwan, the prevalence of type 2 diabetes demonstrated the following trends: increased from 5.8% in female and 3.0% in male in the population during 1993–1996, 6.6% in female and 10.4% in male during 2005–2008, 10.5% in female and 16.2% in male during 2013–2014, to 10.4% in female and 14.5% in male during 2013–2015.4 5 An epidemiological study revealed that type 2 diabetes is one of the key predictors of CKD in Taiwan.6 Diabetic nephropathy (DN) is the leading cause of CKD disability-adjusted life years, accounting for nearly 33% of the total.7 Identifying potential risk factors for preventing CKD development in patients with type 2 diabetes is important.
CKD is an important and independent risk factor for cardiovascular disease (CVD) in the general population8 and has been considered a coronary risk factor. Thus, CKD should be treated as a factor of aggressive risk factor reduction for other CVD risks,9 which may be mediated by the development of atherosclerosis, or may result as a consequence of shared risk factors with CKD such as hypertension and diabetes mellitus. The underlying pathophysiological process of microvascular and macrovascular disease is a chronic inflammatory condition. Inflammation plays an important role in the initiation, progression, and clinical outcome of atherosclerosis.10 It has been reported that persistent inflammation has been involved in the pathogenesis of DN, but causality has not been established for any specific inflammatory mediator.11 C-reactive protein (CRP) is a protein at acute phase produced by the liver and is rapidly synthesized and released in response to inflammation and tissue damage.12 Although CRP has been reported to be associated with many diseases such as thyroiditis,13 hepatitis,14 15 and COVID-19 disease,16 it has been considered to be a cause underlying the etiology and manifestation of type 2 diabetes,17 18 and high-sensitivity C-reactive protein (hsCRP) also has been treated as a powerful predictor of CVD.19 Hyperglycemia is the major driving force of the progression to end stage renal disease (ESRD) from DN.20 Thus, CRP is the potential systemic mediator of inflammation that is associated with DN.
Previous studies have shown that CRP is independently associated with urinary albumin-to-creatinine ratio (ACR)21 or diabetic kidney disease determined by ACR and estimated glomerular filtration rate (eGFR)22 in patients with type 2 diabetes. A meta-analysis of observational epidemiological case-control studies has also revealed that a higher level of CRP concentration was observed in patients with DN compared with patients without DN.23 A cross-sectional study in patients with type 2 diabetes of three groups of albuminuria status (normoalbuminurics, microalbuminurics, and macroalbuminurics) found that inflammatory markers of CRP in early type 2 DN are elevated in groups with microalbuminuria and macroalbuminuria and are independently associated with urinary albumin excretion.24 CRP level significantly decreased in all three diabetic groups after 6 months of treatment.24 However, randomized trials of interventions specific to CRP have not yet been performed considering DN. Given the absence of such trials, genetic studies of Mendelian randomization (MR) analysis can be used to help determine causality by providing experimental evidence. This approach is based on Mendel’s second law, stating that alleles of different genes assort independently of one another during gamete formation stage. Therefore, MR analyses are based on Mendel’s observation that inheritance of one trait should be independent of inheritance of other traits.25 Genetic variants, such as SNPs, are continuously increasingly used as instrumental variables because their alleles are assigned to individuals before any exposure or outcome. Genetic instruments are non-modifiable, ensuring lifelong exposure and lessening concerns on reverse causation.26 The alleles of a given SNP are randomly allocated to egg/sperm cells during gamete formation. Thus, genetic variants are independent of potentially confounding environmental exposures.26 This genetic instrumental variable method has been proposed as an alternative statistical method to examine causality relationship between exposure and outcome while controlling for any potential confounders. A genetic instrumental variable mimics the randomized allocation of persons to the exposure and thus ensures comparability in the distributions of any known and unknown confounders between groups. The effect of the exposure on the outcome can be accurately estimated in the presence of such a valid instrument; therefore, the causality of an observed association can be evaluated.27 Previous studies have explored associations between plasma CRP levels with coronary heart disease (CHD),28 body mass index (BMI),29 atrial fibrillation,30 type 2 diabetes, insulin resistance, hemoglobin A1c (HbA1c),31 metabolic syndrome,32 and blood pressure measures and hypertension33 using MR approach. However, none of these studies have explored the aforementioned association using the MR approach.
The present study used SNPs in CRP gene identified from previous studies of candidate gene approach or genome-wide association studies to conduct an MR analysis that exploit the reported association between serum CRP and DN. The genetic variants that specifically increase plasma levels of CRP34 35 were used as instruments. The serum CRP is selected because it is an important marker of chronic systemic inflammation that is associated with many possible pathways of CKD such as atherosclerosis, oxidative stress, and renin-angiotensin system (RAS).
Methods
Study subjects and data source
This cross-sectional study was conducted on a total of 2400 study subjects from the Taiwan Biobank with type 2 diabetes aged 30–70 and self-reported as being of Taiwanese Han Chinese ancestry. Those who had a history of cancer were excluded. In early 2005, the ‘Taiwan Biobank’ has been implemented as a part of Taiwan’s strategic development in promoting the country as an island of biomedicine.36 The Taiwan Biobank project plans to conduct a large-scale community-based cohort and several patient cohorts of local chronic diseases from medical centers (the hospital-based cohorts) and then track health-related status and lifestyle behaviors of these participants for at least 10 years. The 2400 participants with type 2 diabetes were randomly selected from participants with type 2 diabetes in the Taiwan Biobank. Meanwhile, 78 individuals were excluded due to extreme heterozygosity rate (n=33), closely related individuals (n=17), withdrew from study (n=2), or lack of basic sociodemographic information (n=16), resulting in the inclusion of 2332 individuals in MR analysis (figure 1).
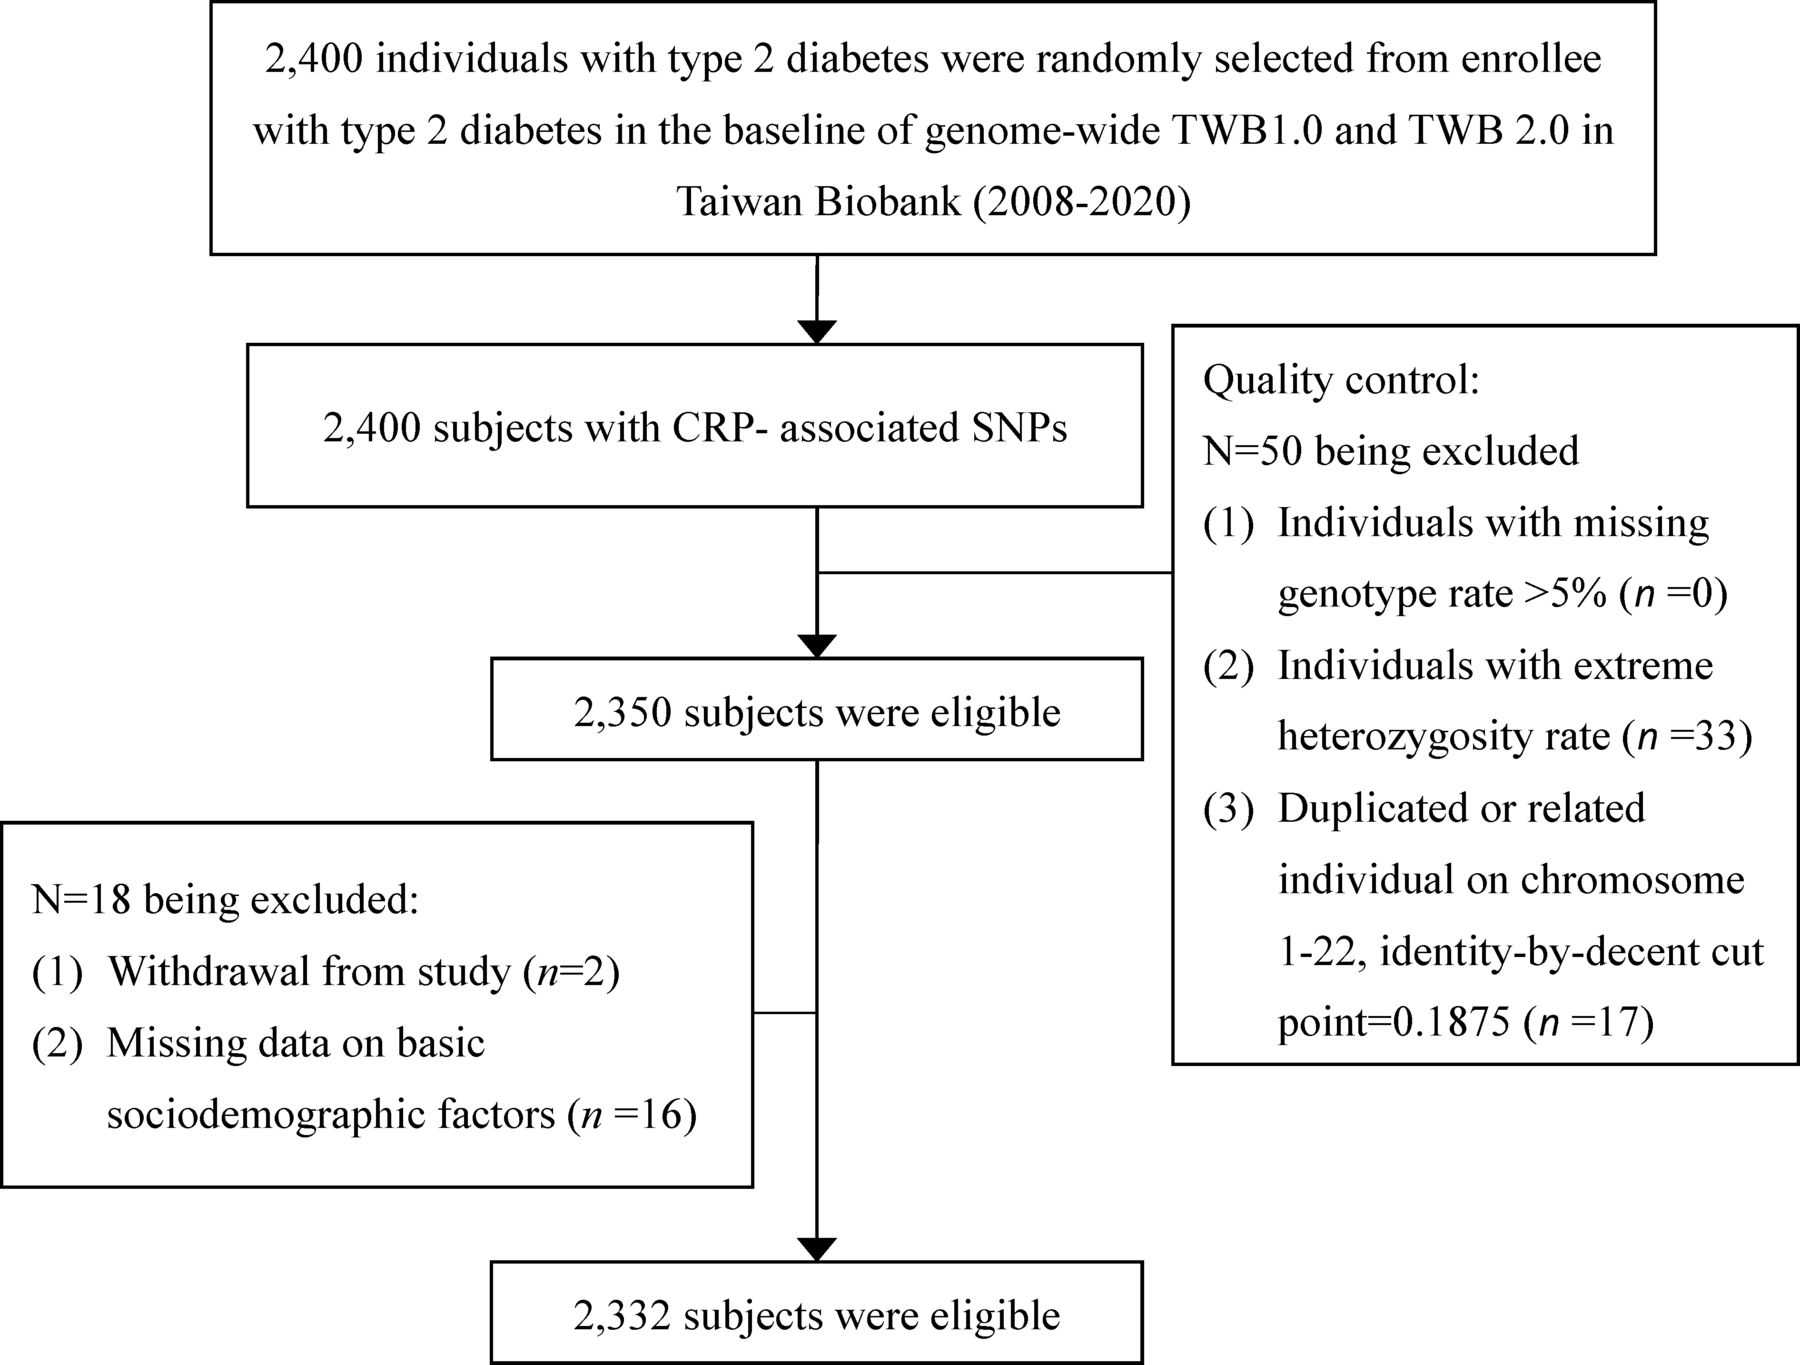
Research flowchart for study subject selection in the present study. CRP, C-reactive protein.
Measurements
Sociodemographic factors and lifestyle behaviors
Sociodemographic characteristics and lifestyle behaviors, including age, sex education level, marriage status, physical activity, smoking, alcohol drinking, physician-diagnosed diseases, and medication history, were collected when the participants underwent a complete physical check-up.
Laboratory biomarkers
Total cholesterol, high-density lipoprotein cholesterol (HDL-C), low-density lipoprotein cholesterol (LDL-C), triglyceride (TG), fasting plasma glucose (FPG), HbA1c, urine albumin and creatinine, serum creatinine, and uric acid were tested at the Department of Clinical Laboratory, Linkou Chang Gung Memorial Hospital. hsCRP levels were analyzed and measured by nephelometry, a latex particle-enhanced immunoassay (TBA-200FR, Tokyo, Japan). The interassay and intra-assay coefficients of variation (CVs) are <2.0% and <1.9%, respectively. The lower detection limit of the assay is 0.1 mg/L. HbA1c testing was also performed by using Trinity biotech premier Hb9210. FPG, total cholesterol, TG, HDL-C, LDL-C, albumin, creatinine, and microalbumin were analyzed by Hitachi LST 008. Uric acid testing was also performed by using Abbott Architect i2000. An eGFR was calculated from serum creatinine using the Chronic Kidney Disease Epidemiology Collaboration (CKD-EPI) equation,37 where eGFR (mL/min/1.73 m2)=141× min(Scr/κ,1)α×max(Scr/κ,1)−1.209×0.993Age×1.018 (if female)×1.159 (if black), where Scr is serum creatinine, κ is 0.7 for females and 0.9 for males, α is −0.329 for females and −0.411 for males, min indicates the minimum of Scr/κ or 1, and max indicates the maximum of Scr/κ or 1. DN was assessed clinically by measuring eGFR and albuminuria measurements. DN was defined as either a urine ACR ≥300 mg/g cr or an eGFR <60 mL/min per 1.73 m2.
SNPs genotyping
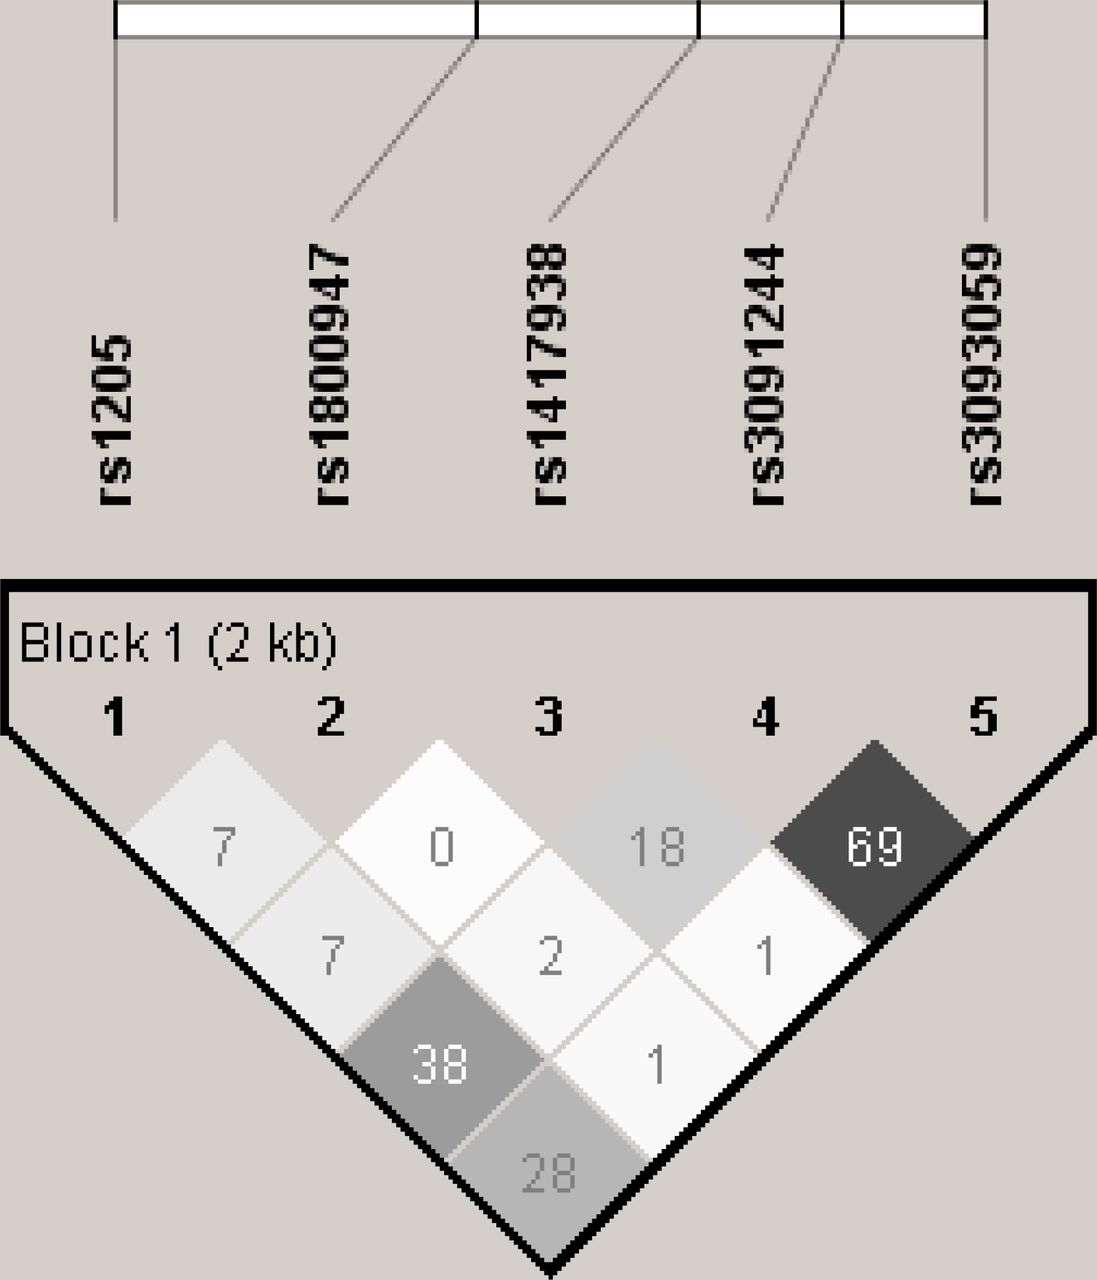
DNA samples from the Taiwan Biobank were genotyped using the TWB array and run on the Axiom Genome-Wide Array Plate System (Affymetrix, Santa Clara, California, USA) (online supplemental table S1). Each SNP was assessed whether it is in Hardy-Weinberg equilibrium by using PLINK (V.1.9).38 Pairwise linkage disequilibrium (LD) among SNPs was quantified by correlation coefficient r2 in Haploview (V.4.2)39 (figure 2). Imputation of the database was conducted using IMPUTE240 with a reference derived from the 1000 Genomes Project.
Supplemental material
Linkage disequilibrium plot of five SNPs at CRP locus.
Statistical analysis
Descriptive statistics of mean and SD are reported for continuous variables and frequency and proportions for categorical variables. Normal test of Shapiro-Wilk test was used to examine the normal distributions of continuous variables. We found that hsCRP violated the normal assumption. Sociodemographic factors, lifestyle behaviors, lab data, and disease history were evaluated between persons with and without DN using two-sample t-test and χ2 test, as well as among persons in tertile groups of genetic risk score (GRS) using analysis of variance (ANOVA) and χ2 test. The hsCRP level was naturally log-transformed.
One-sample MR analyses of hsCRP on DN was performed as described below. The success of an MR analysis depends on the genetic instrumental variables. Thus, three core assumptions were assessed to determine whether these SNPs can be used as genetic instrumental variables to estimate the causal effect of hsCRP on DN unbiasedly.41 Assumption 1: genetic instrumental variables must be reproducibly and strongly associated with the exposure; assumption 2: genetic instrumental variables must not be associated with the confounders; assumption 3: genetic instrumental variables are not associated with outcome directly, only are associated with outcome through the exposure.
First, the cross-sectional relationship observed in epidemiologic study was analyzed between plasma hsCRP and DN using unconditional logistic regression analysis to estimate the association between hsCRP and DN. Multivariate analyses include adjustment for sociodemographic characteristics, lifestyle behaviors, and disease history. Second, the relationships of CRP SNPs in genotype models with plasma hsCRP level for SNP-based MR assumption 1 were analyzed using the ANOVA, with hsCRP undergoing log-transformation to verify whether the selected SNPs can be used as instrumental variables for MR analysis. The association between selected SNPs and CRP concentrations were quantified using linear regression models to further adjust for the confounding effects of covariates. Geometric mean CRP concentration and 95% CI by genotype model and the estimated difference in log-transformed hsCRP levels for those in minor–minor and minor–major subgroups compared with those in major–major subgroup were presented. An unweighted GRS was created by counting the number of minor alleles of the CRP SNPs that were individually associated with hsCRP concentrations but not associated with DN. In addition, a weighted GRS was created by summing the number of minor alleles multiplied by its estimated coefficient from the linear regression and then divided by the sum of weights.42 The unweighted and weighted GRSs were divided in accordance with tertiles for analyses. Assumptions 1–3 of MR based on GRS were then assessed. GRS-based MR assumptions 1, 2, and 3 were assessed by linear regression model, χ2 test or ANOVA, and logistic regression models, respectively.
Finally, a formal MR analysis was performed to assess the causal effect of low-grade inflammation reflected by hsCRP on DN and was quantified by instrumental variable analysis using two-stage models with multivariate adjustment. The first stage comprised the linear regression of log-transformed hsCRP concentrations on the genetic instrument, resulting in predicted values of hsCRP concentrations by weighted or unweighted GRS. The second stage comprised a logistic regression of DN on the predicted hsCRP concentrations estimated in the first stage. Instrument strength for MR analysis was evaluated using the F-statistic from the first stage regression.43 An F value >10 is considered to be the minimally required instrument strength for unbiased instrumental variable estimation.44 Different definitions of instrumental variables, including weighted or unweighted GRS forms, were used to examine the robustness of associations. The multivariable adjusted OR from the logistic regression analysis for the association between measured hsCRP concentration and DN likelihood was estimated to compare the associations between genetically predicted CRP levels (instrumental variable analysis) in relation to DN. The analyses were performed with SAS V.9.4 (SAS, Cary, North Carolina, USA). All reported p values are two-sided, and the level of significance is set at 0.05.
Results
Of the 2332 individuals with type 2 diabetes, 256 (10.98%) had prevalent DN. The baseline characteristics for individuals with and without DN are summarized in table 1. Individuals with DN had older age, male sex, higher prevalence of smoking, obesity, hypertension, heart disease, stroke, lower level of albumin, and higher levels of FPG, HbA1c, creatinine, uric acid, ACR, TG, TC, HDL-C, and log-transformed hsCRP than those without DN. The strength of association between log-transformed hsCRP and DN estimated by OR using observational epidemiologic approach was 1.17 (1.04 to 1.32) per 1-unit increase in log-transformed hsCRP without adjustment (online supplemental table S2). After adjusting for traditional risk factors, this association remained significant (1.15, 1.01 to 1.32).
Characteristics of study subjects according to the status of diabetic nephropathy (n=2332)
The associations of five SNPs (rs1205, rs1800947, rs1417938, rs3091244, and rs3093059) were then tested with log-transformed hsCRP level using additive linear regression models for SNP-level MR assumption 1 in online supplemental figure S1. Four SNPs were significantly associated with transformed hsCRP level (all p<0.05), indicating the four SNPs satisfy MR assumption 1. One SNP (rs1417938) was insignificantly associated with log-transformed hsCRP level (p>0.05). Results of Bonferroni multiple comparison test revealed that high log-transformed hsCRP levels were observed in persons carrying rs1205 CT or CC, rs1800947 CC, rs3091244 AG or AA, and rs3093059 GA or GG. The five SNPs were insignificantly associated with DN outcomes in online supplemental figure S2, indicating that the five SNPs satisfy MR assumption 3.
Based on the SNP-level MR assumptions 1 and 3, unweighted and weighted GRSs were derived by combining four SNPs. The baseline characteristics of participants according to tertiles of unweighted or weighted GRS were assessed for MR assumption 2 (table 2). No significant differences were found among participants of tertiles of unweighted or weighted GRS subgroups, except for marriage status, total cholesterol, and hyperlipidemia, among weighted and unweighted GRS subgroups, and LDL-C among unweighted GRS subgroups. The covariates significantly associated with unweighted or weighted GRS violated the MR assumption 2 and were not considered in the first stage of the multivariate analysis. The association of unweighted or weighted GRS with log-transformed hsCRP level was evaluated for GRS-level MR assumption 1 and is presented in table 3. Unweighted GRS (β=0.11, p<0.001) and weighted GRS (β=0.42, p<0.001) were strongly associated with log-transformed hsCRP with and without adjustment of covariates. After adjusting for covariates that satisfy the MR assumption 2, unweighted GRS (β, 0.11, p<0.001) and weighted GRS (β, 0.43, p<0.001) were still significantly correlated with log-transformed hsCRP. The associations between GRS and DN remained insignificant in unadjusted and adjusted analyses, satisfying GRS-level MR assumption 2 with an adjusted OR of 1.00 for every 1-unit increase in unweighted or weighted GRS (table 4).
Characteristics of study subjects according to tertile subgroups of weighted and unweighted genetic risk score (GRS) (n=2332)
Association of weighted and unweighted genetic risk scores with log-transformed hsCRP in patients with type 2 diabetes
Association of genetic risk scores with diabetic nephropathy in patients with type 2 diabetes
The predictive log-transformed hsCRP level in the first-stage regression was then assessed as the independent variable in the second stage regression to estimate the ORs of DN outcome in table 5. In the second stage analysis, the predicted log-transformed hsCRP values from the first stage were then used for logistic regression analysis with DN as the dependent variable. The predicted log-transformed hsCRP based on unweighted or weighted GRS was associated with DN (ORs 1.80 (95% CI 1.52 to 2.14) and 1.71 (95% CI 1.44 to 2.02) per 1-unit increase, respectively). In adjusted analysis, associations were found for DN with ORs of 1.80 (95% CI 1.51 to 2.14) and 1.67 (95% CI 1.40 to 1.98) per 1-unit increase in genetically predicted log-transformed hsCRP based on unweighted or weighted GRS, respectively. Compared with participants in the first tertile of predicted log-transformed hsCRP based on unweighted GRS, those belonging to subgroups of the second and third tertiles had significantly higher DN risks after multivariable adjustment (1.70, 1.16 to o 2.49 and 3.19, 2.24 to 4.55, respectively). Compared with those persons in the first tertile subgroup of genetically predicted log-transformed hsCRP based on weighted GRS, those in the subgroup of the third tertile had a significantly higher risk of DN (2.69, 1.89 to 3.82).
The ORs of diabetic nephropathy for predictive log-transformed hsCRP level derived from weighted and unweighted genetic risk score
Discussion
Similar to the findings of previous observational epidemiologic studies,21 23 24 the current study demonstrated that serum hsCRP level was independently associated with DN risk in patients with type 2 diabetes despite adjustments for sociodemographic characteristics, lifestyle behaviors, and disease history. A 1-unit increase in log-transformed hsCRP was associated with a 15% increase in DN risk. The results of MR analyses demonstrated that the weighted/unweighted GRS-predicted log-transformed hsCRP were associated with an increased risk of DN, indicating the robustness of findings of the current study. Persons in the highest tertile subgroup of genetically predicted log-transformed hsCRP based on weighted/unweighted GRS were associated with a 80% and 67% increase DN risk, respectively. A causal relationship between hsCRP and DN in patients with type 2 diabetes was identified using a two-stage MR approach, ruling out the possibility of potential reverse causality.
Previous studies confirmed that genetic variants of the CRP gene with the strongest effects on CRP level are all within and around the CRP locus on chromosome 1 (1q21–q23),34 35 and estimated heritability for CRP secretion ranged between 0.25 and 0.56.34 45 46 After evaluating the SNPs in CRPs with low LD (r2<0.7), unweighted and weighted GRSs were constructed from four SNPs (rs1205, rs1800947, rs3091244, and rs3093059) in the CRP gene, which are associated with plasma hsCRP levels and not associated with DN risk. The SNP rs1205, located in the 3′ flanking region of the CRP gene, is one of the polymorphisms showing the most uniform and consistent association with CRPs.47–50 In the coding region of the CRP gene, the SNP rs1800947 (silent mutation)51 has been reported to be associated with elevated basal CRP levels.52 In the promoter region of the CRP gene, the SNP rs3091244 is functional and is predicted to alter a transcription factor E-box binding element, which was reportedly associated with serum CRP.47 In the promoter region of the CRP gene, the SNP rs13093059 was also reported to be a contributor to the variation in CRP levels.53 Using the four SNPs as instrumental variables for the causal assessment, an MR analysis should reduce confounding effects because the genetic variants used as proxies for exposure are not linked to other disease markers. Such MR studies should also rule out distortions caused by the confounders occurring later in life because genetic variants are determined at conception.25 Hence, MR analyses are favored because of certain design advantages similar to those in randomized trials. This approach has previously confirmed the SNP variation associated with LDL-C,54 Lp(a) lipoprotein,55 and fibrinogen56 on coronary heart disease. In addition, the associations of the genetically predicted CRP levels with CHD,28 BMI,29 atrial fibrillation,30 type 2 diabetes, insulin resistance, HbA1c,31 metabolic syndrome,32 and BP markers33 have been revealed. However, MR analysis has never been applied to assess the causal relationship of CRP and DN. The current study represented the first MR analysis of hsCRP levels on DN risk in patients with diabetes and may guide therapeutic decision-making in clinical practice for patients with type 2 diabetes.
Elevated baseline CRP is associated with an increased risk of DN, largely recognized as a consequence of underlying disease-associated inflammation.57 58 Previous study has shown that CRP is induced by high glucose, which is associated with the activation of NF-κB and TGF-β/Smad3 signaling, resulting in renal inflammation and fibrosis under diabetic conditions.59 CRP has been reported to stimulate the production of proinflammatory cytokine,60 which can lead to mesangial cell proliferation, matrix overproduction, and increased vascular permeability, resulting in albuminuria.61 In addition to these biological evidence57–61 suggesting a direct link between increased levels of hsCRP and DN risk, epidemiological evidence also found similar results.21 23 24 Similar to the findings of previous studies, the current study validated that hsCRP is causally related to DN using MR analysis. Our findings support a causal role of CRP in the inflammatory process on development of DN.
Our study’s findings are consistent with that of the Care Time study, revealing that that CRP-based markers were associated with diabetic kidney injury in subjects with type 2 diabetes.62 In addition to hsCRP, several markers of inflammation have been noted to be associated with diabetic kidney injury, including kidney injury molecule,63 omentin,64 mean platelet volume,65 serum uric acid,66 monocyte/lymphocyte ratio in hemogram,67 neuregulin,68 and uric acid/HDL cholesterol ratio.69 The findings of these traditional epidemiologic studies reveal that these biomarkers may facilitate the diagnosis of prevalent renal damage caused by DN. The findings of the present study using MR approach may indicate that hsCRP is useful in monitoring the progression to develop kidney disease in patients with type 2 diabetes because MR approach provides experimental evidence and rules out the possibility of reverse causality.
The main strengths of the current study included a database with standardized data collection procedures and lab techniques for blood and genetic markers that ensure a high degree of reliability, the availability of inflammatory marker, such as hsCRP, and consideration of many potential confounders. In addition, all participants are of the same race. The present study has some limitations that must be mentioned. First, this is a cross-sectional study; hsCRP and DN status were measured at the same time point, and this type of study design cannot provide a time sequence that a cohort study possesses. However, reverse causality can be ruled out because genes are innately determined. Second, the current study sample only contained study subjects of pure Taiwanese Han Chinese ancestry. The obtained findings may not be generalized to other ethnicities due to differences in genes, race, and lifestyle behaviors. Third, hsCRP was only measured once at baseline. Hence, intraindividual variability over time was not considered. Finally, the age and gender distributions are different from the Taiwan’s general population. However, the primary purpose of the present study is analytic. The most important consideration is that the sample contains sufficient subjects with adequate variation in hsCRP and a sufficient number of persons with DN. The MR approach has controlled for the potential confounders that satisfied the MR assumption 2. Thus, this study further adjusted for as many potential confounding variables as possible in multivariate analyses. Therefore, confounding effects should be excluded.
Conclusion
In conclusion, the present study provides the first evidence of a causal link between hsCRP and DN in patients with type 2 diabetes using MR approach. The findings of this MR approach were consistent with the meta-analyses of observational epidemiologic studies, which revealed a significant association between hsCRP and DN in patients with type 2 diabetes.15 Additional large MR studies are required to verify the obtained findings.
Data availability statement
All data relevant to the study are included in the article or uploaded as supplementary information.
Ethics statements
Patient consent for publication
Ethics approval
This study was approved by the Ethical Review Board of the China Medical University Hospital (CMUH107-REC2-179). The entire study was performed in accordance with relevant guidelines and regulations.
Acknowledgments
This research has been conducted using the Taiwan Biobank resource. We thank all the participants and investigators of the Taiwan Biobank.
References
Supplementary materials
Supplementary Data
This web only file has been produced by the BMJ Publishing Group from an electronic file supplied by the author(s) and has not been edited for content.
Footnotes
Contributors T-CL and C-CL developed the study design, obtained funding and drafted manuscript. C-IL, L-NL and S-YY acquired data, carried out the statistical analysis, analyzed and interpreted data, and critically revised the manuscript. C-SL, C-WY, C-HL, T-CL, and C-CL contributed to discussion, and reviewed and edited this manuscript. All authors read and approved the final manuscript. T-CL and C-CL are the guarantors of this work and, as such, had full access to all the data in the study and take responsibility for the integrity of the data and the accuracy of the data analysis.
Funding This study was supported primarily by the Ministry of Science and Technology of Taiwan (MOST 108-2314-B-039-035-MY3) and China Medical University (CMU110-MF-45).
Competing interests None declared.
Provenance and peer review Not commissioned; externally peer reviewed.
Supplemental material This content has been supplied by the author(s). It has not been vetted by BMJ Publishing Group Limited (BMJ) and may not have been peer-reviewed. Any opinions or recommendations discussed are solely those of the author(s) and are not endorsed by BMJ. BMJ disclaims all liability and responsibility arising from any reliance placed on the content. Where the content includes any translated material, BMJ does not warrant the accuracy and reliability of the translations (including but not limited to local regulations, clinical guidelines, terminology, drug names and drug dosages), and is not responsible for any error and/or omissions arising from translation and adaptation or otherwise.