Article Text

Abstract
Introduction Adapted Diabetes Complications Severity Index (aDCSI) is a commonly used severity measure based on the number and severity of diabetes complications using diagnosis codes. The validity of aDCSI in predicting cause-specific mortality has yet to be verified. Additionally, the performance of aDCSI in predicting patient outcomes compared with Charlson Comorbidity Index (CCI) remains unknown.
Research design and methods Patients aged 20 years or older with type 2 diabetes prior to January 1, 2008 were identified from the Taiwan National Health Insurance claims data and were followed up until December 15, 2018. Complications for aDCSI including cardiovascular, cerebrovascular and peripheral vascular disease, metabolic disease, nephropathy, retinopathy and neuropathy, along with comorbidities for CCI, were collected. HRs of death were estimated using Cox regression. Model performance was evaluated by concordance index and Akaike information criterion.
Results 1,002,589 patients with type 2 diabetes were enrolled, with a median follow-up of 11.0 years. After adjusting for age and sex, aDCSI (HR 1.21, 95% CI 1.20 to 1.21) and CCI (HR 1.18, 1.17 to 1.18) were associated with all-cause mortality. The HRs of aDCSI for cancer, cardiovascular disease (CVD) and diabetes mortality were 1.04 (1.04 to 1.05), 1.27 (1.27 to 1.28) and 1.28 (1.28 to 1.29), respectively, and the HRs of CCI were 1.10 (1.09 to 1.10), 1.16 (1.16 to 1.17) and 1.17 (1.16 to 1.17), respectively. The model with aDCSI had a better fit for all-cause, CVD and diabetes mortality with C-index of 0.760, 0.794 and 0.781, respectively. Models incorporating both scores had even better performance, but the HR of aDCSI for cancer (0.98, 0.97 to 0.98) and the HRs of CCI for CVD (1.03, 1.02 to 1.03) and diabetes mortality (1.02, 1.02 to 1.03) became neutral. When aDCSI and CCI were considered time-varying scores, the association with mortality was stronger. aDCSI had a strong correlation with mortality even after 8 years (HR 1.18, 1.17 to 1.18).
Conclusions The aDCSI predicts all-cause, CVD and diabetes deaths but not cancer deaths better than the CCI. aDCSI is also a good predictor for long-term mortality.
- Diabetes Mellitus, Type 2
- Mortality
- Neoplasms
- Cardiovascular System
Data availability statement
No data are available.
This is an open access article distributed in accordance with the Creative Commons Attribution Non Commercial (CC BY-NC 4.0) license, which permits others to distribute, remix, adapt, build upon this work non-commercially, and license their derivative works on different terms, provided the original work is properly cited, appropriate credit is given, any changes made indicated, and the use is non-commercial. See: http://creativecommons.org/licenses/by-nc/4.0/.
Statistics from Altmetric.com
WHAT IS ALREADY KNOWN ON THIS TOPIC
The adapted Diabetes Complications Severity Index (aDCSI) is predictive to mortality and hospitalizations, but its performance in predicting cause-specific mortality is unclear.
It is unknown whether the aDCSI outperforms Charlson Comorbidity Index (CCI) in predicting death.
WHAT THIS STUDY ADDS
The aDCSI outperforms the CCI in terms of diabetes and cardiovascular disease (CVD) mortality, but not cancer mortality.
The aDCSI is also a good predictor of long-term mortality.
Incorporating both the aDCSI and the CCI in a risk model yield a better performance.
HOW THIS STUDY MIGHT AFFECT RESEARCH, PRACTICE OR POLICY
The aDCSI is a reliable measure of the severity of diabetes and is recommended to be included in the predictive models of all-cause, diabetes or CVD mortality or in the studies where diabetes severity should be adjusted.
Introduction
The global prevalence of diabetes was estimated to be 5% in 2019,1 and this percentage has increased significantly in recent decades.2 Diabetes mellitus and its complications result in enormous morbidity and mortality. In 2019, diabetes mellitus caused 1.5 million deaths and 66 million disability-adjusted life-years worldwide.1 Extensive efforts have been devoted to diabetes research. Because of its timely data availability and large sample sizes, claims data have been widely used in a variety of clinical medical research studies, including the development and validation of risk models. One critical challenge in diabetes research using claims data is to quantify the severity of diabetes. Quantifying the severity of diabetes is not only crucial in predicting the prognosis of diabetes but also allows better control of its confounding effects.
The Diabetes Complications Severity Index (DCSI) is a commonly used severity measure based on the number and severity of diabetes complications using the International Classification of Diseases, Ninth Revision (ICD-9) diagnosis and procedure codes and laboratory data, including urine protein and serum creatinine.3 The performance of the DCSI in predicting mortality and hospitalizations has been validated in several studies.3 Unfortunately, because laboratory test results are not commonly available in most claims databases, the usefulness of the DCSI is limited. Chang et al proposed an adapted Diabetes Complications Severity Index (aDCSI) that is essentially the same as DCSI except for the removal of laboratory data to quantify the severity of diabetes.4 The performance of the aDCSI has been proven regarding the prediction of increased hospitalization4 and healthcare cost,5 and greater risk for severe hypoglycemia6 and macro/microvascular complications.7
Two other frequently used indicators for the severity of diabetes are glycated hemoglobin (HbA1c) and the diabetes duration. HbA1c is an index of the average glucose level over 2–3 months and it may fluctuate over time; thus, HbA1c at a single time point may not be adequate to fully reflect the cumulative glycemic exposure.8 Similarly, the diabetes duration does not represent the quality of glycemic control. On the other hand, the aDCSI is proposed to be a reasonable index to quantify long-term diabetes control because complications usually manifest several years after the diagnosis of diabetes.9
Although the validity of the aDCSI to predict all-cause mortality is supported by two large cohort studies,10 11 its correlation with the major contributors to death among patients with diabetes, including cardiovascular diseases (CVDs), diabetes and cancers, remains unclear.12 CVD mortality has significantly declined in recent decades because of improving diabetes control and effective management of other cardiovascular risk factors,13 while cancer mortality has remained stable or declined by a smaller magnitude.14 Since cardiovascular and cancer mortality are important and common endpoints in diabetes studies, ascertaining the relationship between diabetes severity scores such as the aDCSI and these major cause-specific mortalities is crucial.
Furthermore, because many patients with diabetes are elderly and likely have multiple comorbidities, the Charlson Comorbidity Index (CCI) may be a reasonable predictor of mortality in this population. The modified version of the CCI proposed by Deyo et al is based on the ICD-9 codes and is widely used in clinical and public health studies.15 Although many studies using mortality as an endpoint have included the CCI in multivariable models, studies specifically assessing the role of the CCI in predicting mortality in patients with diabetes are scarce.16 17
The appropriate measurement and adjustment for the severity of diabetes are fundamental to assuring the validity of diabetes research.18 19 As the aDCSI and CCI are two widely used diabetes severity indices in diabetes-related research, this study aimed to evaluate the validity of the aDCSI and CCI as risk indicators of all-cause and cause-specific mortality.
Methods
Data sources
The National Health Insurance (NHI) program, which was implemented in 1995, is a universal health insurance program that offers comprehensive medical coverage for more than 99% of the population in Taiwan.20 The NHI program covers inpatient, outpatient, traditional Chinese medicine, dental services and prescription drugs. The 2000–2018 claims and enrollment files of the National Health Insurance Research Database (NHIRD) were used as the main data sources. Multiple Cause of Death Data were also used to ascertain the dates and causes of death.21
Study design and study population
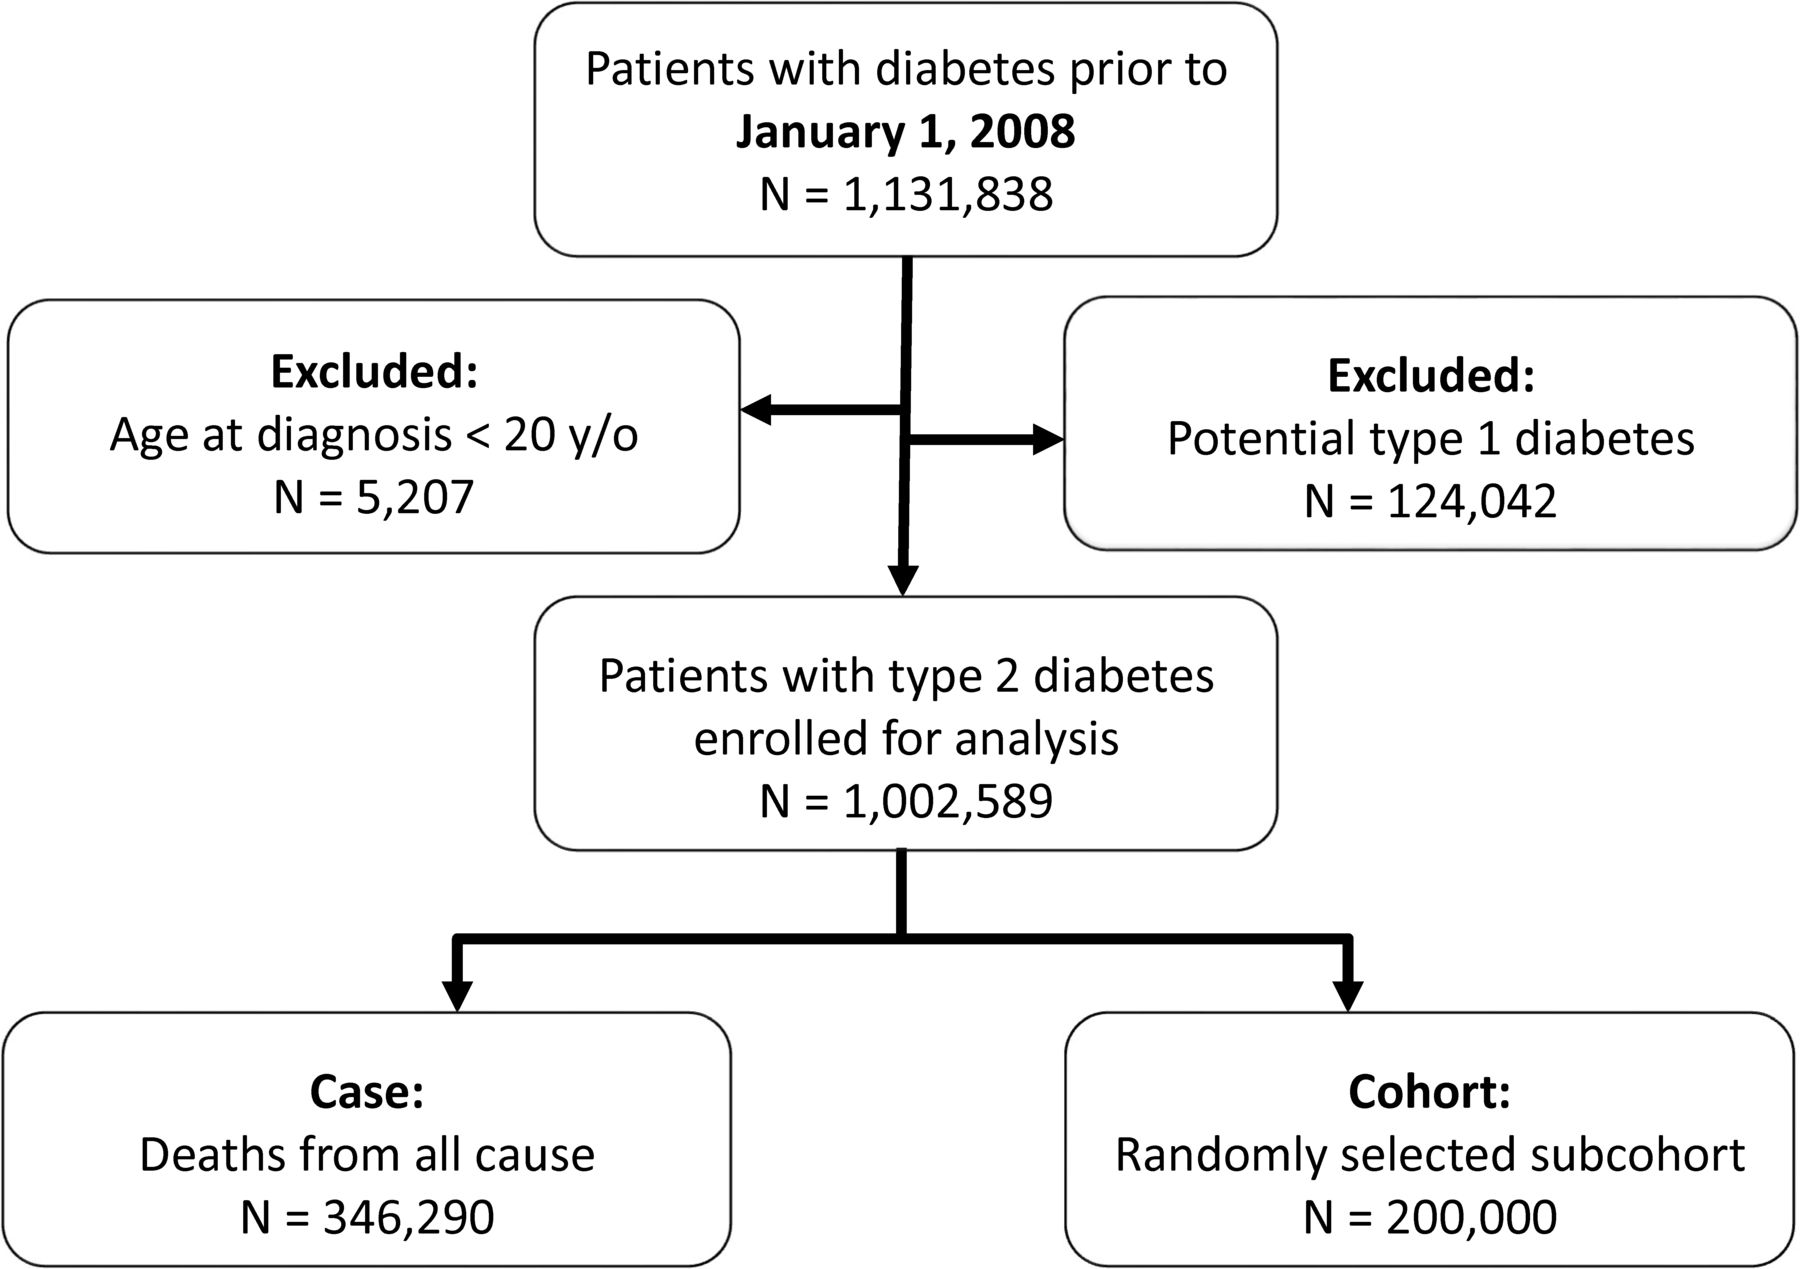
This was a retrospective cohort study. Each identified patient with type 2 diabetes was followed from the index date to death, withdrawn from the NHI or the date of December 15, 2018. Since enrollment in the NHI is mandatory by law, no one can arbitrarily withdraw except for those who lose their eligibility (eg, people who give up their citizenship or move abroad). Two criteria were applied to define patients with diabetes (ICD-9 code 250) prior to January 1, 2008 (the index date), from the NHI claims data: (1) three or more outpatient claims with a diagnosis of diabetes within 1 year or (2) at least one inpatient claim with a diagnosis. Patients who met the criteria within 2 years before the index date were enrolled. The criteria have been demonstrated to have a high sensitivity (96.9%) and positive predictive value (93.9%).22 In addition, patients with diagnosis codes of type 1 diabetes (ICD-9 code 250.X1 and 250.X3) and age at diagnosis younger than 20 years were excluded. Using the above-mentioned flow, we included all patients with diabetes first then excluded patient with potential type 1 diabetes to identified patients with type 2 diabetes. Patients with gestational diabetes only was not included.
Variables
Adapted Diabetes Complication Severity Index Score
Seven types of diabetes complications (cardiovascular, cerebrovascular and peripheral vascular disease, metabolic disease, nephropathy, retinopathy, and neuropathy) are included in the aDCSI.4 Each complication can be identified using ICD-9 codes from the claims data. The severity scores of each type range from 0 to 2, except for neuropathy, which ranges from 0 to 1. The aDCSI is constructed as a 13-point scale. The individual aDCSI score was calculated by summing the total score of all diabetes complications identified from January 1, 2000, to the index date (time-fixed score) or time of risk-set (time-varying score).
Charlson Comorbidity Index
The Deyo-adapted CCI incorporates 17 diseases. Different categories of diseases have different scores. The designated score for cerebrovascular disease, chronic pulmonary disease, congestive heart failure, dementia, diabetes without chronic complications, mild liver disease, myocardial infarction, peptic ulcer disease, peripheral vascular disease, and rheumatologic disease is one; that for diabetes with chronic complications, hemiplegia or paraplegia, malignancy including leukemia and lymphoma, and renal disease is two; for moderate or severe liver disease it is three; and the score for AIDS and metastatic solid tumor is six.15 Because cancer diagnoses are strongly predictive of deaths from cancer, cancer-related scores were excluded from our analysis of cancer mortality.
In this study, the aDCSI and CCI scores were calculated based on the presence of diagnostic codes at least once in either inpatient or outpatient data. The same definition has been used in other studies.5 23 The claims data from 2000 to 2007 were used for calculating the baseline time-fixed aDCSI and CCI scores before the index date (January 1, 2008). The claims data from 2000 to 2018 were used for calculating time-varying aDCSI and CCI.
All-cause and cause-specific deaths were the main outcomes of interest. Cause-specific deaths of interest included cancer (ICD-10 codes C00–C97), CVD (I10–I15, I01–I02.0, I05–I09, I20–I25, I27, I30–I52, I60–I69)24 and diabetes (E10–E14). A patient may have multiple causes of death recorded in the Multiple Cause of Death Data, including underlying, antecedent and immediate causes of death. Therefore, in this study, we acknowledged and analyzed multiple causes of death. For instance, when both diabetes and CVD are reported on the death certificate, both causes of death were analyzed in this study.
Statistical analyses
Overall survival was estimated using the Kaplan-Meier method. Differences in survival were analyzed using the log-rank test. A Cox proportional hazards regression model was used to estimate HRs. In the Cox regression model, we compared three different models as follows: model 1 included age, sex and aDCSI as a continuous variable; model 2 included age, sex and CCI as a continuous variable; and model 3 included age, sex and both aDCSI and CCI. The models were only adjusted for age and sex for two reasons: (1) to evaluate the performance of aDCSI and CCI with minimal demographic variables; and (2) to make the results comparable to the original aDCSI study4 and two following studies.10 11
In addition, we examined three methods to handle the aDCSI and CCI: (1) time-fixed scores, defined as the score each patient had at baseline; (2) time-fixed scores with time-varying effects, which means that the HRs were modeled as step functions of follow-up time, that is, different coefficients over different time intervals25; and (3) time-varying scores, with counting process approach26 which drastically reduced computing time27 and allowed scores to change at the exact time points a new diagnosis emerged that would change the score. While the time-fixed scores represent baseline characteristics, the time-varying score reflects the dynamic nature of complications and comorbidities. Both methods are immune to immortal time bias.28 Furthermore, because the correlation between scores and mortality may differ in different age groups and sexes, subgroup analyses were performed. The proportional hazard assumption was tested using the Schoenfeld residuals test.29
For better computational efficiency, Cox regressions were conducted using a case-cohort design.30 All cases (ie, patients with death events) and a 200,000 randomly sampled subcohort were included in the analysis, but cases outside the subcohort were not weighted before events. Then, Cox regression with robust variance was performed.26 In our validation test, the speed of the case-cohort approach was three to five times faster than the full-cohort approach and the results were quite similar (online supplemental table 1). Model performance was assessed using Harrell’s concordance index (C-index) and Akaike information criterion (AIC).31 32 The model with a higher C-index and lower AIC value has a better model fit. Data processing and linkage were performed with SAS V.9.4 (SAS Institute). Statistical analyses were performed using R Statistical Software V.4.1.2 (www.r-project. org/). Statistical significance was defined as a p value <0.05.
Supplemental material
Results
The final cohort consisted of 1,002,589 patients (figure 1). The median age at diagnosis was 62.7 years, with an IQR of 53.8–72.3 years. The median follow-up period was 11.0 years (IQR 7.8–11. 0). The median (IQR) CCI and aDCSI scores were 5 (3–6) and 2 (1–4), respectively. The top cause of death among patients with diabetes was CVD (15.06%). Details of the demographic data and the distribution of the aDCSI and CCI are presented in table 1. The Venn diagram presenting distribution on causes of death is shown in online supplemental figure 1. The overall survival according to the aDCSI and CCI is shown in figure 2. Higher scores were associated with worse survival, with a significant log-rank test for trend for both aDCSI and a CCI (p<0.001). Patients with aDCSI scores of 0 and 1 had similar survival patterns.
Baseline characteristics of patients with prevalent diabetes

Flow chart of this study.

Overall survival according to (A) aDCSI and (B) CCI. aDCSI, adapted Diabetes Complications Severity Index; CCI, Charlson Comorbidity Index.
Time-fixed scores
All of the HRs given below have a p value <0.001. After adjustment for age and sex, the aDCSI (HR 1.21 per score increase; 95% CI 1.20 to 1.21, model 1) and CCI (HR 1.18 per score increase; 95% CI 1.17 to 1.18, model 2) were significantly associated with all-cause mortality. When the aDCSI and CCI were put into the same model (model 3), both remained significant predictors of all-cause mortality, with HRs of 1.14 (95% CI 1.14 to 1.15) and 1.10 (95% CI 1.09 to 1.10), respectively. According to the C-index and AIC, model 3 had the best model fit, followed by model 1 and model 2.
For cancer mortality, the HRs of the aDCSI and CCI were 1.04 (95% CI 1.04 to 1.05, model 1) and 1.10 (95% CI 1.09 to 1.10, model 2), respectively. In model 3, the HR of the aDCSI was nearly neutral (0.98), while the HR of the CCI remained the same (1.11). The C-index and AIC showed that the model with the aDCSI (model 1) had worse model fit than that with the CCI (model 2). In contrast, the HRs of the aDCSI for CVD and diabetes mortality were 1.27 and 1.28, respectively, which were higher than those of the CCI (1.16 and 1.17). When the aDCSI and CCI were incorporated into a single model (model 3), the HRs of the aDCSI remained similar (1.25 and 1.27 for CVD and diabetes, respectively), but the HRs of the CCI were nearly neutral (1.03 and 1.02). The C-index and AIC suggested that the model with the aDCSI led to a better prediction of CVD and diabetes mortality. The complete results are shown in table 2 and online supplemental figure 2.
Age-adjusted and sex-adjusted HRs of aDCSI and CCI for all-cause and cause-specific mortality and model goodness-of-fit
Time-fixed scores with time-varying effects
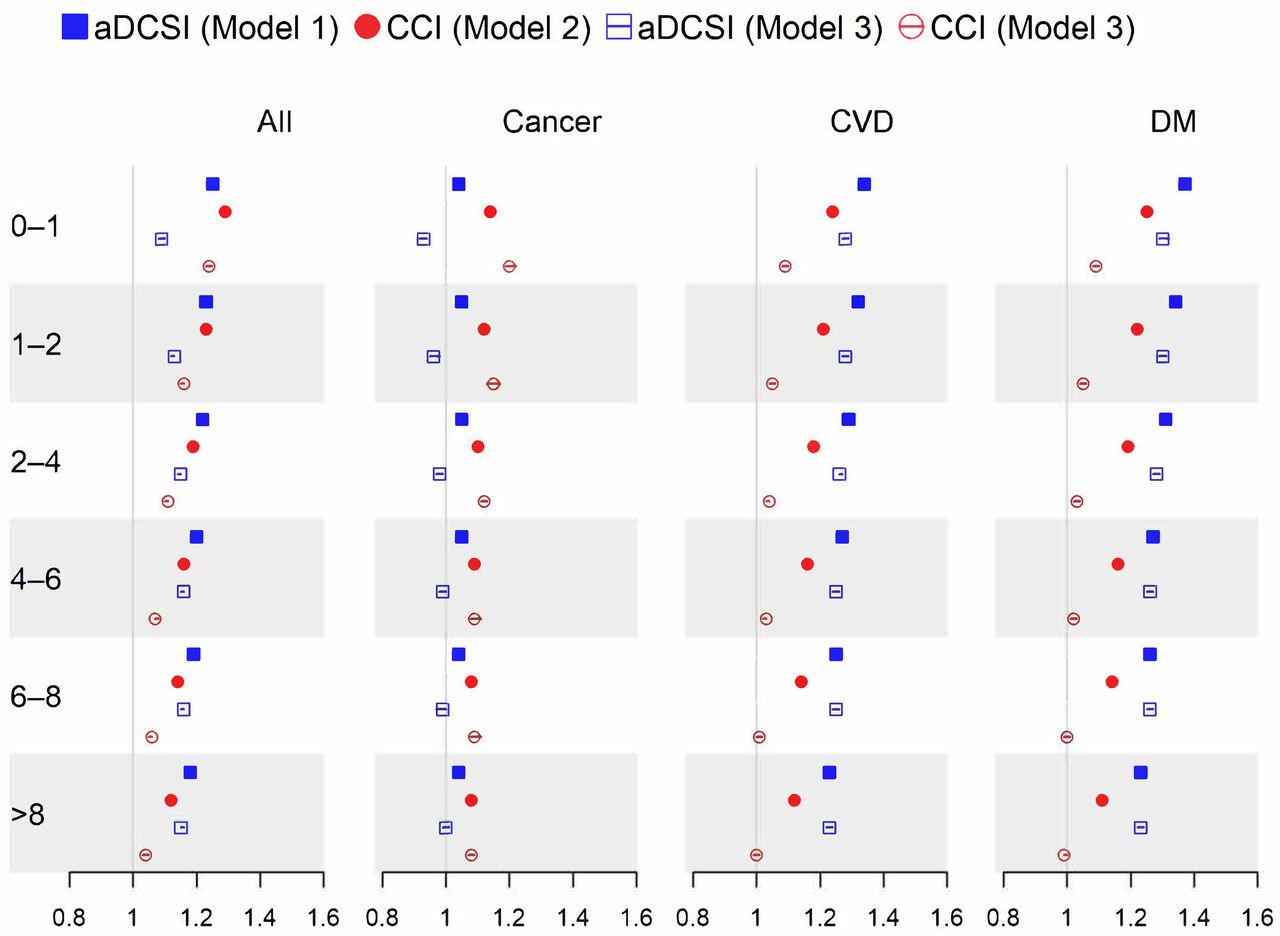
The Schoenfeld residuals test showed a violation of the proportional hazard assumption (p<0.001) in all models with time-fixed severity scores. This was probably due to the large sample size in the study but also suggested that the effects (HRs) may vary with time. We performed additional analyses that divided the follow-up time into six intervals (0–1, 1–2, 2–4, 4–6, 6–8 and >8 years) and estimated the time-varying HRs of the aDCSI and CCI. For all-cause mortality, as the follow-up time interval extended from shorter than 1 year to longer than 8 years, the HRs decreased for the model with aDCSI (1.25, 1.23, 1.22, 1.20, 1.19 and 1.18) and the model with CCI (1.29, 1.23, 1.19, 1.16, 1.14 and 1.12 for CCI). In model 3 incorporating the aDCSI and CCI in one model, the HRs of the aDCSI increased with the length of the follow-up time (from 1.09 to 1.15), while the HRs of the CCI decreased (from 1.24 to 1.04). These results suggest that the CCI may be better at predicting short-term all-cause mortality and that the aDCSI may be better at predicting long-term all-cause mortality (figure 3).

The forest plot of HRs and 95% CIs of aDCSI and CCI according to follow-up time intervals (years). There are four endpoints (all-cause, cancer, CVD and diabetes mortality) and three variable sets (model 1: sex, age and aDCSI; model 2: sex, age and CCI; and model 3: sex, age and both aDCSI and CCI). aDCSI, adapted Diabetes Complications Severity Index; CCI, Charlson Comorbidity Index; CVD, cardiovascular disease; DM, diabetes mellitus.
In terms of cause-specific mortality, the HRs of aDCSI were very close to 1 and remained consistent over time (1.04), while the HRs of CCI decreased as the follow-up time extended from 0 to 1 to >8 years (from 1.14 to 1.08). For CVD mortality, the HRs of the aDCSI and CCI both decreased as the follow-up time extended (from 1.34 to 1.23 and from 1.24 to 1.12, respectively). In model 3, the HRs of a DCSI were significantly different from 1, whereas the HRs of CCI were all close to 1. The patterns observed in all three models for diabetes-cause of death were very similar to those for CVD causes of death (figure 3).
Time-varying scores
When the aDCSI and CCI were treated as time-varying covariates, their association with mortality generally became more pronounced (table 2 and online supplemental figure 2). For all-cause mortality, the HRs of the aDCSI and CCI were 1.29 (95% CI 1.28 to 1.29) and 1.34 (95% CI 1.33 to 1.34), respectively. Among all three models, model 3, which incorporated both the aDCSI and the CCI, tended to have the best model fit for all-cause mortality and cause-specific mortalities. For all-cause mortality and cancer mortality, model 2 (the model with CCI) had a better model fit than model 1 (the model with aDCSI). On the other hand, for CVD and diabetes mortality, model 1 had a better model fit than model 2. Furthermore, for either all-cause mortality or cause-specific mortality, compared with those with time-fixed scores, the models with time-varying scores yielded increased HRs and an improved goodness-of-fit.
Subgroup analysis
In subgroup analyses, for all-cause mortality, the models incorporating time-fixed severity scores and the HRs of aDCSI (1.34, 1.31, 1.25 and 1.16) and CCI (1.34, 1.28, 1.22 and 1.13) decreased with age (≤50, 50–60, 60–70 and >70 years, respectively). For cancer, CVD and diabetes mortality, decreasing trends with age were also observed. The HRs were similar for men and women (online supplemental figure 3). The models with time-varying scores yielded similar patterns but more pronounced HRs (online supplemental figure 4).
Discussion
To our knowledge, this is the first population-based study to comprehensively evaluate the role of the aDCSI and CCI in predicting all-cause and cause-specific mortality in patients with type 2 diabetes. A long follow-up duration with a median of 11 years makes it feasible to test the validity of long-term mortality prediction. Using Multiple Cause of Death Data instead of the underlying cause of death alone allowed us to evaluate the whole burden of cause-specific mortality.33 When compared with the CCI, the aDCSI yielded an equal or slightly superior performance in predicting all-cause mortality. The aDCSI was also a better predictor for CVD and diabetes death but only showed a weak correlation with cancer mortality. When the two scores were incorporated simultaneously in a single model, the aDCSI was no longer correlated with cancer mortality, whereas the CCI was not correlated with CVD and diabetes mortality. Nonetheless, the predictive capability of the model incorporating both severity indices was consistently better. Our work further demonstrates that the aDCSI is persistently associated with long-term mortality among patients with diabetes, although with a minor drop in its relative risk; thus, it is a reasonable index to quantify long-term diabetes control.
Several studies have analyzed the association between death and the aDCSI. In a study of patients with advanced diabetic kidney disease, Chu et al found that the baseline aDCSI was associated with mortality, with an HR of 1.104 for each increment of 1 in the score.6 In another study involving patients with type 1 diabetes, the aDCSI, which was treated as a time-varying covariate, was also found to be positively correlated with all-cause mortality, with an HR of 1.30.23 In a large cohort of more than 150,000 patients with diabetes based on claims data, the adjusted HRs for aDCSI scores of 1, 3 and ≥5 versus scores of 0 were 0.91, 1.31 and 2.33, respectively.10 In a population-based study including 27,000 patients with new-onset diabetes, an HR of 1.13 was reported.11 In the studies mentioned above, the HRs of aDCSI for all-cause mortality ranged from 1.1 to 1.3, which is comparable to the HR of 1.21 found in this study.
In contrast, a large German cohort study showed that the aDCSI is negatively associated with death, with an HR of 0.984, while it is paradoxically positively associated with macrovascular events, microvascular events, and diabetes-related hospitalization.7 One plausible explanation is that in the German study, the model adjusted for several variables, including systolic blood pressure, body mass index and HbA1c, which were not adjusted in the other studies. It is possible that the adjustment of these factors might have altered the apparent relationship between the aDCSI and mortality, but it cannot explain the paradox that the DCSI remained a significant risk factor for all other adverse events with the same adjustment. Furthermore, our study and the German study concurrently included both the CCI and the aDCSI in one model, but the other studies did not. If both the CCI and the aDCSI were included in the model, the HR of the aDCSI would likely shift toward a lower value in both our study and the German study.
Diabetes is associated with hepatocellular carcinoma, pancreatic cancer, endometrial cancer, colorectal cancer, breast cancer and bladder cancer.34 Several components of metabolic syndrome, including abdominal obesity, hyperglycemia and hyperinsulinemia, are known risk factors of cancer.35 Nonetheless, the correlation between diabetes severity and cancer risk is complicated. A review study reported a U-shaped relationship between HbA1c and cancer,36 and two recent studies using UK Biobank data showed conflicting results.37 38 A prolonged duration of diabetes may be associated with an increased risk of liver cancer39 but not pancreatic cancer.40 41 In addition, poor glycemic control in patient with cancer and pre-existing diabetes is associated with poor survival.42 The aDCSI was only weakly associated with cancer mortality in our study and even had an HR slightly less than one when combined with the CCI. The association may be due to increased incidence of cancer and/or poorer survival after diagnosis of cancer. Additional studies are necessary to explore the existence of any causal relationship between diabetes severity and cancer mortality.37 Chronic pulmonary and liver disease are included in the CCI and are risk factors for several kinds of malignancy. This could partially explain why the CCI may be a stronger predictor of cancer mortality than the aDCSI.
Although CVD mortality has declined notably over time,43 it still accounts for more than one-third of deaths in people with diabetes.44 There is abundant evidence showing a correlation between diabetes severity—mainly measured by HbA1c—and CVD mortality. However, the association is J-shaped rather than linear, with a slightly increased risk at <6%, a nadir at 6%–7%, and then a substantially increasing risk as the HbA1c rises.43 45 According to our research, the aDCSI outperforms the CCI in terms of its ability to predict CVD mortality. Similar findings were found in another study that kept the aDCSI in their final model, whereas the CCI was dropped during stepwise selection.46 Moreover, the additional inclusion of antidiabetic medications and HbA1c only marginally improved its performance. Notably, our model performed similarly in terms of the C-index with only three variables compared with their model with 17 variables. Whenever adjusting the severity of diabetes is required in CVD research, the aDCSI should be taken into account due to its good performance in predicting CVD mortality, especially when laboratory data are not available.
More specifically, the younger age group in this study had higher HRs of aDCSI and CCI for all-cause and cause-specific mortality. Similar patterns have also been observed in a Mexican prospective cohort, where diabetes duration is linked to a higher relative risk of death in a younger age group (35–59 years).47 These findings also coincide with the fact that the age at diagnosis of diabetes is inversely correlated with the relative risk of morbidity and mortality.48 Similar results have been reported for other chronic diseases.49 A plausible explanation is that adults who are younger at diagnosis may have a worse glycemic control, beta cell dysfunction and insulin resistance.48 Another possible reason is that younger adults have a low baseline risk for mortality. Thus, a risk factor that causes the same absolute risk increase for both younger and older adults can lead to a higher relative risk for younger than older adults who have a higher baseline risk of mortality.49
Furthermore, the time-varying HRs of baseline time-fixed scores in this study declined over time for both the aDCSI and the CCI. However, the aDCSI remained significantly associated with all causes, CVD, and diabetes mortality even after 8 years. One study from the USA showed that HbA1c was found to be less strongly correlated with mortality at >5 years compared with 2–5 years.43 Compared with CCI and HbA1c, the aDCSI may serve as a better long-term mortality predictor in patients with diabetes. In clinical practice, a better prediction of long-term mortality among patients with type 2 diabetes is important as such information can help to identify high-risk patients, prioritize treatments and interventions for monitoring and disease management. Hence, all these may help to lead to improved outcomes among patients with type 2 diabetes. The findings may also serve as important policy references for more effective resource allocation to reduce complications and mortality associated with type 2 diabetes.
In our study, in addition to modeling the severity of diabetes as a time-fixed variable, we constructed models to treat severity scores as time-varying variables. The models with time-varying scores not only showed stronger associations between severity scores and mortality but also yielded better model fits. This finding is reasonable, as the correlation between baseline comorbidities and outcome was likely to attenuate over time due to the dynamic nature of the disease trajectory. A large cohort study from the UK reported similar findings, namely, that the time-varying CCI had a greater prognostic impact than the time-fixed baseline CCI in predicting mortality.50 The drawback is that handling time-varying covariates and carrying out time-dependent analyses can be challenging, and complete data for the follow-up period are not always accessible. Moreover, the severity of diabetes may serve as both an intermediate variable and a confounder in some studies.51 Alternative statistical methods should be applied in this situation because standard regression models that adjust either baseline or time-dependent covariables fail to yield consistent estimators.
A few limitations should be noted. First, due to data limitations, several potential confounders, including body mass index, tobacco and alcohol use, and lifestyle behaviors such as diet and physical activity could not be taken into consideration in this study. In addition, laboratory data such as HbA1c and renal function tests are also lacking. Nonetheless, the lack of laboratory data may not significantly compromise the results, as studies have shown similar risk estimates for hospitalizations4 and major adverse cardiovascular events46 between the models with and without these variables. Second, since the aDCSI is based on claims data, the validity of the diagnosis may be critical to the accuracy of the aDCSI. According to a previous validation study,10 the accuracy of diagnoses in NHIRD is generally acceptable. Additionally, the performance of the aDCSI has been tested in different dimensions in other studies using the NHIRD.5 52 Third, the ICD-9 version of the aDCSI was adopted in this study, whereas the ICD-10 is now commonly used around the world. Because a validation study revealed that the ICD-10 version of the aDCSI has a performance comparable with its ICD-9 version,10 it is reasonable to believe that our findings will hold true if the ICD-10 version is used. Last, approximately 40% of aDCSI complications and 40% of CCI comorbidities overlapped: 20 of 51 aDCSI complications can be mapped to 7 of 17 CCI categories (cerebrovascular disease, congestive heart failure, diabetes, diabetes with chronic complications, peripheral vascular disease, myocardial infarction and renal disease). Collinearity between the two scores may lead to less reliable coefficient estimates, but it does not reduce the predictive capability or reliability of the regression model as a whole.53 Our results also confirmed that the models incorporating both scores yielded the best model fits. Therefore, both the aDCSI and the CCI are recommended to be included in the analysis when mortality is the main outcome.
Conclusion
In conclusion, the aDCSI and CCI are both significant risk indicators of mortality in patients with type 2 diabetes. The significant association between the aDCSI and mortality, both in the short and long term, implies that the aDCSI serves as a reliable measure of the severity of diabetes. The predictive power of the aDCSI is better than that of the CCI for deaths from CVD and diabetes but not deaths from cancer. Incorporating both the aDCSI and the CCI simultaneously in a risk model may yield a better performance.
Data availability statement
No data are available.
Ethics statements
Patient consent for publication
Ethics approval
The study was approved by the Institutional Review Board of Taipei Veterans General Hospital (2019-07-054BC). IRB waived the need for individual informed consent because all the identification data were encrypted.
References
Supplementary materials
Supplementary Data
This web only file has been produced by the BMJ Publishing Group from an electronic file supplied by the author(s) and has not been edited for content.
Footnotes
Contributors Conception or design: Y-WH, C-MY, Y-JC. Acquisition, analysis or interpretation of data: Y-WH, C-MY, C-JL. Drafting the work or revising: Y-WH, NH, Y-JC, C-JL, T-JC. Final approval of the manuscript: Y-WH, NH, Y-JC. Guarantor: Y-WH
Funding The authors have not declared a specific grant for this research from any funding agency in the public, commercial or not-for-profit sectors.
Competing interests None declared.
Provenance and peer review Not commissioned; externally peer reviewed.
Supplemental material This content has been supplied by the author(s). It has not been vetted by BMJ Publishing Group Limited (BMJ) and may not have been peer-reviewed. Any opinions or recommendations discussed are solely those of the author(s) and are not endorsed by BMJ. BMJ disclaims all liability and responsibility arising from any reliance placed on the content. Where the content includes any translated material, BMJ does not warrant the accuracy and reliability of the translations (including but not limited to local regulations, clinical guidelines, terminology, drug names and drug dosages), and is not responsible for any error and/or omissions arising from translation and adaptation or otherwise.