Article Text

Abstract
Objective Impaired diabetic wound healing is one of the serious complications associated with diabetes. In patients with diabetes, this impairment is characterized by several physiological abnormalities such as metabolic changes, reduced collagen production, and diminished angiogenesis. We designed and developed a multimodal optical imaging system that can longitudinally monitor formation of new blood vessels, metabolic changes, and collagen deposition in a non-invasive, label-free manner.
Research design and methods The closure of a skin wound in (db/db) mice, which presents delayed wound healing pathologically similar to conditions in human type 2 diabetes mellitus, was non-invasively followed using the custom-built multimodal microscope. In this microscope, optical coherence tomography angiography was used for studying neovascularization, fluorescence lifetime imaging microscopy for nicotinamide adenine dinucleotide (phosphate) (NAD(P)H) assessment, fluorescence intensity changes of NAD(P)H and flavin adenine dinucleotide (FAD) cofactors for evaluating metabolic changes, and second harmonic generation microscopy for analyzing collagen deposition and organization. The animals were separated into four groups: control, placebo, low concentration (LC), and high concentration (HC) treatment. Images of the wound and surrounding areas were acquired at different time points during a 28-day period.
Results Various physiological changes measured using the optical imaging modalities at different phases of wound healing were compared. A statistically significant improvement in the functional relationship between angiogenesis, metabolism, and structural integrity was observed in the HC group.
Conclusions This study demonstrated the capability of multimodal optical imaging to non-invasively monitor various physiological aspects of the wound healing process, and thus become a promising tool in the development of better diagnostic, treatment, and monitoring strategies for diabetic wound care.
- pharmacodynamics
- metabolic disturbances
- microvascular changes
- imaging systems
Data availability statement
Data are available upon reasonable request and through a collaborative agreement. All data relevant to the study are included in the article or uploaded as supplementary information. Imaging data generated during this study may be available upon request.
This is an open access article distributed in accordance with the Creative Commons Attribution Non Commercial (CC BY-NC 4.0) license, which permits others to distribute, remix, adapt, build upon this work non-commercially, and license their derivative works on different terms, provided the original work is properly cited, appropriate credit is given, any changes made indicated, and the use is non-commercial. See: http://creativecommons.org/licenses/by-nc/4.0/.
Statistics from Altmetric.com
Significance of this study
What is already known about this subject?
Wound healing requires a well-orchestrated integration of complex physiological processes involving angiogenesis, cell migration and proliferation, and structural remodeling. In order to develop more effective therapies for wound care in patients with diabetes, deeper insights into the diabetic wound healing process are needed.
What are the new findings?
In this preclinical study using a diabetic mouse model, the capability of multimodal optical imaging techniques to longitudinally monitor various physiological events of skin wound healing under treatment with an angiogenesis-promoting topical formulation was demonstrated in a non-invasive, label-free manner in vivo.
How might these results change the focus of research or clinical practice?
This study showed that it is critical to obtain complementary structural and functional information from the wound region to better understand complex physiological processes occurring during the wound healing process, where imaging techniques can play a crucial role in the development of more effective therapies for wound care in patients with diabetes.
Introduction
According to the National Diabetes Statistics from the Centers for Disease Control and Prevention, released in 2017, approximately 9.4% of the US population is living with diabetes.1 Impaired wound healing is a serious complication associated with diabetes, often leading to pain, suffering, and poor quality of life for patients. Diabetic foot ulcers occur in 15% of all patients with diabetes and precede 84% of diabetes-related lower leg amputations.2 Wound healing is a complex physiological process involving cellular responses to injury through activation of multiple cell types such as keratinocytes, fibroblasts, endothelial cells, macrophages, and platelets. A better understanding of the dynamic cellular-level changes that occur during wound healing is needed to develop more effective therapies for wound care in patients with diabetes.
Wound healing has three main phases: inflammation, proliferation, and remodeling.3–8 Inflammation is the initial reaction of the body to injury, and can be divided into vascular and cellular responses. Re-epithelialization, angiogenesis, and fibroplasia occur during the proliferative phase. Subsequently, skin shows epidermis maturation, wound contraction, apoptosis, and scar maturation during the remodeling phase. Diabetes disrupts normal wound healing, altering the skin microenvironment, and leading to a delayed response to injury. Disrupted blood flow slows the angiogenesis process, and diabetic skin shows metabolic disturbances as well as dysfunctional neocollagenesis in response to injury.9 10
New therapeutic drugs are being developed to improve skin wound healing in patients with diabetes.11 12 Preclinical studies in animal models play a crucial role in the drug development process by providing deeper insights into diabetic wound healing. However, there is a lack of tools that can longitudinally and non-invasively monitor angiogenesis, metabolic changes, and collagen deposition in vivo.13 Multimodal label-free optical imaging provides real-time quantitative assessment of skin structure and physiology based on different optical properties of tissue.14–16 The combination of state-of-the-art imaging modalities such as optical coherence tomography angiography (OCTA), second harmonic generation (SHG), fluorescence lifetime imaging microscopy (FLIM), and multiphoton microscopy (MPM) in one imaging platform enables non-invasive visualization of microvasculature, metabolic changes, and collagen fiber organization.14 Therefore, these imaging technologies can help investigators better understand the pharmacodynamic effects of a candidate drug during wound healing.
Significant progress has been achieved in the field of non-invasive optical imaging by the advancements in laser technology and computational power. OCTA is widely used for quantifying and monitoring microcirculation, and is currently replacing traditional ophthalmic angiography methods such as color fundus photography, fluorescein angiography, and indocyanine green angiography.17–19 OCTA generates angiographic images based on intensity and phase fluctuations of the backscattered light. MPM allows label-free imaging of endogenous fluorophores in skin, such as nicotinamide adenine dinucleotide (phosphate) (NAD(P)H), and flavin adenine dinucleotide (FAD), which allows the investigation of cellular metabolic states.20 21 Additionally, MPM provides reduced tissue photodamage, photobleaching, and phototoxicity.22 FLIM provides additional information by measuring the autofluorescence lifetime of tissue, which helps to separate fluorophores with overlapping absorption and emission spectra.23 SHG microscopy is commonly used for imaging collagen fibers in the dermis.24 25 The highly crystalline triple-helix non-centrosymmetric structures of collagen fibers produce the second harmonic optical effect.26 27 Thus, SHG can be used to monitor collagen changes that occur in wound healing, cancer development, and fibrosis.28 29 In this study, pharmacodynamic mechanisms during skin wound healing in diabetic mice were investigated in vivo using a custom-built multimodal imaging platform combining MPM, OCTA, SHG, and FLIM techniques.
Research design and methods
Animal study design
All studies were conducted in accordance with the GlaxoSmithKline (GSK) policy on the Care, Welfare and Treatment of Laboratory Animals, and were reviewed by the Institutional Animal Care and Use Committee at the University of Illinois at Urbana-Champaign.
Formulations containing GSK2212842A, a tool compound for hypoxia-inducible factor (HIF) prolyl hydroxylase inhibitor (PHI) from GSK, were used for wound treatment. The HIF-PHI axis has been shown to impact wound healing through multiple mechanisms including angiogenesis.11 In this study, 24 male db/db mice were placed in four different groups: control (C; no treatment), placebo (P; petrolatum), treatment low concentration (LC; 0.5% GSK2212842A), and treatment high concentration (HC; 2% GSK2212842A). All animals were in the age range of 7–9 weeks on the first day of imaging. The group assignment was randomized and blinded to the imaging operators to avoid bias during acquisition and analysis. Mice in the treatment groups were treated with 2 mg/cm2 of formulation delivered with a positive displacement pipette once per day for 14 days. Hair was removed prior to wounding to eliminate hair autofluorescence. A wound was made on the back of each animal using a 1 mm diameter biopsy punch. Then, epidermal skin was removed with forceps. Images of the wound and surrounding area were taken on days 0, 1 (wounding day), 3, 7, 10, 14, 21 and 28 using the custom-built multimodal optical microscope described in the following section. Mice were anesthetized (isoflurane gas mixed with oxygen) during the hair removal, wounding, and imaging procedures. The respiratory rate of the anesthetized animals was monitored during imaging with an electronic respiratory rate monitor, and the amount of isoflurane was manually adjusted to keep a constant regular breathing rate.
In vivo multimodal label-free imaging
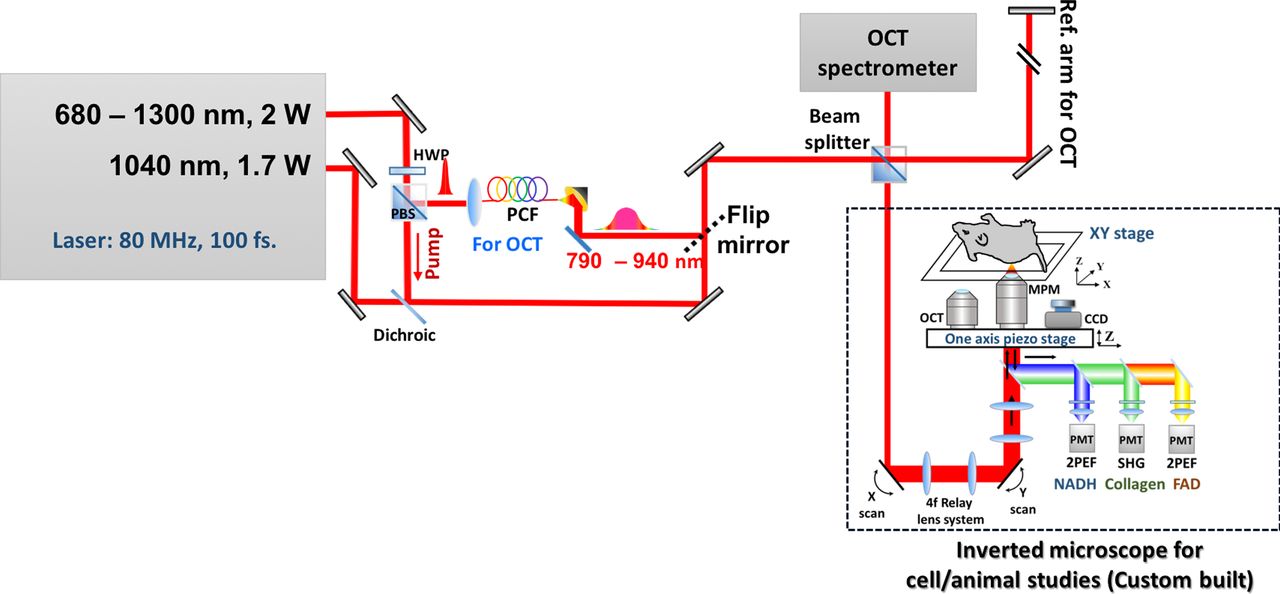
A custom-built multimodal imaging system was used for in vivo imaging of the wound and its surrounding area. Table 1 summarizes the characteristics of each modality used in this study. Figure 1 shows the schematic of the imaging system. A femtosecond laser source (Coherent Chameleon Discovery), with a tunable output from 660 to 1300 nm and a fixed secondary output at 1040 nm, was used to achieve multiwavelength excitation. The fixed laser output was used for SHG, while the tunable output was used for OCTA, FLIM, and two-photon excitation fluorescence (2PEF). For SHG imaging of collagen, the sample was excited at 1040 nm and the second harmonic signal was collected at 520 nm. The laser was tuned to 750 nm to excite NAD(P)H and the fluorescence emission was collected at 450±20 nm using a time-correlated single photon counting unit (HydraHarp 400, PicoQuant). For 2PEF imaging of FAD, the tunable source was set at 950 nm and the fluorescence emission was collected at 550±20 nm. In this system, OCTA images were obtained using a frequency-domain OCT set-up, which requires a broad bandwidth light source, a line scan camera, and a spectrometer. Hence, the light source was propagated through a photonic crystal fiber to achieve a broad spectral bandwidth of ~120 nm, centered at 850 nm. The backscattered light was measured with an OCT spectrometer (Cobra-S 800, Wasatch Photonics).

Schematic of the multimodal optical imaging system. The 80 MHz femtosecond laser offered two outputs: tunable (680–1300 nm) and fixed (1040 nm). A photonic crystal fiber (PCF) was used to generate broad band excitation (790–940 nm) needed for OCT. Two different objectives (high numerical aperture (NA) objective for multiphoton imaging and low NA objective for OCT) and a CCD camera were mounted on a piezo stage, which enabled sequential acquisition of multimodal images from the same location. The multimodal microscope is set up in an inverted, epi-detection configuration. Band-pass filters were used to split the emitted light into different spectral channels to separate signals from NAD(P)H, FAD, and collagen. A camera-based spectrometer was used for optical coherence tomography angiography (OCTA) and photos of the imaging location were obtained using the CCD camera. 2PEF, two-photon excitation fluorescence; CCD, charge-coupled device; FAD, flavin adenine dinucleotide; HWP, half-wave plate; MPM, multiphoton microscopy; NAD(P)H, nicotinamide adenine dinucleotide (phosphate); OCT, optical coherence tomography; PBS, polarizing beamsplitter; PMT, photomultiplier tube; SHG, second harmonic generation; VBA, variable beam attenuator.
Custom-built multiphoton microscopy system specifications
In clinical studies, dermatologists and pathologists use color photographs or histology images to visually examine and track the healing of a diabetic wound. Therefore, wound areas were illuminated with white light-emitting diode light and color photos were taken with a charge-coupled device (CCD) camera (MU9PC-MH, XIMEA). This camera was mounted on a horizontal stage (one-axis piezo positioner SLC-24120-LC, SmartAct) together with the OCT and multiphoton objectives to quickly switch between the imaging objectives and the CCD. Additionally, a vertical one-axis piezo positioner was used for focusing. An XY sample stage (SLC-24150-LC, SmartAct) was used to center the wound in the designated field of view and to allow for mosaic imaging.
In this study, SHG images were used to longitudinally analyze reorganization and formation of collagen inside and around the wound area. Mosaic images were acquired to cover a square field of view of 3.2 mm2. The open source CT-FIRE software was used to automatically extract collagen fibers in the SHG images and to provide descriptive statistics such as fiber angle, length, straightness, and width.27 OCTA was used to produce microvasculature images of the wound site. The OCTA images were acquired with a near-infrared spectrometer (Cobra 800, Wasatch Photonics). Five M-modes per frame were used to reconstruct the OCTA signal following a speckle variance approach.17 The OCT M-modes were coregistered using a subpixel 2D registration algorithm30 to reduce the bulk motion artifacts from breathing and cardiac motion. Three different angiography features were extracted from the OCTA images: (1) mean vessel diameter: diameters of the vessels in the vessel skeleton; (2) vessel density: ratio of vessel area with respect to the total image area; (3) branch density: number of branches divided by the total image area.
NAD(P)H-FLIM and FAD images were taken from a region ~600 µm away from the wound edge and ~20 µm from the stratum corneum (online supplementary figure S1). The NAD(P)H average fluorescence lifetime was calculated from the measured autofluorescence decay signal using a biexponential decay model in FLIMfit software.31 Three features were extracted from FLIM-NAD(P)H images: mean lifetime, free-NAD(P)H lifetime, and bound-NAD(P)H lifetime. Additionally, intensity images were computed from the cumulative fluorescence signal along the time dimension. Likewise, intensity images of two-photon FAD were acquired from the same fieldof-view as NAD(P)H-FLIM.
Supplemental material
Imaging procedure
Animals were placed in an anesthesia chamber for approximately 3 min before each imaging session. Then, a cover glass was placed on its back (online supplemental figure S2A) and the mice were positioned dorsal side down on the XY stage (online supplementary figure S2B). An anesthesia nose cone was attached to keep each mouse under anesthesia during the imaging session. A breathing rate monitor was placed on the ventral side of the body facing upwards, and a heating pad was gently placed on top of the animal to keep it warm during the imaging session. The wound was centered in the desired field of view using the CCD camera, and a color photo was taken. Next, an OCTA image was acquired and finally the multiphoton images (SHG, FLIM-NAD(P)H, and 2PEF-FAD) were taken.
Statistical analysis
Analyses were conducted using SAS V.9.4 (SAS Institute). Comparisons of continuous features between treatment groups were conducted using the Mann-Whitney U test and within treatment groups using the paired t-test or signed-rank test. Comparisons of categorical variables were assessed using χ2 or Fisher’s exact tests. The impact of influential observations, defined as greater than the µ±3σ (µ: mean; σ: SD), was determined; if results did not change after their removal, they were not excluded from the analysis, to allow use of the full data set. For modeling purposes, the features were standardized (µ=0, σ=1). Generalized linear mixed models and path analysis32–34 were used to test differences in features by group.
Generalized linear mixed models
The objective of the generalized linear mixed models was to examine differences in mean features across the groups by time. To accomplish this objective, PROC GLIMMIX or generalized linear models with repeated statement (PROC GENMOD) and an appropriate link function were used. Model fit was determined using the ratio of χ2 to its df (χ2/df), where a ratio larger than 2 indicates an inadequate fit.32 Pairwise comparisons were conducted using the LSMESTIMATE and the p values were adjusted for multiple comparisons using the Sidak test.33 A random subject (mouse) effect nested within group was included. Time was treated as a classification (categorical) variable. Models were adjusted for weight, treatment group, and treatment group × time interaction. Features that demonstrated interactions that were significant (p<0.05) or approaching significance (p<0.1) at one or more individual time points for at least one pairwise comparison of treatment groups were selected for inclusion in the next analysis phase (path analysis using latent variables).
Path analysis using latent variables
The objective of path analysis was two fold: (1) to understand the associations among the features when grouped into a higher level reflecting the wound healing components of angiogenic, structural, and metabolic features; (2) to use one model that incorporates all the wound healing components while accounting for trends over time. Time points were collapsed (combined) to correspond to the temporal stages of the wound healing process. Days 1 and 3 were combined to indicate the inflammatory stage; days 7, 10, and 14 for the proliferative stage; and days 21 and 28 for the remodeling stage. Day 0 was kept separate to indicate the prewound time.
The modeling process was conducted over two steps, consisting of the creation of latent factor scores followed by path analysis, according to the method of Ines Devlieger and Yves Rosseel.34 This modeling process was chosen as an alternative to structural equation modeling (SEM) due to the relatively small sample size; it yields regression parameters similar to SEM, and handles misspecification better than SEM due to the stepwise process.
Results
Longitudinal tracking of wound healing using multimodal optical imaging
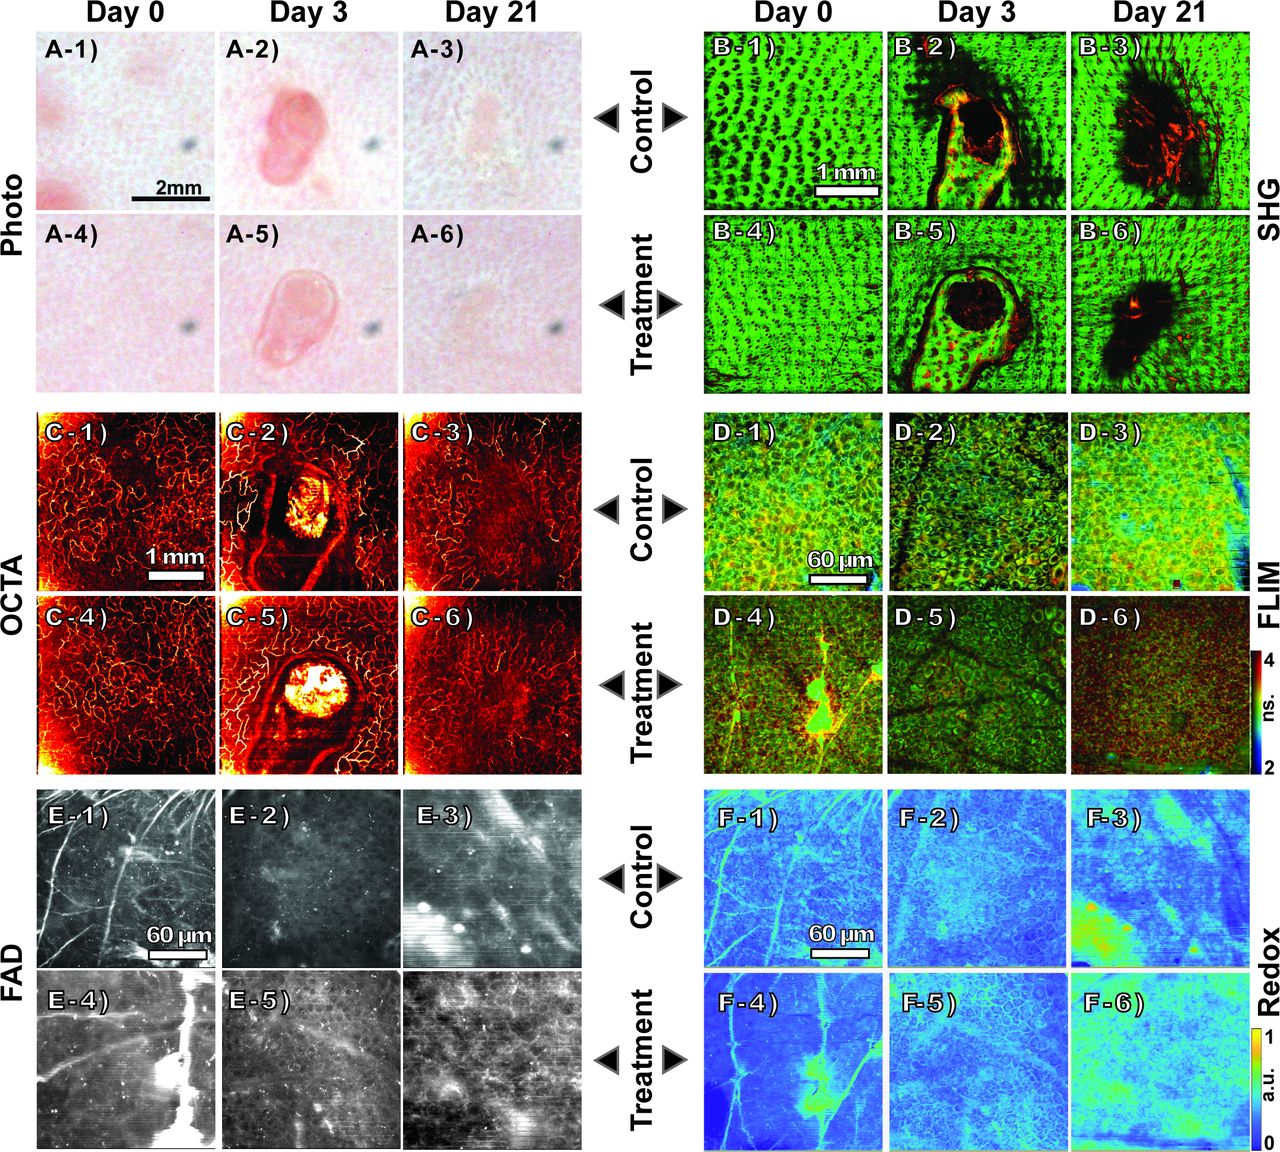
All mice were imaged on days 0, 1 (wounding day), 3, 7, 10, 14, 21 and 28 using the multimodal imaging system. Figure 2 shows representative multimodal images of the wounded area obtained in vivo from mice in the C and HC groups. In online supplementary figures S2–S6, representative multimodal images from each group taken at different time points are shown. The first step in the imaging process was to take a color photograph of the wound with the CCD camera (figure 2A and online supplementary figure S3) to visually analyze the closure of the wound. In all cases, the wound stretched until day 3 due to the inflammatory response, which generally lasts 3–5 days, and contracted afterwards, showing redness and swelling. The redness observed in the wound area declined considerably by day 21, towards the end of the proliferation phase and the beginning of the remodeling phase. However, color photographs of the wound did not provide information about structural and functional changes including neocollagenesis, angiogenesis, and metabolic changes during skin wound healing.

Representative multimodal optical images of the wound healing process of control (C) and high concentration (HC) treatment groups taken on days 0, 3, and 21. Color photographs of mouse skin wound sites from the C group (C: A-1 to A-3) and the HC group (HC: A-4 to A-6). SHG images showing the collagen reorganization around the wound and neocollagenesis inside the wound (C: B-1 to B-3; HC: B-4 to B-6). OCTA images of vascularization in the wound site revealing angiogenesis (C: C-1 to C-3; HC: C-4 to C-6). FLIM images (intensity weighted lifetime) of a region ~600 µm away from the wound edge (C: D-1 to D-3; HC: D-4 to D-6). FAD intensity images taken ~600 µm away from the wound edge (C: E-1 to E-3; LC: E-4 to E-6). Redox ratio images (C: F-1 to F-3; HC: F-4 to F-6). FAD, flavin adenine dinucleotide; FLIM, fluorescence lifetime imaging microscopy; OCTA, optical coherence tomography angiography; SHG, second harmonic generation.
Label-free optical imaging techniques allow non-invasively to visualize the dynamic changes in skin, which permit longitudinal follow-up of the wounded area to get deeper insights into the pharmacodynamic processes happening during the healing process. SHG images showing collagen reorganization during the wound repair are shown in figure 2B; the green signal shows the collagen fibers and the red signal, which comes from the 550 nm channel used for imaging of FAD, shows hair follicles and scab. The rearrangement of collagen fibers to facilitate the closure of the wound was observed after day 3 (online supplementary figure S4). After day 10, a significant amount of collagen formation was observed inside the wound. The newly formed collagen fibers in the wound bed area appear to have a different structural texture compared with the fibers in the surrounding area. Figure 2C shows examples of the longitudinal OCTA images of mouse skin taken on days 0, 3, and 21. In comparison to day 0, an increase in signal intensity from microvasculature was observed in the OCTA images on days 3 and 7, which indicate increased blood flow to the wound region (online supplementary figure S5). Dynamic changes in blood vessel distribution, including formation of new vessels in the wound bed area, were observed during later time points. In both treatment groups, new vessels were observed in the center of the wound by day 21.
To investigate metabolic changes during wound healing, fluorescence lifetime images of NAD(P)H distribution and FAD intensity images were obtained from the wound edge region (figure 2D,E). It was possible to visualize cellular/subcellular features of the epidermal keratinocytes from the NAD(P)H-FLIM images. Compared with FLIM images obtained on day 0, cells look enlarged on day 3 as illustrated in online supplementary figure S6, and the cell size decreased thereafter (figure 2D). As NAD(P)H is a cofactor involved in a wide range of cellular metabolic activities, determination of fluorescence lifetime parameters such as free and bound-NAD(P)H lifetimes and their fractions can provide information on the functional changes occurring during wound healing. FLIM images shown in figure 2D are false color coded based on the mean fluorescence lifetime. An increase in the proportion of longer fluorescence lifetime components was observed in all groups until day 10, and the mean fluorescence lifetime decreased during the subsequent time points (online supplementary figure S7). Epithelial cell regrowth was observed during the final stage of the proliferation stage (online supplementary figure S8). In addition to the NAD(P)H-FLIM images, cellular features were also visible in the FAD images (figure 2E). However, FAD fluorescence signal was weaker compared with the NAD(P)H fluorescence signal. A strong signal from some ridge-like features was observed in the FAD images during the earlier time points and they became less prominent after day 3 (online supplementary figure S9). Based on the measured NAD(P)H and FAD fluorescence intensities, optical redox ratio images [FAD/(FAD+NAD(P)H)] were constructed (figure 2F).
Quantification of physiological changes during wound healing
The multimodal label-free optical images obtained at different time points were quantitatively analyzed to gain a deeper understanding of the structural and functional changes during wound healing in each group of mice. NAD(P)H-FLIM and FAD images obtained from the wound edge region were analyzed to quantify metabolic changes from the extracted fluorescence intensity and lifetime parameters.35 Optical redox ratios estimated from the images at different time points are shown in figure 3A. All groups presented an initial decrease in redox ratio from day 1 to day 7, followed by an increase in redox ratio until day 28. These trends agree with the ones presented in previous studies.36 Both NAD(P)H and FAD intensities showed a slight decreasing trend until day 3, and decreased thereafter. The decrease in the NAD(P)H and FAD intensity until day 3 may be due to the dynamic changes associated with the inflammatory phase of wound healing. Likewise, a decline in mean NAD(P)H fluorescence lifetime was observed until day 3 (figure 3B). Subsequently, an increasing trend was observed in all groups until day 7, before returning to values closer to the initial state (day 0) by day 28. The decrease in fluorescence lifetime until day 3 can be due to the metabolic shift from oxidative phosphorylation towards glycolysis during the inflammatory phase of wound healing.21 36 Similarly, the subsequent increase in the fluorescence lifetime is possibly due to increased metabolic activity during the proliferative phase of wound healing. Statistically significant differences were not observed between the mean fluorescence lifetime estimated from different groups during wound healing. The bound-NAD(P)H fraction showed differences between the C group and the rest of the groups after day 7 (figure 3C).
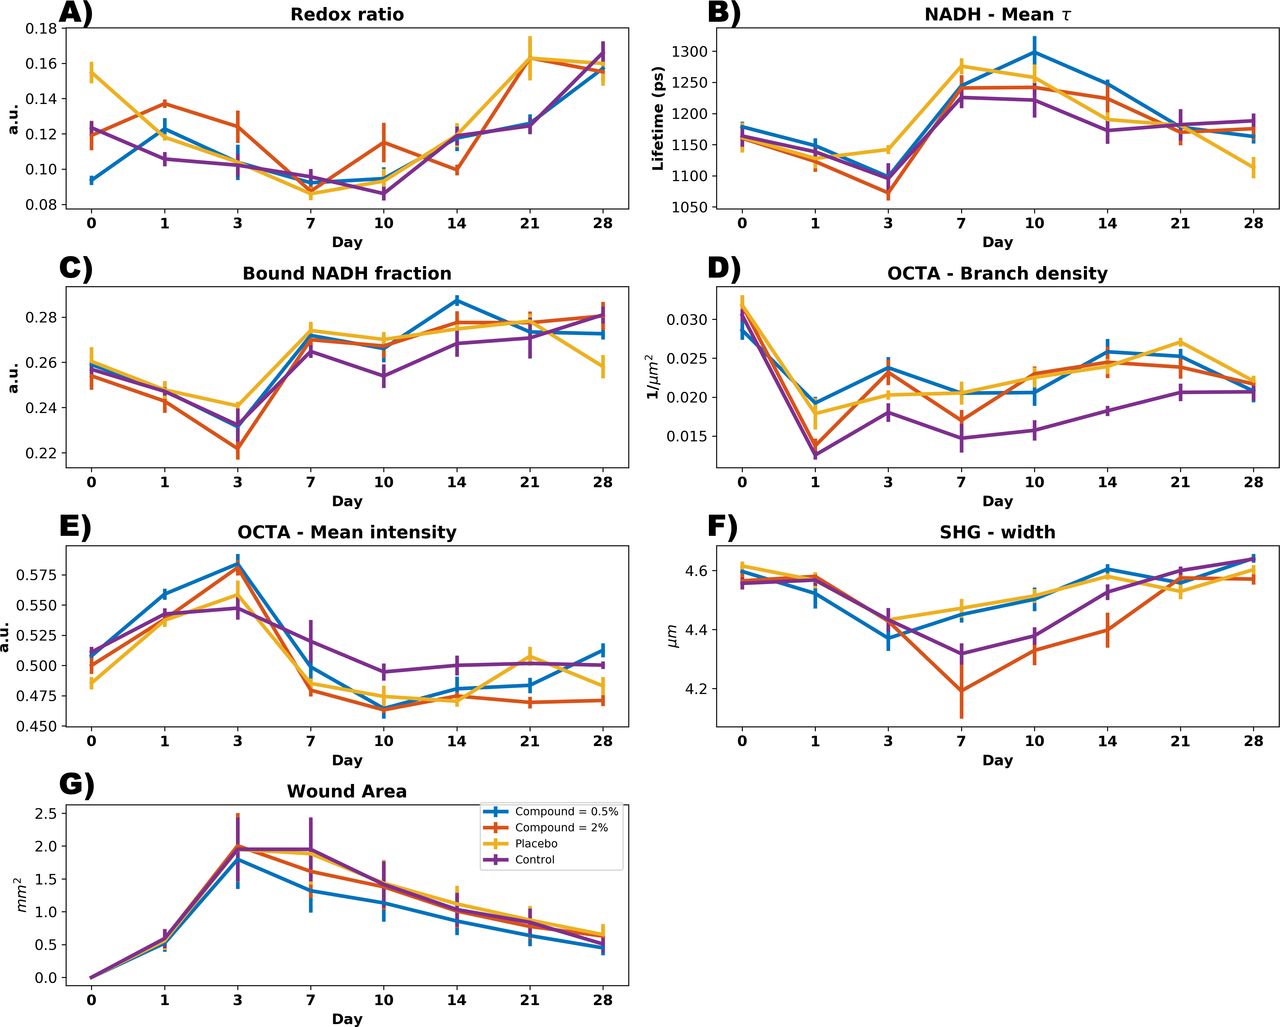
Quantitative analysis of optical parameters measured at different time points during wound healing: (A) redox ratio; (B) mean nicotinamide adenine dinucleotide (phosphate) (NAD(P)H) lifetime; (C) bound-NAD(P)H fraction; (D) OCTA mean intensity; (E) OCTA mean intensity; (F) SHG collagen fiber width; and (G) wound area estimated from the color photographs. OCTA, optical coherence tomography angiography; SHG, second harmonic generation.
To quantify the changes in blood vessel distribution during wound healing, OCTA images obtained at different time points were analyzed. As shown in figure 3D, the vessel branch density of the C group was considerably lower than the other groups after day 3, showing that angiogenesis was delayed for this group. Additionally, the mean intensity of the OCTA images increased until day 3 (figure 3E) and gradually decreased back to prewounding condition by day 10. These findings indicate that most of the vascular changes are occurring during the initial inflammatory and proliferative phases of wound healing. The longitudinal trend of OCTA intensity changes was similar across all four groups. In addition to the OCTA signal intensity, other vascular parameters including vessel diameter, vessel density, and branch density were calculated. From the SHG images showing collagen organizational changes during wound healing, various structural parameters of collagen such as angle, width, length, and straightness were determined (online supplementary figure S4). Mean width of the collagen fibers decreased until day 7, and the decrease was most significant in the HC group. By day 28, the mean width of collagen fibers was similar in all four groups (figure 3F). Pairwise comparisons between groups were conducted with the Sidak method for adjustment for multiplicity. This analytic approach is more appropriate than a t-test since the outcomes were not normally distributed. Moreover, the outcomes were assessed repeatedly over time (days 0, 1, 3, 7, 10, 14, 21, 28), implying their dependence (correlation). Statistically significant differences of the outcomes are presented in figure 3. Compared with the no treatment controls, the bound-NAD(P)H fraction consistently increased among mice treated with the 0.5% compound. However, this trend achieved significance at day 10 (estimate=−0.316) (SE=0.160) (p=0.048). The P group followed a similar trend. Compared with no treatment controls, mean OCTA–branch density was significantly higher among mice treated with the 2% compound (estimate=0.249) (p=0.020) and placebo (estimate=0.253) (p=0.019). Mean OCTA–mean intensity scores were higher in mice treated with the 0.5% compound than the no treatment controls at day 3 (estimate=0.109) (SE=0.053) (p=0.039). Among mice treated with the 0.5% compound, SHG–width levels started to rise after day 3, becoming statistically higher than the no treatment controls at day 10 (estimate=0.048) (SE=0.019) (p=0.015). Online supplementary table S1 shows p values derived from a one-way analysis of variance to compare the differences between the C group and the other groups.
The rationale for testing the path analysis using latent variables was to achieve the primary objective of determining the mechanism of action underlying the rate of wound healing (angiogenesis, structural changes, and metabolic changes) among diabetic (db/db) mice using non-invasive optical methods. However, the mechanism for the underlying process of wound healing is unobserved. Since the data are longitudinal, we needed to test the rate of change (slope) over time in the wound healing mechanism. Moreover, relationships needed to be tested simultaneously (in one model) to obtain estimates for each mechanism while accounting for the others. These complex analytical challenges dictate the need for a latent variable modeling approach including a SEM. This approach would allow the explicit representation of measurement error and the use of the repeated features across time by specifying a latent variable for the overall rate of change. In a SEM for longitudinal data, latent factors are created to represent the different aspects of the wound healing mechanism. The relationship among the latent factors is then tested using regression parameters. We tested a SEM but it did not converge given the limited sample size. Consequently, to satisfy the primary objective, we opted to conduct a phased approach as an alternative to the traditional SEM. According to the method of Ines Devlieger and Yves Rosseel,34 the latent factor scores are estimated based on latent variables created in factor analysis, and fed their variance-covariance matrix to a path analysis model to test the proposed relationships.
Standardized path coefficients (regression estimates) are reported in the manuscript to enable direct comparison of effects across groups. Hence, the dose-dependent changes are assessed as the difference in the magnitude of the associations between the treatment groups.
The secondary objective was to compare the mean features across the treatment groups, without accounting for the mechanism of the underlying wound healing process. This was accomplished by graphically depicting the features across group and time as in figure 3, and statistically comparing the values using generalized linear modeling.
Monitoring of pharmacodynamics during wound healing based on modeling multimodal microscopy outcomes
To further understand the functional relationships between various physiological features during wound healing, optical parameters determined from the multimodal images were analyzed using path analysis. Optical parameters related to each of the physiological features were grouped to form latent factors, which were used to perform the path analysis. The features that were found to differ between the groups at the 5% or 10% significance level in the mixed models consisted of: OCTA mean intensity (used to derive a latent factor related to angiogenesis), SHG angle (structural integrity), and NAD(P)H fluorescence intensity and lifetime (metabolism). These features were selected for inclusion in the path analysis, with the exception of SHG features. As shown in figure 4, it was possible to estimate the magnitude and direction of the relationship between the features from the path coefficients calculated.

Pathway analysis showing: (A) grouping of optical parameters from different time points to form the latent factors related to physiological features such as angiogenesis, structural integrity and metabolism; (B) functional relationship between various physiological (latent) factors during the wound healing process. Numbers shown beside the arrows indicate the calculated path coefficients. HC, high concentration; LC, low concentration; OCTA, optical coherence tomography angiography; NAD(P)H, nicotinamide adenine dinucleotide (phosphate); SHG, second harmonic generation.
Among the four groups, a significant effect of angiogenesis on metabolism and structural integrity (0.94 and 0.89, respectively) was observed in the HC group (figure 4). Both effects were relatively large and similar. Although weaker than the indirect effect via metabolism, a significant direct effect of angiogenesis on structural integrity was also noted in the HC group (0.84). A significant effect of angiogenesis on metabolism was also observed in the C group (0.78). However, the effect was weaker compared with the HC group. No significant path effects were observed in the P and LC groups. These results demonstrated the capability of multimodal optical imaging techniques to non-invasively determine the pharmacodynamics during wound healing. Although the longitudinal trends of various measured optical parameters looked similar, path analysis showed that functional relationships of various physiological parameters such as angiogenesis, metabolism, and structural integrity were significantly stronger in the HC group.
Discussion
The objective of this study was to demonstrate the capability of optical imaging techniques to monitor the in vivo wound healing process in diabetic mouse skin, and to investigate the pharmacodynamic mechanisms of a topical formulation of an HIF-PHI. Currently, wound assessment is carried out in clinical practice by a physician by monitoring clinical signs and symptoms of infection such as erythema, edema, heat, and pain.35 For further qualitative and quantitative assessments, tissue samples collected via biopsies or needle aspiration techniques are employed. However, biopsies result in further enlargement of the wound and only provide information related to the region from which the biopsy was obtained at a single time point. Several studies demonstrating the potential of optical imaging approaches for non-invasive skin imaging applications have been reported.15 21 24 36 In this study, we employed a unique approach combining several optical imaging techniques including OCTA, FLIM, 2PEF, and SHG to obtain comprehensive information of skin wound healing in diabetic mice treated with an angiogenesis-promoting topical formulation of an HIF-PHI.
Angiogenesis plays a crucial role in wound healing by forming new blood vessels from pre-existing vasculature. In wounds, a hypoxic environment is created due to capillary injury, which triggers the release of growth factors essential for angiogenesis. However, this process is often dysfunctional in non-healing diabetic wounds.37 The topical formulation investigated in this study stimulates angiogenesis by promoting local physiological conditions that mimic hypoxia via inhibition of HIF-PHI, key regulators of HIF.11 12 HIF stabilization results in activation of the pathways that mediate the tissue response to hypoxia by promoting angiogenesis, which in turn will aid in the wound healing process. The pharmacodynamic mechanisms of the formulation under investigation are characterized in this study using multimodal optical imaging, and by longitudinally tracking wound healing.
During the inflammatory phase of wound healing (days 1–3), a decrease in the NAD(P)H mean fluorescence lifetime and redox ratio was observed. This decrease can be attributed to the decrease in the amount of protein-bound NAD(P)H, or due to a decrease in the fluorescence lifetime because of NAD(P)H binding to shorter lifetime enzymes, or a combination of both. This observation agrees with previous studies21 38 and suggests an increase in glycolysis under hypoxic conditions immediately following the injury. Changes in metabolism with respect to distance from the wound were not quantified in this study. However, this assessment would provide valuable information for future studies in human skin. Meanwhile, elevated OCTA intensity, indicating increased blood flow to the wound area, was observed. This increase in OCTA intensity by day 3 was most prominent in the two treatment groups (LC and HC), which confirms the role of the topical formulation GSK2212842A in promoting angiogenesis. Although this observation did not show statistical significance, the trend was consistent over the C group. During the subsequent proliferative phase of wound healing (days 3–10), an increase in the NAD(P)H fluorescence lifetime was observed, which may be associated with the increase in the metabolic activity as new tissue is formed in the wound. However, the mean OCTA intensity decreased during the same period. During the remodeling phase (days 10–28), an increase in the redox ratio and collagen fiber width, and a decrease in mean NAD(P)H fluorescence lifetime, were observed. These variations can be correlated with the removal of cells that were used to repair the wound via apoptosis and maturation of collagen fibers occurring during this phase.
There are unknown fluorescent elements in the FAD images such as the ridge-like features. The stratum corneum is highly fluorescent and contributes to the collected fluorescence. In multiphoton imaging of tissue, multiple elements may be excited with the light source and produce fluorescence. However, the majority of the changes in fluorescence come from metabolic changes.21 36 38
Some of the challenges encountered during this study include: (1) scab formation: scabs were formed on the wound surface during the healing process; (2) hair regrowth: although hair was removed from the back (~2×2 cm2) prior to wounding on day 0, hair started to regrow towards the later time points of the study; (3) breathing artifacts: artifacts due to breathing motion were visible in some images. The formation of a scab and hair regrowth made it difficult to ensure good coupling between the wound region and the glass coverslip, adversely affecting image quality. Coupling and motion artifacts made some images unusable. Those images were considered as influential observations (outliers) and were not included in the quantitative analysis. Another limitation of this study was that the blood glucose level variations among diabetic mice in each group were not considered. Additionally, this study did not account for the variations in physiological function of individual mice due to the effect of anesthesia given for ~1 hour during each imaging procedure, although the administration of anesthesia was consistent between all groups.
The smaller punch biopsy size is a limitation of this study and further studies with larger wound sizes are needed. Typically, ~6 mm diameter punch biopsy wounds are created for wound healing research. In our case, the imaging area was restricted to a maximum of ~4×4 mm2. As the images in online supplementary figures S3–S5 depicted, the wound in diabetic mouse skin stretches covering most of the imaging area. Additionally, a 1 mm biopsy size was used to keep the study design similar to the previous study from our group.38 39
In summary, this study demonstrated the capability of multimodal optical imaging for the in vivo non-invasive longitudinal evaluation of the pharmacodynamic effects of a topical formulation on skin structure and function during wound healing. Moreover, this study showed the importance of obtaining complementary structural and functional information from the wound region. The analysis of the combined multimodal image data revealed significant improvement in the functional relationship between angiogenesis, metabolism, and structural integrity in the mice treated with the HC formulation. Thus, multimodal optical imaging techniques can become a promising imaging tool for improving our understanding of impaired wound healing in diabetic preclinical animal models, as well as in patients, and can play a crucial role in the development of better medications by providing deeper insights into the pharmacodynamic mechanisms in wound healing.
Data availability statement
Data are available upon reasonable request and through a collaborative agreement. All data relevant to the study are included in the article or uploaded as supplementary information. Imaging data generated during this study may be available upon request.
Ethics statements
Acknowledgments
This research was conducted at the Center for Optical Molecular Imaging at the Beckman Institute for Advanced Science and Technology.
References
Supplementary materials
Supplementary Data
This web only file has been produced by the BMJ Publishing Group from an electronic file supplied by the author(s) and has not been edited for content.
Footnotes
JR-J and JHL are joint first authors.
Correction notice This article has been corrected since it was published. Darold R Spillman, Jr. has been added as an author and contributors section updated accordingly.
Contributors JRJ, JHL and AA built the optical system, acquired the images, processed the data, and wrote the manuscript. SM performed the data analysis. EC, RB and MM handled the animals and applied the treatment. EO, DA, ZA and SAB contributed to the study design and/or directed the study. SAB is the guarantor of this work and, as such, had full access to all the data in the study and takes responsibility for the integrity of the data and the accuracy of the data analysis. DRS designed and helped build the stage setup, which included the CCD camera, the LED illumination, and microscope objective movement. All authors reviewed and revised the manuscript prior to publication.
Funding This work was supported by GlaxoSmithKline.
Competing interests None declared.
Provenance and peer review Not commissioned; externally peer reviewed.