Article Text

Abstract
Introduction Investigators have struggled to produce a reliable chronic wound model. Recent progress with antioxidant enzyme inhibitors shows promise, but mortality rates are high. We modified the dosage and administration of an antioxidant enzyme inhibitor regimen to reduce mortality while inducing a chronic wound environment.
Research design and methods To chemically induce a chronic wound environment, we applied modified doses of catalase (3-amino-1,2,4-triazole; intraperitoneal 0.5 g/kg) and glutathione peroxidase (mercaptosuccinic acid; topical 300 mg/kg) inhibitors to the dorsal wounds of 11-week-old db/db mice. A cohort of these mice was treated with a collagen-glycosaminoglycan scaffold. Both groups were compared with Diabetic control mice.
Results This study successfully induced a chronic wound in 11-week-old db/db mice, with no animal deaths. The antioxidant enzyme treated groups showed delayed wound contraction and significantly higher levels of inflammatory tissue, collagen deposition, cellular proliferation and leukocyte infiltration than the Diabetic control group. Angiogenesis was significantly higher in the antioxidant enzyme treated groups, but the vessels were immature and friable. Scaffold engraftment was poor but appeared to promote blood vessel maturation.
Conclusions Overall, the two in vivo groups treated with the antioxidant enzyme inhibitors appeared to be arrested in the inflammatory stage of wound healing, while the Diabetic control group progressed to the maturation phase and ultimately remodeling. This model may be instrumental for the development of new wound therapeutics.
- chronic wound(s)
- mouse model(s)
- regeneration
- wound healing
This is an open access article distributed in accordance with the Creative Commons Attribution Non Commercial (CC BY-NC 4.0) license, which permits others to distribute, remix, adapt, build upon this work non-commercially, and license their derivative works on different terms, provided the original work is properly cited, appropriate credit is given, any changes made indicated, and the use is non-commercial. See: http://creativecommons.org/licenses/by-nc/4.0/.
Statistics from Altmetric.com
Significance of this study
What is already known about this subject?
Antioxidant enzyme inhibitors have been used to induce a chronic wound in 6-month-old mice. Attempts by us to repeat the established dosage protocol in 6-month-old and 11-week-old mice to test therapeutics resulted in high mortality.
What are the new findings?
We modified the antioxidant enzyme inhibitor dosage to induce a chronic wound in 11-week-old diabetic mice. The chronic wound showed delayed wound contraction and higher levels of cellular infiltration, collagen deposition, keratinocytes and leukocyte infiltration.
How might these results change the focus of research or clinical practice?
This novel model is reliable, easily reproducible, with low mortality, and less expensive. It can be instrumental for the development of new wound therapeutics.
Introduction
Chronic wounds, defined as those that do not timely progress through the set order of healing stages, represent a major healthcare challenge, significantly impacting patients’ quality of life and economically burdening society.1 In terms of numbers, in the US alone, approximately 6.5 million people are affected by chronic wounds, a rate that is estimated to cost more than $25 billion annually.2 3 Chronic wounds predominantly occur in the elderly and in patients with diabetes. Type 2 diabetes is a common, costly condition affecting an estimated 23.1 million people and costing more than $245 billion a year in the USA.4 5 Furthermore, more than a third of children born in the USA in 2000 are projected to develop diabetes in the future.6 Given the aging population and the rising rates of diabetes, chronic wounds are becoming increasingly prevalent.
It is well established that acute wounds heal through four overlapping stages, that is, hemostasis, inflammation, proliferation and finally wound remodeling.7–9 Unlike acute wounds, chronic wounds, which include venous, arterial and pressure ulcers, are characterized by a prolonged inflammatory stage and, consequently, high levels of proinflammatory cytokines, reactive oxygen species (ROS), and proteases.10–12
Chronic wounds can become stalled at any stage of healing, from initial presentation to near-closure.13 Studies on chronic wounds have shown presence of higher than normal levels of macrophages leading to overproduction of the inflammatory cytokine tumor necrosis factor alpha (TNFα; figure 1A).14 This factor, in controlled release, is permissive of proper wound healing as it is involved in fibroblast proliferation, migration and remodeling. When upregulated, TNFα induces chronicity through production of ROS and degradation of the extracellular cell matrix.15–18 High levels of ROS in diabetic wounds are believed to be the result of low levels of glutathione and, hence, glutathione peroxidase (GPx) activity.19 In turn, ROS have been shown to promote leukocyte adhesion and chemotaxis of proinflammatory factors into the wound, while inhibiting keratinocyte migration and re-epithelization.20 21 Presence of high titers of bacterial colonies, particularly species such as Staphylococcus aureus and coagulase-negative staphylococci, have been well noted in human chronic wounds.22–24

(A) Acute and chronic wounds. Acute wound healing is characterized by early re-epithelization, in contrast to chronic wound healing which is characterized by hyperproliferation of inflammatory cells, including macrophages and neutrophils, as well as high numbers of immature and friable microvessels. This environment enables bacterial infiltration and biofilm formation. (B) Development of a chronic wound. Acute wounds are characterized by a breakdown in reactive oxygen species, with the enzymes catalase and glutathione peroxidase having significant functions. Inhibition of these enzymes, using MSA and ATZ, leads to decreased ROS breakdown, resulting in excess ROS, induction of chronicity and excess bacterial load. (C) Study design. Thirty-two db/db mice received intraperitoneal injections of ATZ followed by a full-thickness dorsal skin wound (1 cm2). MSA was applied topically to the wound bed, washed off, and the wounds were covered with occlusive dressing (Chronic diabetic group) or a collagen-glycosaminoglycan implant plus occlusive dressing (Treated chronic diabetic group). Fifteen db/db mice underwent dorsal wounding and were covered with occlusive dressing (Diabetic control group). ATZ, 3-amino-1,2,4-triazole; MSA, mercaptosuccinic acid; ROS, reactive oxygen species.
Streptozotocin-induced apoptosis of the pancreatic β-cells has been shown to increase oxidative stress through increased production of ROS.25–28 In an early study, Goodson and Hung used Streptozotocin to induce type I diabetes in rats and noted delayed wound healing a wound model.29 The Streptozotocin protocol was successfully replicated 40 years later to induce a rat model of type II diabetes.30
Manipulation of the wound redox environment specifically has been shown to lead to the development of chronic wounds in 6-month-old db/db mice, a model of type II diabetes. Specifically, Dhall et al induced chronicity by manipulating the redox environment through inhibition of two antioxidant enzymes with the inhibitors 3-amino-1,2,4-triazole (ATZ; catalase inhibitor) and mercaptosuccinic acid (MSA; GPx inhibitor) (figure 1B).31 According to the group’s methods protocol, published in a later study, the study included only mice that were at least 6 months of age and weighed on average 60 g as mice that were younger, or weighed less than 50 g, did not survive their chronic wound model.31 32
This induction of chronicity has yet to be replicated in younger db/db mice. Attempts to replicate the Dhall et al protocol31 in 11-week-old and 8-month-old mice to be used as a testing platform resulted in extensive mortality (online supplementary table 1). The purpose of this study was to define and optimize the previously described type-2 diabetic chronic wound healing murine model in 11-week-old mice to be adopted as a testing platform for the development of novel regenerative scaffolds. Currently available animal models fail to replicate the complex pathophysiology of chronic diabetic wounds and, hence, do not provide a reliable method for effective preclinical testing of therapeutics. This study aims to address these challenges, optimize a reliable and effective murine model, and validate it by testing a regenerative scaffold.
Supplemental material
Research design and methods
Animals
Ten-week-old male db/db mice (Jackson Laboratories, Bar Harbor, Maine, USA) were purchased and housed for a week in the Brigham and Women’s Hospital vivarium to become acclimatized prior to surgery performed at the age of 11 weeks. All animal experiments were carried out in accordance and approved by the Institutional Animal Care and Use Committee at Brigham and Women’s Hospital (Protocol number 2016N000249).
Surgical procedure and postsurgical monitoring
A total of 47 11-week-old db/db male mice were included in this study (weight: 45.8±2 g). The grouping of the mice is shown in figure 1C.
Thirty-two mice received an intraperitoneal injection of ATZ (Aldrich Chemistry, St. Louis, Missouri, USA) at 0.5 g/kg body weight (22.9±1 mg). The mice dorsa were then prepared for surgery by undergoing hair removal with Nair. Twenty minutes postinjection a full thickness 1.0×1.0 cm wound including the panniculus carnosus was excised on the dorsum of the mice. MSA (Sigma Lifesciences, St. Louis, Missouri, USA), at a dose of 300 mg/kg body weight (13.7±0.6 mg), was topically applied to the wound, left for 5 min and then washed off with 1.0 cc of saline. The mice were then randomly separated into two groups: Chronic Diabetic and Treated Chronic Diabetic.
The Chronic Diabetic group received only occlusive dressing (Tegaderm HP Transparent Dressing; 3 M Health Care, St. Paul, Minnesota, USA).
The wounds in the Treated Chronic Diabetic group were covered with a 1.0×1.0 cm of Integra Dermal Regeneration Template (online supplementary figure 1) that was sutured in place using a 6–0 Prolene suture (Ethicon, Somerville, New Jersey, USA), and were subsequently covered with an occlusive dressing (figure 1C).
The 15 mice that received no injection served as the Diabetic Control group. They underwent a similar excision and the wounds were covered with an occlusive dressing.
In order to prevent the animals from biting and removing the occlusive dressing, the dressing was sutured in place, at four corners on the mice dorsa, using a 4–0 Prolene suture (Ethicon, Somerville, New Jersey, USA). The occlusive dressing covered the wounds throughout the duration of the experiment, which varied from 21 to 28 days, and was only removed for inspection and photographic purposes. Following injury, the animals were monitored for any signs of distress, including piloerection and increased respiratory rates. If signs of severe systemic illness, such as lethargy or weight loss greater than 20%, the animal would be euthanized. To ameliorate pain, the mice received analgesics (Buprenorphine, 0.05 mg/kg, subcutaneously) immediately after surgery, and then every 8 hours, for 48 hours.
Animals were sacrificed using carbon dioxide asphyxiation and the entire wound as well as 5 mm surrounding the wound, was collected at various time points for detailed histological and immunohistochemical evaluation (online supplementary table 1).
Assessment of glycemic control
Tail venous blood samples were obtained by a 1 mm incision on the tail tip on the day of surgery and on postoperative day 5, 10 and 21 or at a specific time. Blood glucose was then measured using the Antsense II Blood Glucose Analyzer (Bayer-Sankyo, Tokyo, Japan).33 Whole blood was collected on the days of sacrifice (online supplementary table 1) for hemoglobin A1c (HbA1c) assessment. Briefly, approximately 10 µL of blood was collected and 5 µL were added to a DCA 2000 analyzer (Bayer, Elkhart, Indiana, USA) which automatically measured Hb A1c as previously described.34 Unpublished historical glucose and HbA1c data of a wildtype, non-diabetic Control group were used for comparison.
Wound area measurement
The wound, including a ruler, was digitally photographed on days 5, 10, 14 and 28 using a Nikon D3100 SLR camera (online supplementary table 1). Wound area was measured by selecting the border using photographs imported into ImageJ software (V.1.52a; Media Cybernetics, Bethesda, Maryland, USA), under double-blinded conditions. Wound contraction was calculated using the following formula: ((wound area on day n)/(wound area on day 0)) ×100, where n was day 5, 10, 14 or 28. Wound area measurements on day 10 were based on 10 animals from each of the three groups as well as unpublished historical data of a Control (non-diabetic) group.
Microscopy
The harvested tissue was fixed in 10% neutral buffered formalin and stored in 70% ethanol to be embedded in paraffin. Five-micrometer-thick cross-sections were cut through the wound center to ensure inclusion of the wound bed and border and were stained with various stains and antibodies in order to assess different parameters. Quantifications of the parameters were done by two individual assessors under blinded conditions.
Standard staining
Slides were stained with H&E and Masson trichrome (MT) according to standard protocol.
The inflammatory tissue thickness on day 10 was determined by taking three high power field (HPF) photos of the wound bed of each H&E stained cross-section at 20× (n=10 per group). Photos were taken using an Olympus BX53 light microscope (Olympus UCMAD3, T7, Tokyo, Japan). The inflammatory tissue was marked out on each HPF by drawing two borders: Border A placed above the subcutaneous fat and Border B placed on the surface of the wound. In cases of scab formation Border B was drawn underneath the layer of scab. The distance between the two borders was measured in ImageJ.
HPF photos of the wound bed of each MT stained cross-section were taken at 20×. The level of collagen deposition was quantified for day 10, based on an n of 10 per group, using ImageJ by performing image thresholding as per previously defined parameters.26
Immunohistochemistry
Sections were deparaffinized, rehydrated and probed with antibodies for Ki-67 (1:200, Abcam, Cambridge, UK) and CD45 (1:50, R&D Systems, Minneapolis, Minnesota, USA) for 16 hours at 4°C. Alexa 488 goat anti-rabbit IgG (1:200, Invitrogen, Carlsbad, California, USA) and Goat IgG VisUCyte HRP Polymer (R&D Systems, Minneapolis, Minnesota, USA) were used as secondary antibodies for the Ki-67 and CD45 slides, respectively. Finally, the samples were counterstained with hematoxylin and the images acquired.
To quantify cellular proliferation, three HPF photos of the wound bed (n=10 per group) of each Ki-67 stained cross-section were taken at 20×. Ki-67-positive cells were counted and expressed as a ratio of proliferating nuclei to total nuclei on day 10.
To quantify leukocyte infiltration, three HPF photos of the wound bed of each CD45 stained cross-section were taken at 20× per mouse on day 10 (n=10 per group). The images for each section were analyzed using the color deconvolution function on ImageJ (V.1.52a) and the percentage of CD45-positive area per section was calculated. The scaffold layer in the Treated chronic diabetic group was excluded from the analysis.
Immunofluorescence staining
A double immunofluorescence procedure was carried out using anti-CD31 (1:400; Abcam, Cambridge, UK) and anti-α-smooth muscle actin antibody (SMA) (1:400; Abcam, Cambridge, UK) antibodies. The sections were blocked with BSA (5%) for 2 hours and incubated with primary antibody at 4°C overnight. After thorough washing, the sections were incubated with secondary goat anti-rabbit secondary antibodies (CD31, AS1111; α-SMA, AS1110; 1:400; Aspen Biotechnology, Hubei, China) for 1 hour in the dark. Last, the nuclei were stained with 4',6-diamidino-2 phenylindole (Aspen Biotechnology, Hubei, China). Images were captured using the immunofluorescence function of Olympus model BX53 light microscope (Olympus UCMAD3, T7, Tokyo, Japan), and merged using ImageJ (V.1.52a).
Blood vessel number was assessed using the microvessel density (MVD) counting technique, whereby the average number of microvessels per HPF is estimated by counting CD31 stained cells.35
Maturity of new blood vessels can be assessed using the microvascular pericyte coverage index (MPI).36 37 Specifically, we analyzed five HPFs to calculate the percentage of CD31-positive microvessels that stained for both CD31 (endothelial cells) and α-SMA (pericytes). The MPI was expressed as the α-SMA+CD31:CD31 ratio.
Statistical analysis
One-way analysis of variance was performed to detect statistically significant differences between the groups. Data are expressed as mean±SD. Statistical significance was set at a p<0.05. In the case of multiple comparisons, p values were adjusted via Bonferroni-Correction. All statistical analyses and visualization of the results were performed using GraphPad Prism V.8.00 for MacOS (GraphPad Software, La Jolla, California, USA).
Data and resource sharing and availability
The datasets generated and analyzed during the current study are available from the corresponding author on reasonable request. Details on the resources used in this study, including the rodent model, drugs, antibodies, software and hardware, are provided throughout the manuscript.
Results
Assessment of glycemic control
Higher plasma glucose was noted in the three diabetic groups, Diabetic Control, Chronic Diabetic, and Treated Chronic Diabetic, than the non-diabetic control on all days (online supplementary figure 2A). Treatment with antioxidant inhibitor enzymes seemed to increase the fasting plasma glucose with the two Chronic groups, Chronic Diabetic (501%±76%), and Treated Chronic Diabetic (521%±57%), having a higher glucose level than the Diabetic control (427%±49%; p=0.007), on day 10 postsurgery. In agreement with these observations, a significant increase in HbA1c was observed in the Diabetic Control (8.9%±0.6%), Chronic Diabetic (11.5%±1.0%), and Treated Chronic Diabetic (11.6%±0.8%) versus the non-diabetic Controls (4.7%±0.3%, p<0.0001; online supplementary figure 2B) on day 10 postsurgery.
Wound observation and area
On gross observation of the wounds, the Diabetic control group appeared to be contracting at a faster rate than the Chronic Diabetic group and the Treated Chronic Diabetic group wounds (figure 2A). The wound margins in the Diabetic control group were flat and unremarkable and the wounds healed by day 21. The Chronic Diabetic and Treated Chronic Diabetic groups showed signs of partial necrosis at the wound border, with pale and swollen margins, as well as evidence of exudate and biofilm formation which increased over time, invariably leading to graft detachment of the scaffold in the Treated Chronic Diabetic.

Mouse wounds. (A) Wound morphology. The Control and Diabetic control groups were contracting at a faster rate and healed by day 21. The Chronic diabetic group showed signs of necrosis on the wound border as well as signs of exudate and biofilm formation. The scaffold did not engraft well in any of the Treated chronic diabetic wounds. (B) Wound contraction. The wound areas were traced and analyzed using Image J. Both the Chronic diabetic and the Treated chronic diabetic wounds showed delayed healing when compared with the Control and Diabetic control mice with the difference between Diabetic control and Treated chronic diabetic being statistically significant (p<0.001). The wounds in both the Chronic diabetic and the Treated chronic diabetic groups became chronic and the Chronic diabetic did not heal for as long as 28 days. Scale bar is 1 cm. *p<0.05, **p<0.01, ***p<0.001.
Wound contraction was similar between the three diabetic groups on day 5. By day 10, the percentage of wound contraction in the Diabetic control group (94%±9%) was higher, but not significantly so, than the Chronic Diabetic group (99%±23%; p>0.99). The Diabetic control and the Treated Chronic Diabetic wound groups (113%±12%) significantly differed in contraction rate (p=0.007; figure 2B). There was no significant difference between the Diabetic control and the Treated Chronic Diabetic groups (p=0.07). The rate of wound contraction of the non-diabetic Control group was greater across all days, and significantly differed from all three diabetic groups on day 10 (22±10%; p<0.0001).
Microscopy
Qualitatively, on H&E staining, the wounds appeared to have higher levels of inflammatory exudate and cellular infiltration in the two groups treated with antioxidant enzyme inhibitors (figure 3A). On day 10, the mice treated with the scaffold showed poor engraftment of the scaffold (figure 3B). In addition, the wounds in the Diabetic control group showed complete closure and re-epithelization by day 21, as well as a decrease in cellularity and vascularization, whereas the groups treated with antioxidant enzyme inhibitors did not heal until day 28, with the group that was not treated with a scaffold showing the most delayed healing on day 28.

Wound bed histology. (A) H&E, day 10. Representative HE-stained sections of the wound bed treated with ATZ, MSA, and occlusive dressing (Chronic diabetic), wounds treated with ATZ, MSA, a collagen-glycosaminoglycan implant plus occlusive dressing (Treated chronic diabetic), and wounds treated with occlusive dressing (Diabetic control) at four different time points, day 5, 10, 14, and 21 or 28. (B) MT, day 10. MT-stained sections of the wound bed at the four different time points. Scale bar=µ100 m. ATZ, 3-amino-1,2,4-triazole; MSA, mercaptosuccinic acid; MT, Masson’s trichrome.
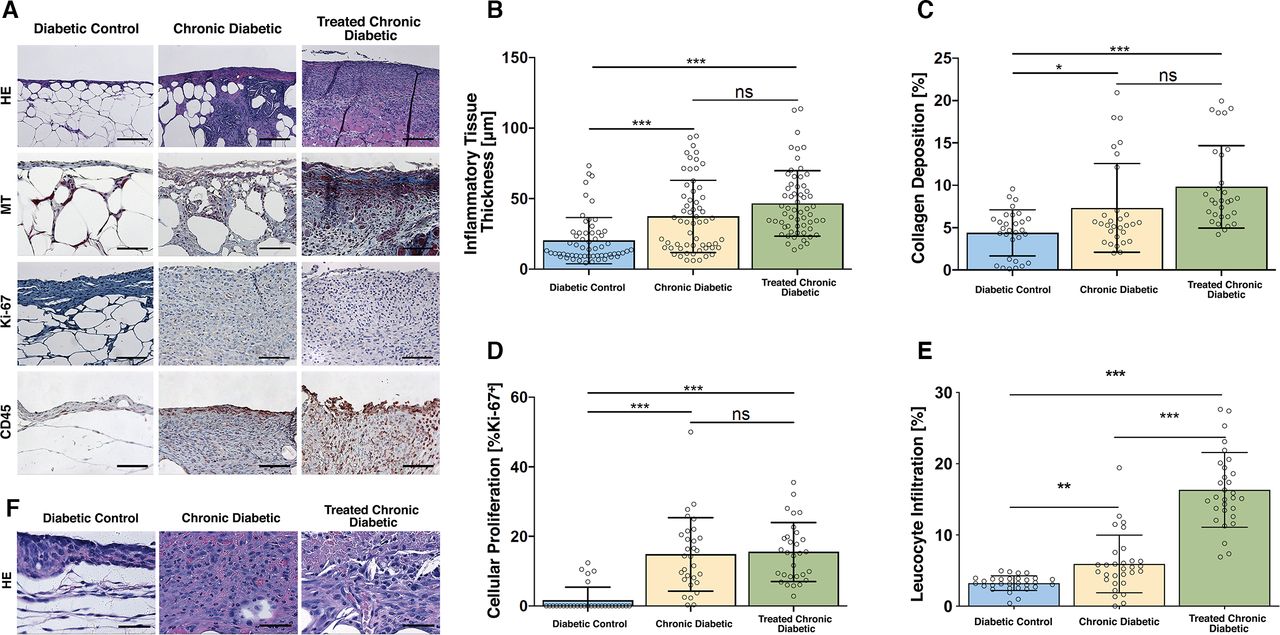
The thickness of the inflammatory tissue in the Diabetic control mice was significantly lower than the antioxidant enzyme inhibitor-treated mice, irrespective of whether they received a scaffold. Specifically, the average thickness in the Diabetic control group was 22.2±17.4 µm, which significantly differed from the thickness in the Chronic diabetic group (37.4±25.4 µm, p<0.0001) and the thickness in the Treated Chronic Diabetic group (46.6±21.4 µm, p<0.0001). The thickness of inflammatory tissue in the Chronic Diabetic group did not significantly differ from the Treated Chronic Diabetic group (p=0.1; Figure 4A,B). On high-power magnification, the inflammatory tissue was seen to comprise mainly of the inflammatory cells macrophages and neutrophils (figure 4F).

Histological analysis. (A) Representative high power field sections of the wound bed, Day 10. H&E, MT, anti-Ki-67, and anti-CD45-stained wounds treated with ATZ, MSA, and occlusive dressing (Chronic diabetic), wounds treated with ATZ, MSA, a collagen-glycosaminoglycan implant plus occlusive dressing (Treated chronic diabetic), and wounds covered with occlusive dressing (Diabetic control) on day 10. The scaffold was excluded from the histology and analysis. Scale bar=µ100 m. (B) Inflammatory tissue thickness, day 10. A significant difference in inflammatory tissue thickness was shown between the Diabetic control group and both ATZ+MSA treated groups. The ATZ+MSA treated groups did not differ between each other. (C) Collagen deposition, day 10. A significant difference in collagen deposition was shown between the Diabetic control group and both ATZ+MSA treated groups. The ATZ+MSA treated groups did not differ between each other. (D) Cellular proliferation, day 10. A significant difference in cellular proliferation was shown between the Diabetic control group and both ATZ+MSA treated groups. The ATZ+MSA treated groups did not differ between each other. (E) Leukocyte infiltration, day 10. A significant difference in leukocyte infiltration was shown between the Diabetic control group and both ATZ+MSA treated groups. The ATZ+MSA treated groups significantly differed. (F) H&E high-power examination of wound bed, day 10. Neutrophils and macrophages are the main cellular infiltrate components. The scaffold was excluded from the histological analysis. Scale bar=µ50 m. *p<0.05, **p<0.01, ***p<0.001. ATZ, 3-amino-1,2,4-triazole; MSA, mercaptosuccinic acid; MT, Masson’s trichrome.
In terms of collagen deposition, the Diabetic control group appeared to have the least amount of collagen (4.4%±2.7%) and the Treated Chronic Diabetic group the greatest (9.8%±4.9%). The two groups significantly differed from each other (p<0.001; figure 4A,C). The Diabetic control group showed significantly less collagen than the Chronic diabetic group (7.33%±5.23%; p=0.03), while the Chronic diabetic and the Treated Chronic Diabetic groups did not significantly differ (p=0.07).
Immunohistochemistry
The percentage of Ki-67 positive nuclei in both groups of antioxidant enzyme inhibitor-treated mice was significantly higher than the percentage of the Diabetic control mice (figure 4A,D). Specifically, the percentage in the Chronic diabetic group (14.8%±10.6%) and the Treated Chronic Diabetic group (15.5%±8.5%) significantly differed from the percentage in the Diabetic control group (1.6%±3.8%; p<0.001 in both cases). The percentage of Ki-67 positive nuclei in the Chronic diabetic group did not significantly differ from the Treated Chronic Diabetic group (p>0.99).
CD45 staining showed a significant difference between the leukocyte infiltration of the Chronic diabetic group (5.94%±4.06%) and the Diabetic control group (3.2%±1%; p=0.002) as well as the Treated Chronic Diabetic groups (16.3%±5.3%) and the Diabetic control group (3.2%±1%; p<0.0001). The level of leukocyte infiltration significantly differed between the Chronic diabetic group and the Treated Chronic Diabetic group (p<0.0001; figure 4A,E).
Immunofluorescence
CD31 immunofluorescent staining of the wound bed showed a significant difference between all three groups on day 10, with the Chronic diabetic group (49±35.5 vessels/HPF; p<0.0001) and Treated Chronic Diabetic group (119.4±48.2 vessels/HPF) having a higher density of microvessels than the Diabetic control group (10.7±7.1 vessels/HPF; p<0.001 in both cases). The density of microvessels significantly differed between the Chronic diabetic group and the Treated Chronic Diabetic group (p<0.0001; figure 5A,B).

Microvessel density and maturity. (A) Representative high power field sections of the wound bed, day 10. CD31, α-SMA, DAPI, and merged immunofluorescent stained sections of the wound bed of wounds treated with MSA, ATZ, and occlusive dressing (Chronic diabetic), wounds treated with MSA, ATZ, a collagen-glycosaminoglycan implant plus occlusive dressing (Treated chronic diabetic), and wounds covered with occlusive dressing (Diabetic control) on day 10. Square insert highlights the CD31-α-SMA architecture in each group. Scale bar=µ100 m. (B) Microvessel density, day 10. Based on a sample of 10 mice per group, a significant difference in microvessel density was shown between the Diabetic control group and both ATZ+MSA treated groups. (C) Microvessel maturity, day 10. A significant difference in microvessel maturity was shown between the Diabetic control group and both ATZ+MSA treated groups. (D) Representative high power field sections, day 5 and day 28. CD31+α-SMA-stained wound bed sections of wounds treated with ATZ, MSA, and occlusive dressing (Chronic diabetic), wounds treated with ATZ, MSA, a collagen-glycosaminoglycan implant plus occlusive dressing (Treated chronic diabetic), and wounds covered with occlusive dressing (Diabetic control) on day 5 and day 28. *p<0.05, **p<0.01, ***p<0.001. ATZ, 3-amino-1,2,4-triazole; DAPI, 4',6-diamidino-2 phenylindole; HPF, high power field; MSA, mercaptosuccinic acid; α-SMA, α-smooth muscle actin antibody.
Costaining of CD31 and α-SMA of the wound bed highlighted a difference in the pericyte coverage, and hence microvascular maturity, between the three groups on day 10. Specifically, the Treated Chronic Diabetic (37.7%±13.3%) and Chronic diabetic group (13.2%±10.9%) had lower coverage index and microvascular maturity than the Diabetic control group (78.8%±14.2%, p<0.0001 in both cases; figure 5A,C). Costaining of CD31 and α-SMA of day 5 wound bed sections showed that on day 5 all groups were characterized by immaturity of blood vessels. On day 28, the Treated Chronic Diabetic blood vessels showed maturation whereas the Chronic diabetic blood vessels had not yet matured (figure 5D).
Discussion
This study set out to modify and optimize a previously described chronic wound model24 with the goal of decreasing animal loss and, hence, costs, while increasing reliability and reproducibility. The enzyme inhibitor doses were modified allowing for the experiment to be performed on younger, and lighter, mice with no animal loss while still displaying features of chronic healing. Specifically, we could not replicate the published drug regimen in the younger mice without experiencing multiple animal deaths; hence, we halved the intraperitoneal dose of ATZ (catalase inhibitor) to 0.5 g/kg and doubled that of the topically applied (GPx inhibitor) to 300 mg/kg. This modification was based on the fact that the initial intraperitoneal dose of ATZ was closer to the LD 50 of the drug (1.1 g/kg) than the initial topical dose of MSA was to its LD50 (800 mg/kg). The similarities and differences between the two models and studies are summarized in online supplementary table 2.
In addition, as the protocol we modified had cautioned against using mice that weigh less than 50 g, we elected to perform our experiments solely on male mice as they tend to weigh more than female mice of the same age. Kim et al clarify that although various diabetes models display sex differences, no such differences were noted in their induction of chronic wounds using antioxidant enzyme inhibitors (AEIs).32
In this research, the two groups treated with the antioxidant enzyme inhibitors appear to be arrested in the inflammatory stage on day 10 and had not healed by day 28. Wound healing occurs via a series of four overlapping stages: hemostasis, inflammation, proliferation, and remodeling. Healing can become arrested during any of these stages resulting in the formation of a chronic wound. Prior research has established that if a murine wound does not heal by 26 days, it is considered chronic.38 The control group had progressed to the maturation phase and ultimately remodeling by day 21.
The two groups treated with antioxidant enzyme inhibitors showed significantly higher levels of leukocyte infiltration than the Diabetic control mice. Abundant leukocyte infiltration due to a heightened inflammatory state has been linked to tissue damage and further increase in ROS leading to a prolongation of wound healing. Following injury, during the process of inflammation, a hypoxic environment induces leukocyte, and specifically neutrophil recruitment to the site.39 40 The neutrophil influx is followed by macrophage recruitment, with high levels of cellular infiltration.41 Leukocytes release proinflammatory cytokines, including TNFα, that are chemotactic for further leukocyte infiltration and stimulation of inflammation.42 Excessive leukocyte infiltration has been defined as a marker of chronic inflammation and chronic wounds.43
Inflammation is characterized, in addition to leukocyte influx, by extensive angiogenesis.41 These new blood vessels are highly disorganized, poorly perfused, and have been noted to peak in number during the proliferative stage.44–46 In this experiment, all three groups displayed disorganized vasculature on day 5 postsurgery. Following this peak is the maturation stage during which a switch from proangiogenic to antiangiogenic factors results in apoptosis of immature vessels and re-establishment of an angiogenic environment more similar to the preinjury state.47–49 On day 10, the antioxidant enzyme inhibitor-treated groups displayed extensive angiogenesis, with high numbers of immature vessels, as judged by a low pericyte coverage index. In contrast, the Diabetic control group showed fewer, although highly mature, vessels suggesting that this group had progressed to the maturation stage, while the inhibitor-treated groups were stalled in inflammation. A low number of the pericytes surrounding a blood vessel has been linked to vascularization that is prone to leakage and damage.50 Pericytes are widely regarded as vascular smooth muscle cells that surround mature microvasculature, including arterioles, venules, and capillaries, to provide tone, support, and integrity to the vessels.51 The abnormal pericyte coverage shown in the antioxidant enzyme inhibitor-treated groups is suggestive of immature and poorly perfused microvasculature, similarly to how abnormal pericyte coverage in tumor blood vessels accounts can result in a tortuous and leaky architecture.52 53
A difference in collagen deposition between the groups was also noted, with the Diabetic control group showing a significantly lower amount of collagen. Prior studies have shown that in the early stages of wound healing, fibroblasts primarily produce proteoglycans. During the later stages of inflammation, on the other hand, there is a shift to production of type III collagen, with persistence of proliferation being characterized by overproduction of collagen and fibrosis.54
Cellular hyperproliferation was seen in both groups treated with antioxidant enzyme inhibitors, a phenomenon previously described in chronic wounds.55–57 Specifically, application of wound fluid from chronic wounds to in vitro wounds has been shown to induce massive proliferation of keratinocytes.56 A “chronic wound associated phenotype” in chronic ulcers, characterized by cellular overproliferation and overexpression of the marker Ki-67 has also been described.55 Clinically, chronic wounds display keratinocyte hyperproliferation and overgrowth of the wound margin, resulting in a raised borders and a pocket-like wound, which is more difficult to clean and more likely to harbor infection.56
The model was also used to test the application of a commonly used scaffold. Despite the poor engraftment, it should be noted that on day 10, the group treated with the scaffold showed a higher level of microvasculature maturation than the Chronic diabetic group. By day 28, the microvasculature of the Chronic diabetic group had still not matured, suggesting that despite the scaffold not engrafting, it was able to promote the maturation of the microvasculature.
Future research
Our glucose and HbA1C results highlight that the antioxidant enzyme inhibitor-treated groups had poor glycemic control. As duration of diabetes has an impact on wound healing outcome, aged mice would have more extensive diabetes and poorer healing. In future experiments, we would like to apply our adjusted antioxidant enzyme inhibitor regimen to older mice in order to establish whether this induces a more chronic wound. Further, the relevance of biofilm in chronic diabetic wound healing warrants a detailed analysis of its own, and in future experiments, we intend to replicate our chronic wound healing model in biofilm-prone mice and carry out biofilm specific analysis through bacterial culture as well as specialized staining.
Conclusion
Based on our observations, we can conclude that MSA in combination with ATZ increases the healing time, inflammatory tissue formation, collagen deposition, and MVD of wounds. This study was the first to successfully induce a chronic diabetic wound in 11-week-old mice, an age that seems to better serve as a less expensive experimental model of impaired diabetic healing. Scaffold engraftment was poor, replicating in a murine model what is seen in patients if a wound is not debrided prior to scaffold application. This model will be instrumental for the development and optimization of therapeutic products.
References
Footnotes
Contributors ACP and DPO conceived and designed the experiment. ACP, BM, and YA performed the animal experiments. ACP and VH analyzed the animal data. YE, MK, PS, and SF performed the staining and histology analysis. VH performed the statistical analysis. ACP wrote the paper. VH, MK, YE, and DPO edited the manuscript. The manuscript was reviewed by all authors. ACP is the guarantor of this work and, as such, had full access to all the data in the study and takes responsibility for the integrity of the data and the accuracy of the data analysis.
Funding This project was supported through grants to Brigham and Women’s Hospital from Integra LifeSciences, Inc., and The Stepping Strong Foundation.
Competing interests DPO receives grant support through a sponsored research agreement through Integra Lifesciences. DPO is a consultant for Integra Lifesciences.
Patient consent for publication Not required.
Provenance and peer review Not commissioned; internally peer reviewed.
Data availability statement Data are available on reasonable written request.