Article Text

Abstract
Introduction The major challenge for diabetes prevention is early identification of individuals at risk to allow for implementation of measures to delay the onset of future disease. Measures such as fasting plasma glucose (FPG), 2-hour plasma glucose (2hPG), and glycosylated hemoglobin (HbA1c) are equally appropriate for identifying pre-diabetes and diabetes, but do not all identify the disease in the same individual. We tested the utility of a diagnostic method combining FPG, 2hPG and HbA1c for early evaluation and easy identification of pre-diabetes.
Research design and methods 531 subjects underwent skin autofluorescence (SAF) and glycemia analyses. We created two classification groups based on the American Diabetes Association diagnosis guidelines: (1) based on 2hPG and (2) based on a new combination of three glycemia parameters (the three-criteria strategy (3-c)). Logistic regression modeling was used to estimate the associations.
Results SAF showed high associations for both 3-c definition and 2hPG definition alone. These associations appeared stronger in 3-c than those in 2hPG. The non-invasive SAF measurement outperformed 2hPG in the detection of dysglycemia or pre-diabetes. Stepwise selections identified 1-hour postload glucose (1hPG) as variable identifying pre-diabetes using the 2hPG criterion, and the model based on 1hPG plus SAF appeared to be the best association using the 3-c strategy.
Conclusions 1hPG coupled with SAF showed a strong association in the evaluation of pre-diabetes using the 3-c method.
- epidemiology
- prediabetic phenotype
- dysglycemia
This is an open access article distributed in accordance with the Creative Commons Attribution Non Commercial (CC BY-NC 4.0) license, which permits others to distribute, remix, adapt, build upon this work non-commercially, and license their derivative works on different terms, provided the original work is properly cited, appropriate credit is given, any changes made indicated, and the use is non-commercial. See: http://creativecommons.org/licenses/by-nc/4.0/.
Statistics from Altmetric.com
Significance of this study
What is already known about this subject?
Previous studies identified 1-hour postload glucose (1hPG) as a valuable risk factor for the development of pre-diabetes and type 2 diabetes mellitus, as well as cardiovascular disease.
What are the new findings?
The prevalence of pre-diabetes is expected to increase worldwide.
This cross-sectional study identifies the associations of 1hPG plus skin autofluorescence with dysglycemia and pre-diabetes.
The novel method could be used to screen pre-diabetes in the general population.
How might these results change the focus of research or clinical practice?
These results could represent a useful strategy to implement diabetes prevention.
Introduction
Diabetes mellitus is considered a multifactorial, chronic metabolic disorder characterized by hyperglycemia owing to insulin resistance (IR) and insulin deficiency.1 Recent epidemiological data showed that diabetes affects people worldwide, reaching a prevalence of 412 million in 2015, and adding a plethora of people having risk factors that include impaired fasting glucose (IFG), impaired glucose tolerance (IGT), gestational diabetes and euglycemic IR this figure is expected to increase.2 From this view, it has been estimated that a substantial number of people, 50% of people in the general population 20–79 years of age globally, are unaware of their disease (http://www.diabetesatlas.org; International Diabetes Federation, IDF Diabetes Atlas Eighth Edition), exposing them to the risk of increased morbidity and mortality attributable to the onset of microvascular and macrovascular complications. Dysglycemia—also called glucose abnormalities (GAs)—which includes isolated IFG and/or isolated IGT, represents a risk factor for developing diabetes and its related cardiovascular complications, which appear silently and several years before the clinical manifestation of the disease.3 Thus, promoting prevention strategies through early identification of subjects who are mostly free of clinical signs of diabetes should be considered a great public health priority to reduce the risk of diabetes and its associated burden. Recent clinical trials widely attested that lifestyle intervention3 4 or pharmacological therapy5 6 in subjects with IGT can prevent diabetes, providing a rationale for screening. Pre-diabetes, defined as IGT based on a 2-hour plasma glucose (2hPG) value of 140–199 mg/dL after a 75 g oral glucose tolerance test (OGTT), or IFG based on a fasting value of 100–125 mg/dL or glycosylated hemoglobin (HbA1c) between 5.7% and 6.4% (39–46 mmol/mol),7 8 is a strong predictor of onset of cardiovascular and renal diseases.9 The consensus on the diagnostic definition of pre-diabetes is still debated10; thus, early identification of individuals at high risk of developing diabetes remains an open challenge. In recent years, 1-hour postload glucose (1hPG) has been recognized as a potent predictor of pre-diabetes,11–13 more than HbA1c, 2hPG and fasting plasma glucose (FPG).14–17 Moreover, few data are available on the possible role of skin autofluorescence (SAF) in detecting dysglycemia.18 SAF, a non-invasive measure of advanced glycated end-products (AGEs) associated with microvascular and macrovascular complications,19–22 has been suggested for opportunistic screening and early detection of pre-diabetes.23
In this work we sought to explore among the cohort of the Diabetes Prediction and Screening Observational (DIAPASON) study, at baseline, the associations between 1hPG and SAF and the prevalence of pre-diabetes using a strict method that combined 2hPG, FPG and HbA1c glycemic parameters for diagnosis.
Research design and methods
Participants
The DIAPASON study is a clinical study about diabetes prevention, the primary endpoint of which was to estimate GA, diabetes and pre-diabetes frequencies by a procedure primarily based on evaluation of the diagnostic accuracy of SAF and HbA1c. A total of 1506 participants were selected on the basis of eligibility criteria by general practitioners in Milan; all subjects who filled in the Finnish Diabetes Risk Score (FINDRISC) questionnaire24 were invited for signed informed consent prior to laboratory screening. The eligibility criteria were as follows: age 40–75 years and FINDRISC ≥9 based on the results of the IGLOO study (to identify individuals with GAs).25 The exclusion criteria were pre-existing diagnosis of diabetes and of any illness and/or medication, such as antidiabetes drugs, with a potential effect on the endpoints of the study. Additional exclusion criteria were adopted for SAF, such as skin changes, tattoos, excessive suntan, and use of bronzes or other sunless tanning products.
Procedure
The laboratory screening was attended by 531 participants at baseline, and body mass index (BMI), stature, blood pressure, OGTT at 60 and 120 min (1hPG and 2hPG, respectively), FPG, HbA1c, basal insulin, homeostasis model assessment for insulin resistance (HOMA-IR), lipid profile (total cholesterol, high-density lipoprotein, low-density lipoprotein, triacylglycerol), and microalbuminuria (MA) were assessed (online supplementary figure 1). SAF was measured as autofluorescence in human skin using an AGE Reader (DiagnOptics Technologies) to estimate the accumulation of AGEs in the skin. SAF was determined by the ratio between the light intensity reflected in the 420–600 nm wavelength range and the light intensity in the 300–420 wavelength range using the AGE Reader software. The cardiovascular risk score (CV risk) was calculated using the Progetto Cuore algorithm (www.cuore.iss.it). Participants were recruited between January 2013 and February 2017. All subjects gave written informed consent.
Supplemental material
Strategy for the definition of diagnostic groups
We grouped subjects on the basis of two classification criteria that met the American Diabetes Association (ADA) guidelines: (1) the criteria based only on 2hPG definition; and (2) the criteria that we named the three-criteria strategy (3-c), which is a combined method based on FPG, 2hPG, and HbA1c. Specifically, FPG <100 mg/dL plus 2hPG <140 mg/dL plus HbA1c <5.7% identified subjects with normoglycemia (NGT); 100 ≤ FPG ≤ 125 mg/dL plus 140 ≤ 2hPG ≤199 mg/dL plus 5.7 ≤ HbA1c ≤6.4% identified pre-diabetes (PRE); FPG >125 mg/dL plus 2hPG >199 mg/dL plus HbA1c >6.4% identified type 2 diabetes (T2D); and subjects not satisfying any of the three conditions were considered to be in the group of miscellaneous glycemic abnormalities (mGAs).
Plasma separation and laboratory testing
Approximately 5 mL of venous blood was extracted in an EDTA anticoagulant tube at room temperature. The venous blood sample was centrifuged at 3000× g. FPG was detected by the Slein method using a Siemens analyzer (Germany). We used OGTT to assess the 2hPG and 1hPG values. Triacylglycerol and total cholesterol were measured using an automated enzymatic colorimetric test (Siemens). HbA1c was detected by a high-performance liquid chromatography automated system (Tosoh, Japan). Insulinemia levels were detected by a Centaur XP analyzer (Siemens). HOMA-IR was calculated by the formula ‘FPG (mg/dL) × fasting insulin (uU/mL)/405’. MA was detected in urine samples previously centrifuged for 10 min at 3000× g to avoid cellular debris using an IMMAGE instrument (Beckman Coulter).
Statistical analysis
Continuous variables are presented as mean and SD, and their distributions were assessed for normality using the Kolmogorov-Smirnov test. All normally distributed variables were compared between groups using one-way analysis of variance and paired contrasts. Non-normally distributed variables were compared between groups using the Kruskal-Wallis test and pairwise two-sample Wilcoxon comparisons. Sex, as the only categorical variable, was compared between groups using the χ2 test or Fisher’s exact test, as appropriate. Cohen’s weighted kappa was used to test for agreement among FPG, 2hPG and HbA1c. The Spearman correlation matrix was calculated for all collected variables. For both classification criteria (diagnosis based on 2hPG or the 3-c), we calculated the 1hPG and SAF best cut-offs using Youden’s index and tested the sensitivity, specificity, positive and negative predicted values, positive and negative likelihood ratio, and the area under the receiver operating characteristic (ROC) curve (AUC). Stepwise forward regression models were also performed, and ROC curves were drawn for the selected models. Finally, to evaluate the predictive power of 1hPG and SAF in discriminating between diagnostic groups (3-c), we performed multivariable logistic models, and ORs adjusted for age, sex and BMI were calculated. ROC curves for logistic models were drawn, and AUCs with 95% CI were calculated. Statistical significance was defined as p<0.05. Statistical analyses were carried out with SAS V.9.4 software.
Results
Distribution of diagnostic groups based on different criteria
The prevalence of pre-diabetes based on FPG only did not differ notably from that based on 2hPG, whereas HbA1c % classified more cases of pre-diabetes (61%) than the other diagnostic criteria (table 1), suggesting that HbA1c is able to classify a larger proportion of subjects as diabetics and pre-diabetics than 2hPG or FPG, while FPG identified more people with normoglycemia. 2hPG identified a higher prevalence of newly diagnosed cases of T2D (6%) than FPG (1%), whereas HbA1c reached 11% prevalence, which was higher than others.
Prevalence of IFG, IGT and T2D newly diagnosed by ADA recommendations
To assess the consistency of the measuring process according to the same diagnostic result, we measured the agreements among FPG, 2hPG or HbA1c metrics using Cohen’s weighted kappa coefficient (k), as shown in table 2. The data showed slight/fair agreement (k<0.4), suggesting that the agreement between the criteria was no better than that which would be obtained by chance alone, in all cases.
Cohen’s weighted k agreement among FPG, 2hPG and HbA1c
We noticed that SAF values were highly significant when detecting pre-diabetes using the FPG definition only, but in HbA1c only SAF values were significantly high not only in pre-diabetes classification but also in new T2D (online supplementary tables S1‒S3). In online supplementary figure 1, SAF revealed a significant correlation with all glycemic parameters, reaching the highest statistical level with HbA1c values (p<0.0001), providing rationale for the use of SAF in detecting glycemic exposures. Also, the correlation matrix exhibited a correlation with SAF and all glycemic parameters, in particular HbA1c (p<0.001), triacylglycerol, HOMA-IR and MA (online supplementary figure 1), supporting the potential of SAF for monitoring the early development of diseases related to derangements in glucose homeostasis.
Combined three-criteria (3-c) strategy
To explore whether 3-c (FPG, 2hPG and HbA1c) identifies subjects with different pathogenic mechanisms, we divided the population into four groups (NGT, PRE, newly diagnosed and untreated T2D, and mGA) based on the ADA guidelines, as explained in the ‘Research design and methods’ section. Thus, we classified 126 subjects with NGT, 377 with mGA, 24 with PRE and 4 subjects with diabetes (who were excluded from major analyses due to the low representative number). Subjects fulfilling the three diagnostic criteria for pre-diabetes had a significantly higher HOMA index, worse insulin secretion, reduced high-density lipoprotein, increased BMI, increased 1hPG, increased SAF, and increased CV risk compared with NGT (table 3). Subjects classified as NGT with 3-c had the most favorable cardiometabolic parameters.
Distribution by combined criteria (3-c)
1hPG and SAF identify dysglycemia in 3-c
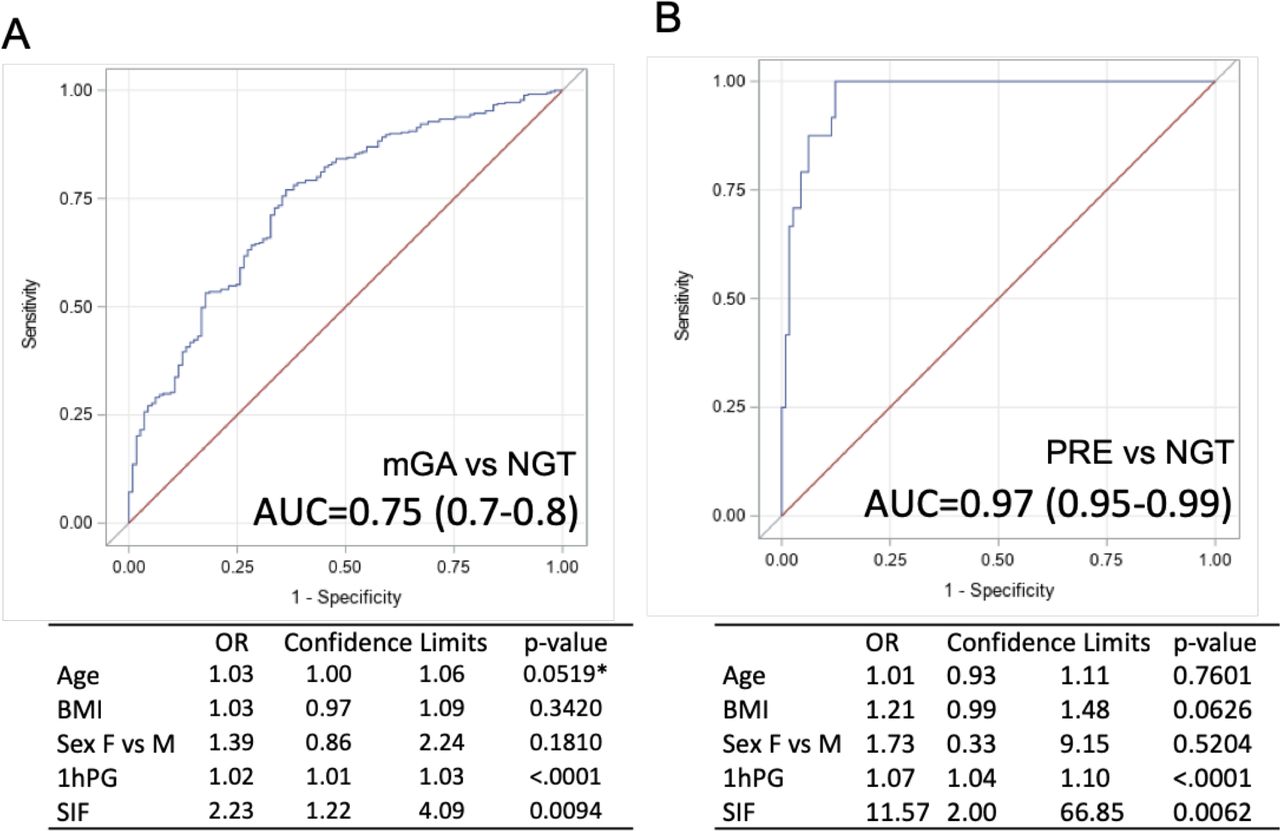
We performed logistic regression models to evaluate the association between 1hPG, SAF and diagnostic groups (3-c) adjusted for age, sex and BMI. ROC curves and ORs are shown in figure 1A,B. 1hPG and SAF were significantly associated with an increased prevalence of mGA and PRE, if compared with NGT (mGA: 1hPG OR 1.02, p<0.0001 and SAF OR 2.23, p<0.01; PRE: 1hPG OR 1.07, p<0.0001 and SAF OR 11.57, p<0.01). We also calculated the optimal cut-off value and determined the accuracy of 1hPG, identifying values ≥157 mg/dL as discriminative between mGA and NGT (AUC=0.71, p<0.0001); for SAF, the cut-off was ≥2.1 intrinsic fluorescence units for detecting mGA versus NGT (AUC=0.63, p=0.0002) (table 4).
Diagnostic accuracy and cut-off optimum truncation points for 1hPG and SAF using the 3-c definition in discriminating mGA versus normoglycemia

Multivariable logistic models for (A) miscellaneous glucose abnormalities versus normoglycemia and (B) impaired glucose tolerance (pre-diabetes) versus normoglycemia. *p-value borderline significant. AUC, area under the curve; BMI, body mass index; F, female; 1hPG, 1-hour postload glucose; M, male; mGA, miscellaneous glucose abnormalities; NGT, normoglycemia; PRE, pre-diabetes; SIF, skin intrinsic fluorescence.
1hPG as common predictor for both 3-c and 2hPG criteria
Using the 2hPG-only criteria, the stepwise forward regression model identified 1hPG as the best predictor (T2D vs IGT: OR 1.05 (1.03–1.07), p<0.0001, AUC=0.87; T2D vs NGT: OR 1.09 (1.06–1.13), p<0.0001, AUC=0.98). However, for IGT versus NGT, diastolic blood pressure (OR 1.06 (1.03–1.09), p=0.0002) and 1hPG (OR 1.04 (1.03–1.05), p<0.0001) were identified as the two most influential variables, with a global AUC of 0.86 (online supplementary figure 3A‒C). We also calculated the optimal cut-off values and determined the accuracy of 1hPG in identifying diagnostic groups based on 2hPG criterion only. We identified a cut-off of 1hPG ≥154 mg/dL for detecting pre-diabetes versus NGT (AUC=0.84, p<0.0001) and 1hPG ≥224 mg/dL for detecting T2D versus pre-diabetes (AUC=0.86, p<0.0001; online supplementary table S4). After adjusting for age, sex and BMI, the cut-off values did not differ from those of the unadjusted model (data not shown).
Discussion
In this work, we proposed a method (3-c) consisting of the concomitant use of the three canonical metrics useful for detecting hyperglycemia (FPG, 2hPG and HbA1c) on the identification of pre-diabetes in the DIAPASON study. Our data demonstrated that the 3-c method could outperform a single glycemic parameter used alone. This method takes place from our observations about glycemic definitions (based on only one or two parameters), outlining a considerably different prevalence of individuals at risk of developing pre-diabetes or T2D (tables 1 and 2).
For the first time, we reported that when we adopted the 3-c method, the differences in the pre-diabetic phenotype were more evident than when single definitions were used alone. Using this novel approach, we identified a phenotype of individuals with normoglycemia having a more realistic normal cardiometabolic trait, characterized by lower levels of IR and triacylglycerol, compared with those identified using the other glycemic definitions (online supplementary tables S1‒S3). Also, 1hPG and SAF measurements exhibited reduced levels in NGT as defined by 3-c compared with those in 2hPG only.
Additionally, we found a relevant prevalence of individuals in the intermediate status defined as mGA—between normoglycemic and pre-diabetic—having a different cardiometabolic trait than individuals with pre-diabetes and normoglycemia (table 3). Subjects with mGA would have been classified erroneously if they had been identified by 2hPG criterion, only leading to misclassification of some individuals, rather than by the strict classification performed with 3-c. We identified for the first time a cut-off threshold for SAF of ≥2.1 (mGA vs NGT) (table 4) and a cut-off threshold for 1hPG of ≥157 mg/dL for discriminating mGA from NGT, which do not differ from that observed using 2hPG definition only (1hPG ≥154 mg/dL for pre-diabetes vs normoglycemia; online supplementary table S4) and from the Botnia Study value of ≥155 mg/dL.11
Moreover, the multivariable logistic model applied to 3-c metric demonstrated that 1hPG coupled with SAF and adjusted for confounders such as age, sex and BMI showed a significant association for both pre-diabetes (AUC=0.97) and mGA (AUC=0.75) versus NGT.
Recently, SAF has been shown to be significantly associated with AGE plasmatic concentration in subjects with pre-diabetes,26 and it has been proposed as a non-invasive tool for estimating the risk of cardiovascular impairment in individuals with diabetes. A previous study on diabetes complications showed that SAF, measured as intrinsic fluorescence in human skin, can estimate the deposition of AGE27 and major adverse cardiovascular events, and might be used to predict cardiorenal outcomes in subjects with type 1 diabetes (T1D).28 29 Additionally, high levels of circulating AGEs predict a 4-year risk of incident T2D, cardiovascular events and mortality in the general population. Furthermore, elevated SAF values have been associated with diastolic dysfunction, increased ventricular stiffness, increased excretion of transforming growth factor (TGF)-beta for deposition in the extracellular matrix,30 and early-stage atherosclerosis in individuals with T1D.31
Given the recent findings32–34 regarding the higher cardiometabolic risk burden associated with 1hPG, and the recent literature about SAF, they might be used for preventing future clinical adverse outcomes.
Strengths and limitations
Some strengths and limitations should be considered in the present study. A strength is that we conducted standardized biochemical measurement evaluations of blood samples which were analyzed in a certified laboratory. Further, all participants completed the examinations, and the percentage of missing values was relatively small. However, some limitations exist. In this observational cohort study, further analyses will be required to evaluate the risk of development of pre-diabetes or diabetes and its associated cardiovascular complications. Nevertheless, some risk factors for high SAF values were not taken into account, such as rheumatic disease and depression.
Conclusion
The model of SAF and 1hPG represented by this study acts as a good predictor of people at risk. Our results provide evidence for planning monitoring and prevention programs based on SAF, simply by scanning AGE level on the skin, and 1hPG, which is more suitable in clinical settings than 2hPG. Using 1hPG and SAF might predict and identify a high number of people at risk and might be the first step toward identifying general populations at risk using more extensive screening programs. Specifically, the association values of 1hPG and SAF might be effective in screening individuals in the early stage of pre-diabetes.
Acknowledgments
The authors wish to thank Alessandra Panvini-Rosati for database assistance.
References
Footnotes
Contributors LLS contributed to conception and design of the study, analysis and interpretation of data, and wrote the manuscript. LLS and ET performed statistical analyses. FP and PC critically revised the manuscript. AC contributed to conception and provided critical revision of the paper for important intellectual content. All authors read and approved the manuscript submission. LLS takes responsibility for the content of the article.
Funding This work has been supported by EFSD/Sanofi 2017 (to LLS), Fondazione ‘Romeo ed Enrica Invernizzi’ (Milan, Italy), Italian Ministry of Health ‘Ricerca Corrente’ to IRCCS MultiMedica and ‘RF2016 – 02364513’ (to AC).
Competing interests None declared.
Patient consent for publication Not required.
Ethics approval The DIAPASON protocol was approved by the institutional review boards/independent ethics committee of the IRCCS MultiMedica (protocol number 24/2012(153)).
Provenance and peer review Not commissioned; externally peer reviewed.
Data availability statement All data relevant to the study are included in the article or uploaded as supplementary information. Our data are not in a repository. We have permission from the participants in terms of informed consent.