Article Text

Abstract
Introduction Diabetic retinopathy (DR) is the leading cause of blindness among the working population in the USA. Current therapies, including anti-vascular endothelial growth factor treatments, cannot completely reverse the visual defects induced by DR. MicroRNA-150 (miR-150) is a regulator that suppresses inflammation and pathological angiogenesis. In patients with diabetes, miR-150 is downregulated. As chronic inflammation is a major contributor to the pathogenesis of DR, whether diabetes-associated decrease of miR-150 is merely associated with the disease progression or decreased miR-150 causes retinal inflammation and pathological angiogenesis is still unknown.
Research design and methods We used high-fat diet (HFD)-induced type 2 diabetes (T2D) in wild type (WT) and miR-150 knockout (miR-150-/-) mice for this study and compared retinal function and microvasculature morphology.
Results We found that WT mice fed with an HFD for only 1 month had a significant decrease of miR-150 in the blood and retina, and retinal light sensitivity also decreased. The miR-150-/- mice on the HFD developed diabetes similar to that of the WT. At 7–8 months old, miR-150-/- mice under normal diet had increased degeneration of retinal capillaries compared with WT mice, indicating that miR-150 is important in maintaining the structural integrity of retinal microvasculature. Deletion of miR-150 worsened HFD-induced retinal dysfunction as early as 1 month after the diet regimen, and it exacerbated HFD-induced T2DR by further increasing retinal inflammation and microvascular degeneration.
Conclusion These data suggest that decreased miR-150 caused by obesity or diabetic insults is not merely correlated to the disease progression, but it contributes to the retinal dysfunction and inflammation, as well as the development of DR.
- blindness
- diabetes mellitus
- Type 2
- diabetic retinopathy
- obesity
This is an open access article distributed in accordance with the Creative Commons Attribution Non Commercial (CC BY-NC 4.0) license, which permits others to distribute, remix, adapt, build upon this work non-commercially, and license their derivative works on different terms, provided the original work is properly cited, appropriate credit is given, any changes made indicated, and the use is non-commercial. See: http://creativecommons.org/licenses/by-nc/4.0/.
Statistics from Altmetric.com
Significance of this study
What is already known about this subject?
Diabetic retinopathy (DR) is the leading cause of blindness worldwide, and currently, there is no treatment to completely reverse the vision impairment associated with DR.
Changes in microRNAs (miRs), including miR-150, have been associated with diabetes and DR, but it is not known whether diabetes-associated changes in miR-150 is merely correlated with the disease progression or it contributes to the pathogenesis of DR.
What are the new findings?
MiR-150 is critical in maintaining the structural integrity of retinal microvasculature and dampening inflammation.
MiR-150 is significantly decreased in the blood and retina in mice fed with an HFD even before the manifestation of the prediabetic state or hyperglycemia.
Deletion of miR-150 further exacerbates obesity-associated T2DR, including worsened retinal light responses, retinal inflammation, and the degeneration of retinal microvasculature.
How might these results change the focus of research or clinical practice?
Diabetes-associated decrease of miR-150 correlates to the disease progression, and it contributes to the pathogenesis of DR, which is based on the following observations: the levels of miR-150 in the blood and retina are decreased early on prior to the display of diabetes, and miR-150-/--HFD mice have the worst T2DR phenotype, retinal inflammation, retinal light responses, and microvascular degeneration compared with the WT-HFD and mice with normal chow.
MiR-150 is critical in maintaining the integrity of the retinal microvasculature as well as retinal function, and because of its anti-inflammatory and anti-angiogenic properties, miR-150 might be a good candidate for the future development of DR treatments in addition to the current therapeutics.
Introduction
The incidence of diabetes is projected to rise to 33% of the US population by 2050 owing to the obesity epidemic,1 of which 95% of patients with diabetes will have type 2 diabetes (T2D).2 Over 85% of patients with T2D have diabetes-related eye disorders, and 60% develop diabetic retinopathy (DR), the leading cause of blindness in US adults age 20–64.2 Clinically, DR has been diagnosed and treated as a vascular disease. While anti-vascular endothelial growth factor (VEGF) treatments significantly improve the outcomes of DR, nearly 30% of patients do not respond to anti-VEGFs,3 4 making development of new treatment strategies imperative. Chronic inflammation is a hallmark of obesity and T2D5 and a well-accepted major contributor to DR.6–8 While anti-inflammatory agents have been used to manage intraocular inflammation associated with DR, chronic administration of anti-inflammatory agents systemically or intravitreally causes additional ophthalmic complications such as cataract or steroid-induced glaucoma.9 Thus, finding alternatives to mitigate the progression of DR is an imperative medical need.
MicroRNAs (miRs) are short non-coding RNAs that form complexes with RNA binding proteins to suppress the expression of targeted genes through post-transcriptional mechanisms.10 They represent a set of modulators that can regulate metabolism, inflammation, and angiogenesis11 and have been linked to DR.12 13 Among them, there is a strong inverse correlation between miR-150 and patients with diabetes and DR. Serum miR-150 is decreased in patients with obesity,14 15 T1D,16 17 or T2D,14 18 which is correlated with increased inflammation and upregulation of angiogenic factors. We and others have reported that miR-150 is significantly decreased in the blood, heart, and retina in experimental animals with streptozotocin (STZ)-induced T1D12 19 or obesity-associated T2D.20 MiR-150 exhibits dual anti-inflammatory11 and antiangiogenic20–22 actions. Overexpression of miR-150 suppresses the expression of proinflammatory factors including NF-ĸB, tumor necrosis factor-α (TNFα), IL1β, and IL6 (11). MiR-150 dampens the expression of several angiogenic factors as well as VEGF receptor 2 (VEGFR2),20–22 the major VEGFR that promotes angiogenesis and DR.23–25 Deletion of miR-150 augments lipopolysaccharide-stimulated inflammatory responses.11 Intraocular injection of miR-150-mimics significantly reduces retinal angiogenesis and pathological neovascularization in animals with oxygen-induced retinopathy (OIR) and laser-induced choroidal neovascularization.22 26 These data point to the anti-angiogenic and anti-inflammatory roles of miR-150. However, whether diabetes-associated decrease of miR-150 contributes to the pathogenesis of DR or merely parallels the inflammation and microvascular complications in DR still remains unclear.
We and others previously used a high-fat diet (HFD)-induced T2D mouse model to mimic human obesity-associated T2D.11 20 27 28 Mice fed a diet with 60% calories from fat quickly become obese and further develop hyperglycemia, insulin-resistance, and glucose-intolerance, hallmarks of T2D, compared with the control mice fed a normal chow (14% fat calories).11 27–31 These mice have intraocular inflammation with elevated NF-ĸB (pP65) phosphorylation and other pro-inflammatory factors (including IL6, IL12, G-CSF, MCP-1, VEGF)28 in addition to the commonly observed systemic inflammation.11 29–31 In prediabetic and early diabetic humans and rodents, reduced electroretinogram oscillatory potentials (ERG OPs) are the first sign of distressed retinas.32–34 Interestingly, we found that these HFD (60% fat calories)-mice exhibit decreased ERG OPs that precedes the development of T2D28 and resembles patients with prediabetes. These HFD mice go on to develop T2D and have decreased ERG a-waves and b-waves.27 28 After 6–7 months of HFD regimens, microvascular complications are apparent in these mice,27 28 a sign of early DR.35 Thus, this HFD-induced T2D model is suitable to study obesity-associated T2DR. In this report, we found that mice under an HFD for only 1 month already had significantly decreased miR-150 in the blood and retina even before the manifestation of prediabetic state or hyperglycemia, indicating the possibility that decreased miR-150 may contribute to the development of T2D and T2DR. We used a loss-of-function strategy with miR-150 knockout (miR-150-/-) mice to determine the functional role of miR-150 in the pathogenesis of obesity-associated T2DR. If decreased miR-150 is merely a condition parallel to the progress of T2D/T2DR but not a contributing factor to the disease, the manifestation of T2D/T2DR in miR-150-/- mice should be similar to that of the wild type (WT). If global deletion of miR-150 further exacerbates retinal dysfunction, inflammation, and microvascular complications in high fat diet-induced T2DR, it will further strengthen the idea that decreased miR-150 under diabetic conditions contributes to the pathogenesis of DR.
Materials and methods
Animals
Four-week-old male C57BL/6J mice (WT) were purchased from the Jackson Laboratory (Bar Harbor, Maine, USA). B6(C)-Mir150tm1Rsky/J (miR-150-/-) mice were originally purchased from the Jackson Laboratory, and a colony was bred and maintained at Texas A&M University. Only male miR-150-/- mice were used in this study. All animal experiments were approved by the Institutional Animal Care and Use Committee of Texas A&M University. Mice were housed under temperature and humidity-controlled conditions with 12:12 hours light–dark cycles. All mice were given food and water ad libitum. To induce T2D, 5-week old male mice (WT and miR-150-/-) were fed an HFD (60% fat calories, 20% protein calories, and 20% carbohydrates calories; #D12492; Research Diets, New Brunswick, New Jersey, USA) for up to 24 weeks. Mice fed a standard laboratory chow (10% fat calories, 20% protein calories, and 70% carbohydrates calories; #D12450J; Research Diets) were used as controls. The body weights and food intakes of the mice were recorded weekly. The T1D mouse blood was collected from a previous study, in which the blood was collected 4 months after intraperitoneal injections of STZ.36 Mice injected with citric buffer were used as nondiabetic controls.
Quantitative PCR (qPCR)
Blood was taken via the mouse ocular vein and allowed to clot at room temperature for 30 min. After centrifuging at 2000 g for 10 min at 4 °C, 400–500 µL serum was collected for the purification of miRNAs (Direct-zol RNA Kit; Zymo Research, Irvine, California, USA). Quantitative PCR (qPCR) was performed using TaqMan miRNA assay kits (Thermo Fisher Scientific, Waltham, Massachusetts, USA) and Taqman qPCR master mix (Thermo Fisher Scientific). Specific primers and probes for mmu-miR-150–5 p (5’ UCUCCCAACCCUUGUACCAGUG 3’) were purchased from Life Technologies/Thermo Fisher Scientific. Cel-miR-39 (Life Technologies/Thermo Fisher Scientific) was used as the spike-in control. A standard curve of the cycle values with the corresponding quantities of miRNA was generated using serial dilutions of miRNA (1×, 2×, 4×, 5×, 8×, and 10×). Sample miRNAs were quantified by fitting their cycle values into the standard curve.
In situ hybridization
The eye sections from a patient with proliferative DR (PDR) and an age-matched donor without DR were provided by Dr Robert Rosa Jr. at Baylor Scott and White Health (Temple, Texas, USA). The miRCURY LNA miRNA detection probes (Qiagen, Germantown, Maryland, USA) were used to detect miR-150 according to the manufacturer’s instructions. Briefly, the sections were deparaffinized and incubated with proteinase K at 37 °C for 10 min. The digoxigenin (DIG)-labeled miR-150 probes (1–5 nM) in incubation buffer (2X SSC, 1X Denhardt's solution, 1 mg/mL yeast tRNA, 50% formamide, 10% Dextran) were hybridized with the sections at 55 °C for 1 hour. The sections were washed with a series of saline-sodium citrate buffer (2X, 1X, and 0.1X), then blocked and incubated with alkaline phosphatase conjugated anti-DIG antibodies (1/1000, Roche Life Science/Millipore-Sigma, St. Louis, Missouri, USA). The signal was visualized by 4-nitro-blue tetrazolium and 5-bromo-4-chloro-3’-indolylphosphate (Roche/Millipore-Sigma) by the manufacturer’s protocol. The nuclei were counterstained with nuclear fast red. The slides were then dehydrated and mounted. The images were taken using a Zeiss Axioplan microscope (Carl Zeiss Microscopy, White Plains, New York, USA).
Glucose tolerance and insulin resistance tests
Mice were fasted for 8 hours and then given D-glucose (2 g/Kg body weight; Sigma-Aldrich, St. Louis, Missouri, USA) or insulin (1 unit/Kg body weight; Life Technologies/Thermo Fisher Scientific) through intraperitoneal injections. Blood glucose levels were measured from the tail vein using a Clarity Plus blood glucose monitor (Diagnostic Test Group, Radnor, Pennsylvania, USA) at 0, 30, 60, 90, and 120 min following the glucose injections or at 0, 15, 30, 45, and 60 min following the insulin injections.
Electroretinogram
Mice were kept in the dark for at least 6 hours before the ERG recordings. Mice were then anesthetized with an intraperitoneal injection of Avertin (2% 2,2,2-tribromoethanol, 1.25% tert-amyl alcohol; Thermo Fisher Scientific) solution (12.5 mg/mL) at a dosage of 20 µL/g body weight and placed on a heating pad to maintain body temperature. Pupils were dilated by applying a drop of 1% tropicamide/2.5% phenylephrine mixture on the eyes for 5 min. The ground electrode was placed on the tail, the reference electrodes were placed under the skin below the eyes, and the recording electrodes conjugated with mini contact lenses (OcuScience, Henderson, Nevada, USA) were placed on the cornea of both eyes. A drop of Goniovisc (Hub Pharmaceuticals, Rancho Cucamonga, California, USA) was applied on the cornea of each eye to maintain proper contact between the cornea and the recording electrode. A portable ERG device (OcuScience) was used for the recordings. The retinal light responses were recorded after four repeated light flashes at lower intensities (0.1, 0.3, 1.0, and 3.0 cd.s/m2) and after a single light flash at higher intensities (10 and 25 cd.s/m2). There was a 1 min recovery period between different light intensities. The amplitudes and implicit times of a-wave, b-wave, and OPs were analyzed by using the ERGView 4.4 software (OcuScience).
Immunohistological staining
Mouse eyes were collected, fixed with 4% paraformaldehyde, and processed for paraffin-embedded sectioning after 24 weeks of the food regimen. Paraffin sections (4 µm) of the mouse eyes from all four experimental groups were mounted on the same slide. After deparaffinization, sections were permeabilized in citrate buffer (pH 6.0) at 80 °C for 1 hour. Sections were then blocked with 10% goat serum for 2 hours at room temperature and incubated with anti-phospho extracellular signal-regulated kinase (ERK) (Cat.# 4370, Cell Signaling, Danvers, Massachusetts, USA) or anti-phospho NFĸB P65 (Cat.# 3033, Cell Signaling) overnight at 4 °C. After washing with PBS, sections were incubated with Alexa Fluor 488/568 goat anti-rabbit IgG (1:50 dilution; Molecular Probes/Life Technologies/Thermo Fisher Scientific, Grand Island, New York, USA) for 2 hours at room temperature and mounted with ProLong Gold antifade reagent containing 4′,6′-diamidino-2-phenylindole (Invitrogen/Life Technologies/Thermo Fisher Scientific). Images were obtained using a Zeiss Stallion digital imaging workstation equipped with a Zeiss Axiovert 200M microscope (Carl Zeiss Microscopy) under identical settings. The average fluorescence intensity was measured in the outer and inner segments of photoreceptors by ImageJ (National Institutes of Health, Bethesda, Maryland, USA).
Retinal vasculature morphological analysis
Mouse eyes were collected and fixed with 4% paraformaldehyde at 4 °C for 20 hours. Whole retinas were excised and kept in distilled water with gentle rocking overnight at room temperature. The retinas were then incubated with 3% trypsin (BD Biosciences, Franklin Lakes, New Jersey, USA) for 1.5 hours at 37 °C, followed by washing with distilled water by gentle pipetting to remove any neural tissue. The remaining network of retinal vasculature was transferred to a glass slide and flattened. After staining with H&E, images of the retinal vasculature were taken using a Zeiss Axioplan microscope. Quantification of degenerated capillaries were assessed within 3–4 randomly chosen regions from each retina. The vascular areas were analyzed using AngioTool.37
Statistical analysis
All data are presented as mean±SE of the mean (SEM). Student’s t-test, one-way or two-way analysis of variance (ANOVA) followed by Fisher’s post hoc test was used for statistical analyses among groups whenever appropriate. Throughout, p<0.05 was regarded as significant. Origin 8.6 (OriginLab, Northampton, Massachusetts, USA) was used for statistical analyses.
Results
Decreased miR-150 in the retina is associated with diabetes
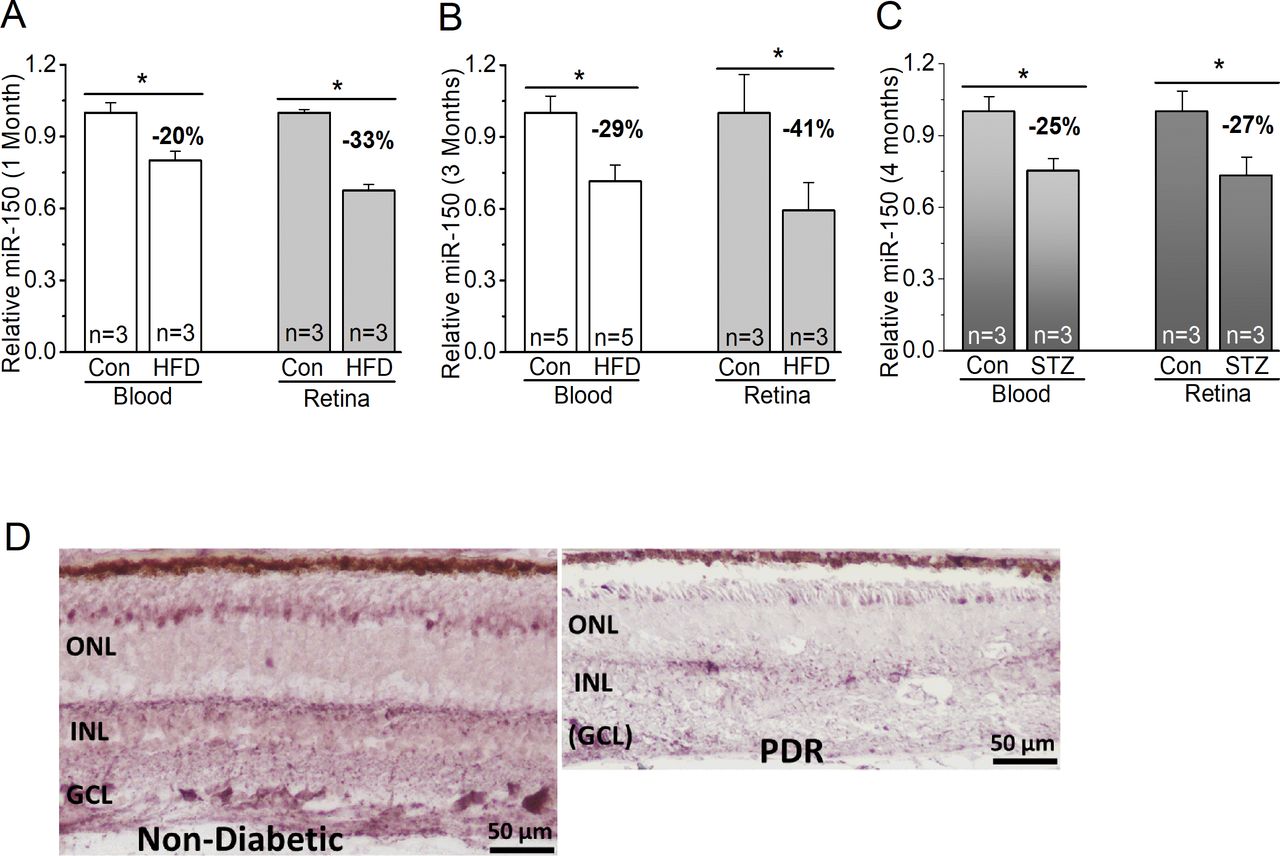
We used both T1D and T2D mouse models to determine if miR-150 would be decreased in the retinas. We compared the levels of miR-150 in WT mice fed with the HFD (60% fat calories) to the controls fed with a normal chow. One month after the diet regimen, miR-150 was significantly decreased in the blood and neural retina of HFD-mice compared with the control (figure 1), but at this time, HFD-mice were obese but not diabetic, since their blood glucose levels were still normal (same as the control)28 (figure 2). Three months after the diet regimen, miR-150 was further decreased in the HFD-mice (figure 1), and HFD-mice started to display characteristic T2D (figure 2). We noticed that HFD-induced decrease of miR-150 in the retina was more severe than that in the blood circulation. As a comparison, we also induced T1D in mice by STZ injections. Four months after STZ-injections, mice with T1D also showed decreased miR-150 in both blood and the retina (figure 1). Hence, the decrease of miR-150 is associated with obesity and diabetic conditions. We further verified the relationship between decreased miR-150 and diabetic eyes in patients. Using in situ hybridization staining, the retina from a patient with PDR had decreased miR-150 signal qualitatively compared with an age-appropriate donor without diabetes (figure 1). Thus, either decreased miR-150 is correlated to the development of DR, or it is a contributing factor to the pathogenesis of DR. To answer this question, we used a loss-of-function strategy to examine if global deletion of miR-150 might exacerbate obesity-associated T2D and DR.

MiR-150 is decreased in diabetic eyes. (A–C) The blood serum (blood) and retina were collected from mice to detect the levels of miR-150. (A,B) MiR-150 is decreased in the serum and retina of mice fed with a HFD compared with the control mice fed with a normal chow (Con) for 1 month (A) or 3 months (B). (C) Using the STZ-induced T1D mouse model, 4 months after the STZ-injections, the STZ-T1D mice (STZ) also have decreased miR-150 in the serum and retina compared with the control mice injected with a citric buffer (Con). Student’s t-test, *p<0.05. (D) The in situ hybridization of miR-150 in retinal sections from a non-diabetic age-matched donor (left) and from a patient with PDR (right) shows a qualitative decrease of miR-150 in the retina of PDR. Con, control; GCL, ganglion cell layer; HFD, high-fat diet; INL, inner nuclear layer; ONL, outer nuclear layer; PDR, proliferative diabetic retinopathy; STZ, streptozotocin; T1D, type 1 diabetes.

Systemic evaluations and comparisons of WT and miR-150-/- mice after the diet regimen. Both WT and miR-150-/- mice were divided into two groups: the control group (control) fed a normal chow and the other group fed the HFD. (A) The mice fed the HFD (WT HFD and miR-150-/- HFD) have significant weight gains compared with mice fed a normal chow (WT control and miR-150-/- control). (B) Systemic blood glucose levels of mice fed the HFD (WT HFD and miR-150-/- HFD) are significantly higher and above 200 mg/dL compared with the control (WT control and miR-150-/- control) after only 3 months of diet regimen. (C) One month after the diet regimen, mice were tested for glucose tolerance. Mice fed the HFD (WT 1 m HFD and miR-150-/- 1 m HFD) have a significantly higher glucose intolerance compared with mice fed a normal chow (WT control and miR-150-/- control). (D) One month after the diet regimen, mice were tested for insulin resistance. (E) Two months after the diet regimen, mice were tested for glucose tolerance. Mice fed the HFD (WT 2 m HFD and miR-150-/- 2 m HFD) have a significantly higher glucose intolerance compared with mice fed a normal chow (WT control and miR-150-/- control). (F) Two months after the diet regimen, mice were tested for insulin resistance. MiR-150-/- mice fed the HFD (miR-150-/- 2 m HFD) show a significant difference in insulin resistance only at 15 min after insulin injections. Open square: WT fed a normal chow (control); shaded square: WT fed the HFD; open triangle: miR-150-/- fed a normal chow (control); shaded triangle: miR-150-/- fed the HFD. Two-way ANOVA with Fisher’s post hoc tests, *p<0.05. ANOVA, analysis of variance; HFD, high-fat diet; WT, wild type.
We monitored WT and miR-150-/- mice fed with the HFD and found that 1 month after the HFD regimen, obese WT and miR-150-/- mice already developed glucose-intolerance compared with the mice fed with normal chow (control; figure 2). The glucose-intolerance was only caused by the HFD at this time (two-way ANOVA). Thus, global deletion of miR-150 did not further exacerbate obesity-associated pre-diabetes at the overall system level. As we previously reported, mice fed with an HFD (60% fat calories) for 3 months develop T2D-like syndromes11 27 28 including hyperglycemia, glucose-intolerance, and insulin-resistance. After 3 months of the HFD regimen, mice with systemic knockout of miR-150 (miR-150-/-) have significantly higher glucose-intolerance, insulin-resistance, as well as systemic inflammation compared with the WT fed an HFD,11 indicating that miR-150 regulates obesity-induced inflammation. However, the biological processes mediated by microRNAs and their targets are often cell type or tissue-dependent.38 39 While miR-150 is abundant in circulating blood, it is also expressed in the neural retina.12 40 It is possible that deletion of miR-150 might impact various tissues and organs differently. We next examined whether deletion of miR-150 might affect the function of the neural retina early in mice fed with an HFD.
The retinal light responses are compromised in miR-150-/- mice fed with an HFD
One month after the diet regimen, mice were examined using a series of light flashes after they were dark-adapted for a few hours. Regardless of whether mice were fed an HFD or normal chow (control), WT and miR-150-/- mice had similar amplitudes in light responses as shown by both a-wave and b-wave ERG amplitudes in all four groups (figure 3). However, there was a significant delay in the light responses from miR-150-/- mice fed with the HFD for 1 month (miR-150-/- 1 m HFD), as their b-wave implicit times were significantly higher than the other three groups. After 2 months of the diet regimen, miR-150-/--HFD mice had significantly decreased ERG a-wave and b-wave amplitudes. We further analyzed the OPs and found that the OP amplitudes and implicit times recorded from miR-150-/- mice fed with the HFD for 1 month (miR-150-/- 1 m HFD) were significantly aggravated compared with the other three groups (figure 3). As a delayed OP latency (higher implicit time) is the first sign of dysfunction in prediabetic/early diabetic retinas in both rodents and humans,32–34 our data suggest that deletion of miR-150, especially in the neural retina, might have detrimental impacts in obese and prediabetic animals that potentially lead to the development of T2DR.
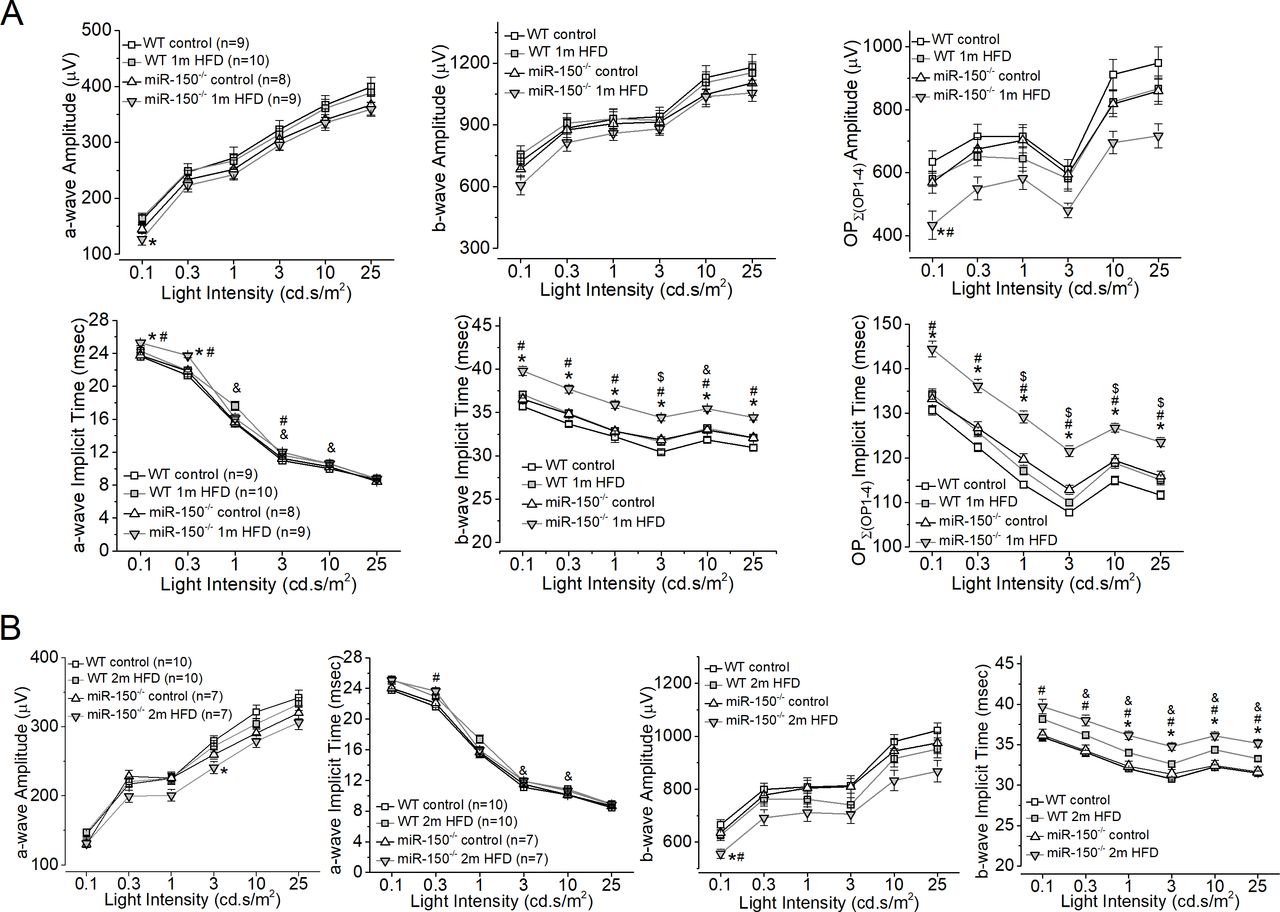
MiR-150-/- mice fed the HFD for only one or 2 months have compromised retinal light responses. After 6 hours in complete darkness, dark-adapted ERGs with a series of flashes (0.1, 0.3, 1, 3, 10, and 25 cd.s/m2) were recorded from all four experimental groups. The amplitudes and implicit times of ERG a-wave, b-wave, and oscillatory potentials (OP1 to OP4) were measured and analyzed. (A) The ERG amplitudes (upper panel) and implicit times (lower panel) of a-wave, b-wave, and summation (∑) of OP1-OP4 from mice after 1 month of the diet regimen are shown. (B) Two months after the diet regimen, the ERG amplitudes and implicit times of a-wave and b-wave are shown. * indicates a significant difference between the WT HFD group and the miR-150-/- HFD group; # indicates a significant difference between the miR-150-/- control group and the miR-150-/- HFD group; & indicates a significant difference between the WT control group and the WT HFD group; $ indicates a significant difference between the miR-150-/- control group and the WT control group. One-way ANOVA with Fisher’s post hoc tests, *p<0.05. ANOVA, analysis of variance; ERG, electroretinogram; HFD, high-fat diet; WT, wild type.
Deletion of miR-150 exacerbates retinal inflammation in obesity-associated T2D mice
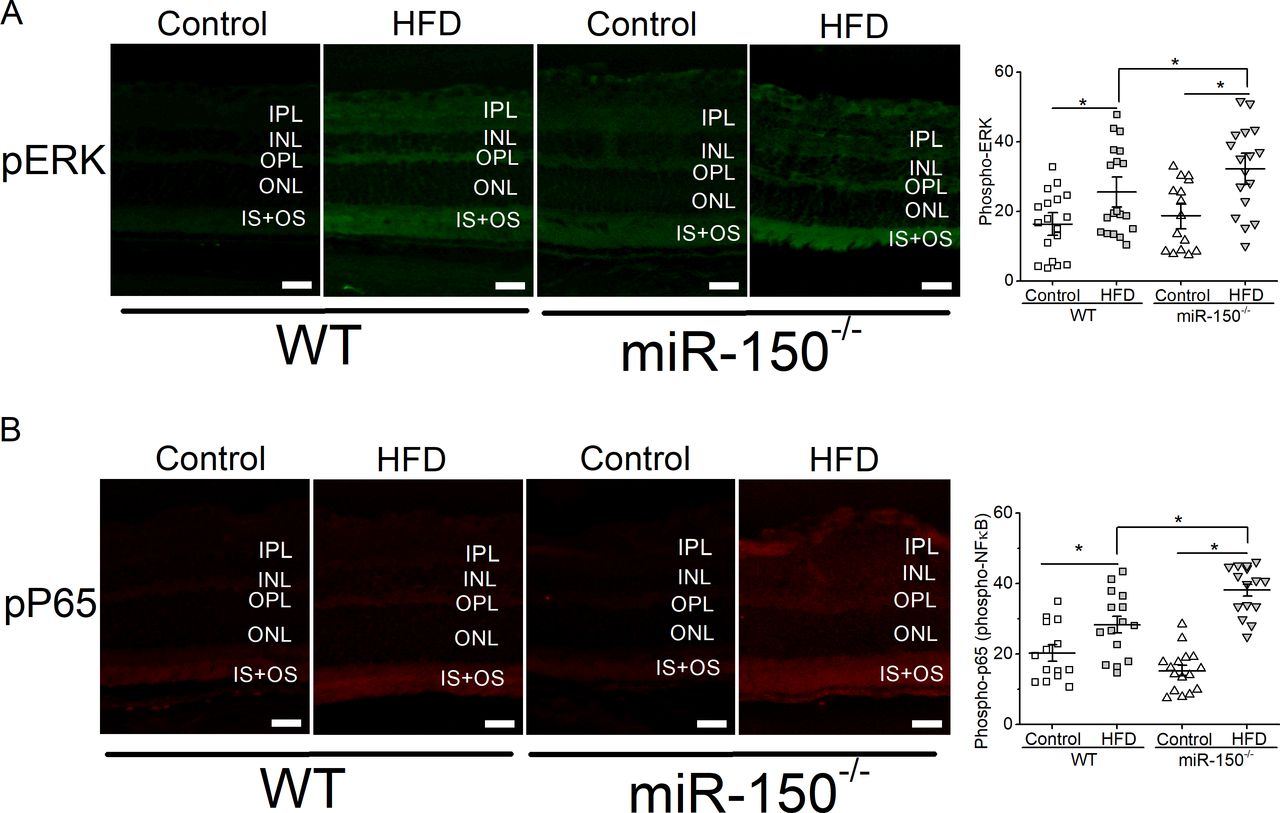
We previously showed that mice fed with the HFD for 6 months have a significant increase in intraocular inflammation.27 28 Since miR-150 is a suppressor of proinflammatory factors,11 41–45 we postulated that deletion of miR-150 would further increase inflammation in the retina. MiR-150-/- mice fed the HFD (miR-150-/- HFD) for 6 months had the highest amount of activated/phosphorylated P65 (pP65), a subunit of NF-κB transcription complex and a biomarker for inflammation,46 compared with the mice fed a normal chow or WT mice fed the HFD (figure 4). Similarly, activated/phosphorylated ERK, an upstream modulator of NF-κB leading to inflammation, was also highest in the retina of miR-150-/- mice fed the HFD (miR-150-/- HFD). Thus, miR-150-/- mice fed the HFD had the highest systemic inflammation11 and had the highest retinal inflammation. Inflammation is a major culprit contributing to the vascular problems of DR, and if deletion of miR-150 caused higher inflammation in obese-T2D mice, we hypothesized that HFD-induced DR in miR-150-/- mice would develop more severe microvascular complications compared with that in the WT.

Global knockout of miR-150 exacerbates HFD-induced retinal inflammation. Six months after the diet regimen, the retinal sections were processed for immunostaining with antibodies against phosphorylated ERK (pERK; A) and phosphorylated NF-κB subunit P65 (pP65; B). Mice fed the HFD have significantly elevated pERK and pP65 compared with mice fed a normal chow (Control). In addition, miR-150-/- mice fed the HFD have significantly higher pERK and pP65 fluorescent signals in the outer and inner segments of photoreceptors compared with the WT mice fed the HFD. Each data point represents one area of measurement. n=3 mice for each group; scale bar=20 µm. Two-way ANOVA with Fisher’s post hoc tests, *p<0.05. ANOVA, analysis of variance; ERK, extracellular signal-regulated kinase; HFD, high-fat diet; INL, inner nuclear layer; IPL, inner plexiform layer; IS, photoreceptor inner segment; NF-kB, nuclear factor kappa B; ONL, outer nuclear layer; OPL, outer plexiform layer, OS, photoreceptor outer segment; WT, wild type.
Deletion of miR-150 causes increased degeneration of retinal microvasculature
We previously showed that retinal dysfunction occurs after 1 month of HFD28 (figure 3), but it takes at least 6 months of the HFD regimen to induce microvascular complications in this obesity-associated T2DR animal model as mice fed with the HFD show a higher fluorescent leakage.28 After the HFD for 6 months, we examined retinal capillaries and found that miR-150-/- mice had higher densities of degenerated retinal capillaries compared with the WT regardless of the diet (figure 5), which is a surprise. These data indicate that miR-150 is important in maintaining the structural integrity of retinal microvasculature. Furthermore, miR-150-/--HFD mice also had significantly higher densities of degenerated capillaries compared with the miR-150-/- mice fed a normal chow (miR-150-/-, control). Using two-way ANOVA, both HFD and deletion of miR-150 had significant impacts on retinal capillary degeneration, and there was an interaction between HFD and miR-150 deletion. Thus, deletion of miR-150 further aggravates obesity-associated T2DR microvascular complications.

Global knockout of miR-150 further promotes degeneration of retinal capillaries. Six months after the diet regimen, whole mount retinas were processed and analyzed for microvasculature morphology. (A) Representative images from trypsin-digested and stained retinal vasculature (rows 1 and 3) with AngioTool rendered images (rows 2 and 4) from the WT (rows 1 and 2) and miR-150-/- (rows 3 and 4) mice fed a normal chow (Control) or the HFD are shown. The light blue rectangular boxes indicate the degenerated/acellular capillaries. Scale bar=20 µm. (B) A representative image of a whole mount retina after trypsin digestion and staining is displayed. The blue rectangular boxes represent randomly selected areas from the whole mount retina that were used for analyses. Scale bar=50 µm. (C) There is no significant difference between the WT mice fed a normal chow (Control) or the HFD (HFD), even though the HFD group has a slightly higher density of degenerated capillaries. The miR-150-/- mice have significantly higher densities of degenerated capillaries compared with the WT mice, and the miR-150-/- mice fed the HFD have even more degenerated capillaries compared with the miR-150-/- mice fed with a normal chow (Control). Each data point represents one analyzed area. Each whole mount retina has 3–4 randomly chosen areas. The vascular area was measured using AngioTool. Each group has n=3 mice analyzed. Two-way ANOVA with Fisher’s post hoc tests, *p<0.05. ANOVA, analysis of variance; HFD, high-fat diet; WT, wild type.
Discussion
In this study, we found that miR-150 is significantly decreased in the blood and retina in mice fed with an HFD even before the manifestation of the prediabetic state or hyperglycemia, indicating that decreased miR-150 may contribute to the development of T2D and T2DR. Deletion of miR-150 further aggravates obesity-associated T2DR, including worsened retinal light responses, retinal inflammation, and the degeneration of retinal microvasculature, compared with the WT-T2D mice. Thus, decreased miR-150 is not merely correlated to the severity of T2D/T2DR but contributes to the pathogenesis of T2D/T2DR. Furthermore, miR-150 is critical in maintaining the structural integrity of retinal microvasculature and dampening inflammation, as we showed that at 7–8 months old, miR-150-/- mice without HFD had significantly more degenerated retinal microvasculature than the WT of the same age. It is reasonable to postulate that under diabetic insults, such as obesity even before prediabetic state, decreased miR-150 might have compromised the health of the neural retina and retinal microvasculature to become more susceptible to the progression of DR.
While DR is diagnosed and treated as a chronic vascular disease, the neural retina displays changed physiology at prediabetic or early diabetic stages with one of the earliest signs being altered ERG OPs.32–34 In this report, we showed that after 1 month of HFD, while the WT-HFD mice also showed decreased OP amplitudes and increased OP implicit times, miR-150-/--HFD mice had larger magnitude changes in OPs, even though there was no significant difference in systemic metabolic measures (glycemia, glucose-intolerance, and insulin-resistance). MiR-150 is abundant in the blood and is expressed in the retina.22 However, compared with the WT-HFD mice, data from miR-150-/--HFD mice after 1 month of HFD suggest that decreased miR-150 might already contribute to the retinal dysfunction at obese and prediabetic stages. The adverse impact of decreased miR-150 might be greater locally in the retina than globally to the whole body in obesity-associated T2D.
MiR-150 has both anti-inflammatory11 41–45 and antiangiogenic20–22 actions, as overexpression of miR-150 dampens the expression of several proinflammatory and proangiogenic factors. In OIR mice, the intraocular injection of miR-150 mimics suppresses pathological ocular neovascularization.22 The importance of miR-150 in anti-inflammation and anti-angiogenesis is further verified in miR-150-/- mice with obesity-associated T2D after several months of HFD. These miR-150-/--HFD mice have significantly higher systemic11 and retinal (figure 4) inflammation compared with the WT-HFD mice, and they also have significantly more degenerated capillaries compared with the WT-HFD mice (figure 5). These data confirm the idea that diabetes-caused decrease of miR-150 is not simply associated with the disease progression, decreased miR-150 in diabetic insults might contribute to the development of DR. Thus, the next step is to determine whether administration of miR-150 mimics might alleviate or dampen the progression of DR.
MicroRNAs regulate their downstream targets by binding to the 3’-untranslated regions (3’-UTRs), degrading, and preventing the translation of target genes. Decreased miR-150 will cause an increase of its target genes such as c-Myb, Etf1, and Elk1, which promotes the expression of inflammatory factors including TNFα and interleukin-1β.11 In addition, miR-150 can suppress the expression of angiogenic genes including Cxcr4, Dll4, and Fzd4.22 We previously showed that miR-150 downregulates the VEGF receptor 2 (VEGFR2) expression in cultured endothelial cells.20 However, there is no match in sequence between miR-150 and the 3’-UTR of VEGFR2, so the action of miR-150 in inhibiting VEGFR2 expression might be indirectly through other factors, possibly c-Myb. Therefore, increased miR-150 may inhibit the vascular pathologies of DR by downregulating angiogenic genes. By targeting proinflammatory and angiogenic genes, miR-150 may alleviate the progression of DR.
MicroRNAs have been indicated as possible biomarkers for diseases or potential therapeutic targets to treat diseases including diabetes and DR. While many miRs are associated with disease conditions, very few are investigated in mechanistic studies of disease pathogenesis. In addition to miR-150, both miR-15a and miR-146a are downregulated in retinal endothelial cells isolated from patients with diabetes.47 48 Overexpression of endothelial miR-15a or miR-146a in mice significantly dampens diabetes-induced inflammation in the retina and prevents vascular damage.48 49 Thus, we postulate that overexpression of miR-150 might be able to dampen diabetes-caused vascular complications similar to that of miR-15a and miR-146a, because miR-150 is also expressed in endothelial cells.22 On the contrary, miR-21 is upregulated in the diabetic retina, and downregulation of miR-21 has been shown to dampen diabetes-associated inflammation.50 MicroRNAs normally form complex networks to regulate physiology, metabolism, and biological processes,39 as such, obesity or prediabetic conditions can dysregulate multiple miRs that leads to the progression of DR. We cannot rule out the possibility that miR-150 might synergistically act with other miRs such as miR-15a and miR-146a and antagonistically to miR-21 to maintain the health of the retina and vasculature. As we showed that even in obese and prediabetic conditions, miR-150 was already decreased in the retina and blood circulation and decreased miR-150 was strongly correlated with retinal dysfunction and vascular pathology; our results suggest that early intervention with miR-150 might alleviate or slow down the burden of DR progression. The idea of using miR-150 or multiple miRs for therapeutics to treat or prevent DR is worth future investigation. Taken together, our data illustrate that miR-150 is important to maintain the health of capillaries. Decreased miR-150 is not merely a biomarker for diabetes or a correlation with the disease progression, but it is a contributing factor to the development of DR.
Acknowledgments
The authors thank Ms Janet Ya-An Chang and Dr Liheng Shi for their technical support. Dr Robert Rosa Jr. (Baylor Scott and White Health, Temple, Texas, USA) for providing the human eye sections is gratefully acknowledged.
References
Footnotes
Presented at Parts of this study were presented in abstract form at the Society for Neuroscience 2019 Annual Conference, Chicago, Illinois, USA, 19–23 October 2019. Yu, F., Chapman, S., Ko, M.L., and Ko, G. Y.-P. The role of microRNA-150 in the pathogenesis of diabetic retinopathy. Society for Neuroscience, 575.02, 2019.
Contributors FY performed the experiments, analyzed the data, assisted in manuscript preparation, and was involved in writing of the manuscript. FY had full access to all the data in the study. SC and DLP assisted in data analyses. MLK and BZ assisted in manuscript preparation and editing. GYPK designed the study, provided experimental oversight, assisted in data analysis, and wrote the manuscript. GYPK is the guarantor of this work, and as such, had full access to all the data in the study and takes responsibility for the integrity of the data and the accuracy of the data analysis.
Funding This work was in part supported by a graduate research award from the College of Veterinary Medicine and Biomedical Sciences at Texas A&M University to FY and a philanthropic gift fund for DR and vision research to GYPK.
Competing interests None declared.
Patient consent for publication Not required.
Provenance and peer review Not commissioned; externally peer reviewed.
Data availability statement Data are available on reasonable request. All data relevant to the study are included in the article. FY is the first author of this work, and GYPK is the guarantor of this work. As such, FY and GYPK have full access to all the data in the study and takes responsibility for the integrity of the data and the accuracy of the data analysis. All data relevant to the study are included in the article, and data are available on reasonable request.