Article Text

Abstract
Introduction Subjects with type 2 diabetes have an excess risk of cancer. The potential role of advanced glycation end products (AGEs) accumulated during long-term hyperglycemia in cancer development has been suggested by biological studies but clinical data are missing. AGEs can be estimated by measuring the skin autofluorescence. We searched whether the skin autofluorescence could predict new cancers in persons with type 2 diabetes.
Research design and methods From 2009 to 2015, we measured the skin autofluorescence of 413 subjects hospitalized for uncontrolled or complicated type 2 diabetes, without any history of cancer. The participants were followed for at least 1 year and the occurrences of new cancers were compared according to their initial skin autofluorescences.
Results The participants were mainly men (57.9%), with poorly controlled (HbA1c 72±14 mmol/mol or 8.7%±1.8%) and/or complicated type 2 diabetes. Their median skin autofluorescence was 2.6 (2.2–3.0) arbitrary units. Forty-five new cancer cases (10.9%) were registered during 4.8±2.3 years of follow-up: 75.6% of these subjects had skin autofluorescence higher than the median (χ2: p=0.001). By Cox regression analysis adjusted for age, gender, body mass index, history of smoking and renal parameters, skin autofluorescence >2.6 predicted a 2.57-fold higher risk of cancer (95% CI 1.28 to 5.19, p=0.008). This association remained significant after excluding the eight cancers that occurred in the 4 years after inclusion (OR 2.95, 95% CI 1.36 to 6.38, p=0.006). As a continuous variable, skin autofluorescence was also related to new cancers (OR 1.05, 95% CI 1.01 to 1.10, p=0.045).
Conclusions Skin autofluorescence, a potential marker of glycemic memory, predicts the occurrence of cancer in subjects with type 2 diabetes. This relation provides a new clinical argument for the role of AGEs in cancer. Their estimation by measuring the skin autofluorescence may help select subjects with diabetes in cancer screening programs.
- cancer
- advanced glycation end product
- type 2 diabetes
- biomarkers
This is an open access article distributed in accordance with the Creative Commons Attribution Non Commercial (CC BY-NC 4.0) license, which permits others to distribute, remix, adapt, build upon this work non-commercially, and license their derivative works on different terms, provided the original work is properly cited, appropriate credit is given, any changes made indicated, and the use is non-commercial. See: http://creativecommons.org/licenses/by-nc/4.0/.
Statistics from Altmetric.com
Significance of this study
What is already known about this subject?
Subjects with type 2 diabetes have an excess risk of cancer. It is not known whether chronic hyperglycemia may favor cancer by itself.
Advanced glycation end products (AGEs), accumulated during long-term hyperglycemia, can be estimated by skin autofluorescence. The potential role in cancer development of AGEs has been suggested by biological studies but clinical data are missing.
What are the new findings?
Subjects with type 2 diabetes who developed cancer had higher initial skin autofluorescence than those who did not.
This association remained significant after multiadjustments and after exclusion of subjects who developed cancer early after inclusion.
Skin autofluorescence, a potential marker of glycemic memory, predicts the occurrence of cancer in subjects with type 2 diabetes.
This relation provides a new clinical argument for the role of AGEs in cancer.
How might these results change the focus of research or clinical practice?
Estimating AGEs by measuring the skin autofluorescence may help select subjects with diabetes in cancer screening programs.
Introduction
Subjects with type 2 diabetes have an excess risk of cancer by +20%–25%1: mainly colorectal, liver, pancreas, and breast cancers.2 Obesity and the growth-promoting effects of insulin contribute to this risk,3 but they do not explain +29% excess cancers in type 1 diabetes as recently reviewed.4 It is not known whether chronic hyperglycemia may favor cancer by itself. Glucose is the main nutrient for cancer cells.5 High glucose levels can also induce epigenetic changes enhancing their growth characteristics even after return to normoglycemic conditions: a ‘hyperglycemic memory’ phenomenon may occur in these cells,6 as described for the vascular complications of diabetes.
Advanced glycation end products (AGEs) generated during years of chronic hyperglycemia are an important molecular basis for metabolic memory.7 Numerous biological studies suggest a potential role for AGEs in the development of cancer. Methylglyoxal, a common AGE precursor and a product of the Maillard reaction, exerts pro-tumorous effects.8 The later generated N-ε-(carboxymethyl)-lysine activates the growth of pancreatic cancer cells.9 The interaction of AGEs with their receptors (RAGE) promotes epithelial-mesenchymal transition, inflammation, and angiogenesis.10 The advanced glycation of the extracellular matrix makes it stiffer, rigid, disorganized and dysfunctional, which helps the migration of cancer cells.10 The accumulation of AGEs may be an important contributor to the effect of lifestyle-associated risk factors for cancer,11 but clinical data arguing for this hypothesis are missing.
Due to their fluorescent properties, the long-term accumulation of AGEs in tissues can be assessed by the simple, non-invasive measurement of the skin autofluorescence (SAF),12 a marker of glucose memory.13 In type 2 diabetes, the SAF predicts microangiopathic and macroangiopathic complications.14 15 Does it predict cancer?
In 413 subjects with poorly controlled type 2 diabetes, free of cancer, we measured the SAF during years from 2009 to 2015. Thereafter, we registered new cancer cases until 1 September 2019, and we analyzed their relations with the initial autofluorescence.
Methods
Subjects
From years 2009 to 2015, a total of 413 persons with type 2 diabetes were consecutively included. They were all hospitalized in the Diabetology Unit of the Centre Hospitalier Universitaire of Bordeaux (France) for uncontrolled or complicated type 2 diabetes. We only included subjects who were later followed for at least 1 year. Thirty-four more subjects were excluded because they already had a cancer history (figure 1).
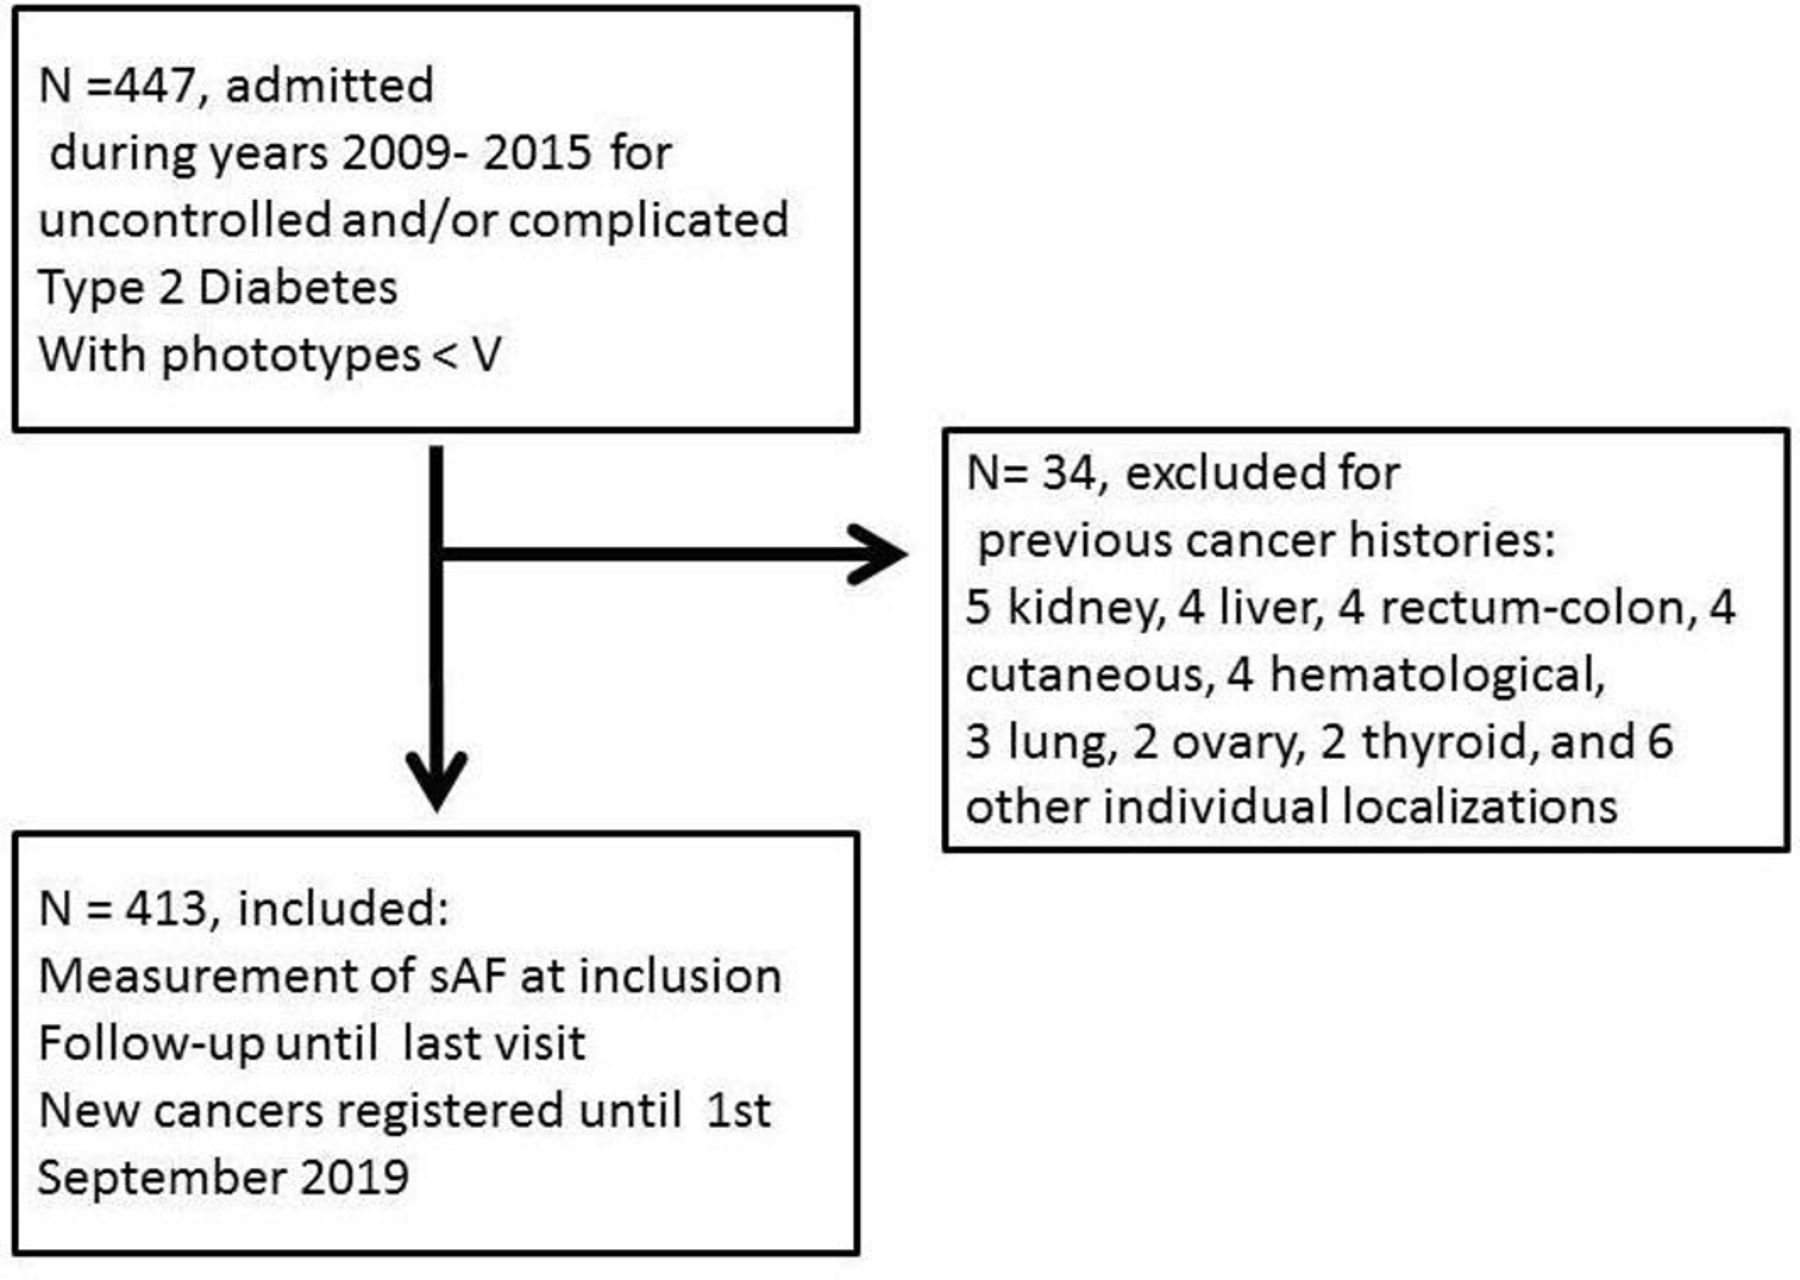
Flow chart. sAF, skin autofluorescence.
Data
At the time of inclusion, we recorded the main clinical characteristics of the participants: age, gender, body mass index (BMI), history of smoking, duration of diabetes, presence of diabetic retinopathy or a foot ulcer. Macroangiopathy was defined as a previous cardiovascular event: myocardial infarction, stroke or gangrene, or a previous revascularization procedure. Biological examinations were performed on blood and urine samples: HbA1c, serum creatinine, albumin excretion rates (AER). Glomerular filtration rates (GFR) were estimated by the Chronic Kidney Disease Epidemiology Collaboration formula.
Measurement of the SAF
The cutaneous accumulation of the AGEs was estimated from the SAF using an AGE Reader (DiagnOptics, Groningen, The Netherlands). The AGEs detectable by their fluorescent property represent a subset of the AGEs. The device illuminated 1 cm2 of the forearm skin. We checked that there were no scars and no application of cream16 on the studied site. SAF values were calculated by dividing the mean emitted light intensity (excitation light source ranging from 420 to 600 nm) by the mean reflected excitation light intensity from the skin (over 300–420 nm). People with Fitzpatrick phototypes V and VI were not included due to their skin pigmentation, which had ultraviolet reflectance of <10%. The results were expressed in arbitrary units (AU).
Registering of new cancer cases
Searching for new cancers, we examined the medical files registered by the Centre Hospitalier Universitaire of Bordeaux until September 2019. The follow-up was stopped at the last visit in our institution. Registering was stopped on 1 September 2019.
Statistical analysis
The results are presented as mean±SD for continuous variables, median and IQRs for the SAF and the AERs, and as percentages for categorical variables. The characteristics of the subjects who developed a cancer were compared with the remaining free of cancer subjects by t-tests for continuous variables and χ2 for categorical variables. The free of cancer survival curves were compared between subjects categorized as having higher versus lower than the median SAF at inclusion, by Kaplan-Meier survival analysis, and we performed a Cox regression analysis to adjust for potential confounders: age, gender, BMI, history of smoking, and renal parameters. To reduce the possibility of reverse causality, this analysis was repeated after exclusion of cancer cases occurring during the first 4 years after the inclusion.
Results
Characteristics of the population
Four hundred and thirteen subjects were included, their main characteristics are reported in table 1. They were mainly men (57.9%), 62±9 years old, with obesity (BMI 32.5±6.0). 41.4% had history of smoking. Their type 2 diabetes (duration: 14±10 years) was poorly controlled (HbA1c 72±14 mmol/mol or 8.7%±1.8%) and/or complicated (26.6% with diabetic retinopathy, 44.6% with diabetic kidney disease, 34.9% with macroangiopathy).
Characteristics of the population and new cancer cases (n=413)
Skin autofluorescence
Their SAF was 2.6 (2.2–3.0) AU. As depicted in table 2, by multivariate regression analysis, the SAF was related to the age, the duration of diabetes, history of smoking, and negatively related to the estimated GFR. It was not related to the HbA1c.
Determinants of the skin autofluorescence, by multivariate regression analysis
New cancer cases
Forty-five new cancer cases (10.9%) were registered during the follow-up (4.8±2.3 years). The localizations were pulmonary (n=12), hepatic (n=8), colon (n=4), cutaneous (n=4), renal (n=3), prostatic (n=3), esophageal (n=2), and individual cases for stomach, cholangiocarcinoma, breast, endometrial, urothelial, thyroid, glioblastoma, lymphoma, chronic lymphoid leukemia. The subjects with new cancers are compared with the others in table 1. They were 4 years older, more men (both p<0.05), they did not differ in their BMI, diabetes duration and HbA1c, nor in the prevalence of diabetic vascular complications. Their SAF was higher (p<0.05).
Relation between SAF and new cancer cases
Thirty-four of new cancer cases (75.6%) occurred in subjects with SAF higher than the median value: 2.60 AU (p=0.001 by χ2). The cancer-free survival curves according to such a high SAF are depicted in figure 2 (log rank: 12.4; p=0.0004).

Cancer-free survival curves according to skin autofluorescence (sAF). AU, arbitrary unit.
The relation between new cancers and a high SAF was analyzed by Cox regression analysis, adjusted for age, gender, BMI, history of smoking, AER and estimated GFR, as depicted in table 3. A high SAF predicted a 2.57-fold higher risk of cancer (95% CI 1.28 to 5.19, p=0.008) after these adjustments. As a continuous variable, the SAF was also related to new cancers (OR 1.05, 95% CI 1.01 to 1.10, p=0.045).
The relation between a high skin autofluorescence (>2.60 AU) and new cancer cases, by Cox regression analysis (n=45)
These analyses were repeated after excluding the eight new cancer cases that occurred during the first 4 years of follow-up to reduce the possibility of reverse causality. A high SAF predicted an adjusted 2.95-fold higher long-term risk of cancer (95% CI 1.36 to 6.38, p=0.006). As a continuous variable, the SAF was also related to new cancers after 4 years (OR 1.07, 95% CI 1.01 to 1.13, p=0.016).
SAF and new cancers according to gender
The SAFs did not differ according to gender, neither in participants who did not develop a new cancer: 2.62±0.63 AU for men vs 2.62±0.60 for women, nor in those who developed a cancer: 2.82±0.71 AU for men (n=33) vs 2.90±0.75 for women (n=12). Adjusted for age, high SAF (>2.6 AU) was related to new cancers in men (OR 2.39, 95% CI 1.05 to 5.45), which did not reach significance for women, who were less represented (OR 1.72, 95% CI 0.51 to 5.76).
Discussion
During a 4.8 years of follow-up, we registered 45 new cancer cases among 413 subjects with type 2 diabetes, initially free of any cancer. The subjects who developed a cancer were older, 73% were men, they did not differ from the others in their initial BMI, duration of diabetes, HbA1c, nor in the prevalence of the vascular complications of diabetes. Their initial SAF was higher, and 75% of cancers occurred in subjects with higher than the median autofluorescence. By Cox regression analysis, a high SAF was associated with a 2.5-fold higher risk of cancer, adjusted for age, gender, BMI, history of smoking, and renal parameters.
AGEs and cancer
This relation provides a new clinical argument for the role of AGEs in cancer. AGEs generated during years of chronic hyperglycemia are an important molecular basis for metabolic memory.7 Chronic hyperglycemia can epigenetically modify gene expression profiles in cells, and these changes may persist after return to normoglycemic conditions.6 This ‘hyperglycemic memory’ phenomenon may occur and participate in the acquisition of a cancerous phenotype in these cancer cells. The SAF values, calculated by dividing the mean emitted light intensity by the mean reflected excitation light intensity from the skin, with an AGE Reader, do not directly measure the AGE content in tissues, but correlate to the concentrations of AGEs in skin biopsies.12 Numerous biological studies suggest that AGEs accumulated in tissues favor cancer,8–10 and some clinical reports also argue for their role: high concentrations of AGEs in the serum have been related to later breast17 and rectal cancers,18 but these serum concentrations must be distinguished from the concentrations of AGEs in tissues, where these tissue AGEs directly exert their biological effects. The AGE-RAGE axis is probably more activated in tissues when AGEs are not bound to soluble RAGE (s-RAGE), and s-RAGE is reduced before some digestive cancers,19 conditioned by variants of the RAGE gene.20 The relation between the SAF and skin cancer has already been reported in the specific context of organ transplant recipients, considered as a reflect of photodamage.21 Only four of our subjects developed a skin cancer, and the accumulation of AGEs seems a much more plausible mechanism for the development of solid cancers deeper than skin cancers, in the context of diabetes. Hyperglycemia and glycation lead to the production of AGEs and increase RAGE signaling, suspected to be involved in the development and spread of cancers. The expression of RAGE and AGEs appears to be proportional to malignancy and metastatic potential of cancers. The activation of this AGE-RAGE signaling pathway has been suggested as a biomarker in the prediction of cancer predisposition.22 This AGEs/RAGE interaction may be reflected by SAF.23
Chronic hyperglycemia and cancer
The high risk of cancer in subjects with type 2 diabetes is not shared by their siblings and spouses, which suggests that it relates to the disease by itself, rather than to genetic or environmental factors.24 Our new cancer cases did not occur in persons with higher diabetes duration, higher HbA1c, nor more diabetic vascular complications. More cancer cases occurred in the standard versus intensive treatment arms of trials of glucose control: 380 vs 357 in the randomized controlled trials (RCTs) including participants with type 2 diabetes,25 14 vs 7 in the Diabetes Control and Complications Trial (DCCT)/Epidemiology of Diabetes Interventions and Complications study for type 1 diabetes,26 but these differences were not significant. In the Swedish registry of type 2 diabetes, cancer was the second cause of death after cardiovascular causes, and death of any cause was more frequent with high HbA1c, but the relation between HbA1c and cancer was not reported.27 In the Swedish twin study, diabetes in mid-life was associated to later cancers of the pharynx, small intestine and liver, with a dose-dependent relation to diabetes duration.28 The relation between SAF and diabetes duration was significant in our population, but not with the HbA1c. Chronic hyperglycemia may therefore not be the sole explanation for the higher SAF in our participants with type 2 diabetes who developed a cancer.
Other mechanisms relating SAF and cancer
The accumulation of AGEs can result from high input from exogenous sources. Although dietary AGEs exert biological effects,29 we are not aware of any report relating them to cancer. The SAF is reduced in subjects who eat a Mediterranean diet,30 which may reduce the risk of cancer.31 AGEs are present in tobacco, and smoking relates to a high SAF,32 as we found. The relation between SAF and cancer was however adjusted for smoking in our participants. The accumulation of AGEs in tissues may also be due to their reduced removal, as proposed for chronic kidney diseases (CKD). The SAF was negatively related to the estimated GFR in our subjects, as previously reported,33 and it is known to be higher in CKD, even non-diabetic.34 Diabetic kidney disease is not thought to increase the risk of cancer35 but relations with estimated GFR and proteinuria have been reported outside diabetic context.36 The relation between the SAF and cancer persisted after adjustment for renal parameters in our subjects. The more specific removal of AGEs occurs through enzymatic degradation by the glyoxalase, the upregulation of this enzyme is hypothesized as a repair response to the high AGE precursor levels.37 Some variants of the RAGE gene have been related to s-RAGE levels and cancer susceptibility.20 A fast acetylator genotype has been related to a lower skin fluorescence in two cohorts (DCCT and LifeLines cohort study).38 We can therefore speculate that the accumulation of AGEs driven from chronic hyperglycemia may differ according to the genetic background, with an increased risk of cancer when this accumulation prolongs with age and diabetes duration. SAF can increase with age.39 40 In our study, the SAF was related to the age by multivariate regression analysis. However, the relation between new cancers and a high SAF remained significant after adjustment for age. Furthermore, in our study, BMI was 32.4±6.0 kg/m² for subjects remaining free of cancer and 32.6±6.0 kg/m² for subjects with cancer, without significative difference between the two groups. Due to a relation between BMI and SAF suggested by a recent study41 and the implication of BMI in type 2 diabetes and in cancer,42 an adjustment for BMI was performed, and the relation between SAF and new cancer case remained significant after adjustment.
Practical implications
The relation with the SAF suggests routes for the prevention of cancer in persons with diabetes, with possible practical implications. As it increases with age, it does not seem possible to reduce the SAF that measures AGE cross-linking in the skin, but we can aim to slow down its progression, and to reduce the circulating levels of AGEs. Glucose control may help, as relations between the SAF and the HbA1c have been reported,15 mainly for HbA1c from previous years.13 14 However, in type 2 diabetes, the progression of SAF weakly relates to the HbA1c,43 and intensively treated participants with type 2 diabetes did not reduce their mortality from cancer during RCTs.25 It would be interesting to know whether a change in the incidence of cancer appeared in the post-trial periods, as reported for mortality.44 In persons with type 1 diabetes, we have reported that the progression of SAF was more pronounced if diabetic nephropathy was present, and less pronounced under treatment with continuous subcutaneous insulin infusion, which suggests that reducing glucose variability may help.45 Nephroprotection can be another track, if the high autofluorescence in CKD predicts cancer, which remains to be determined. We have reported that SAF quickly increases during an acute renal failure.46 Acute kidney injuries predict major cardiovascular events in type 2 diabetes,47 but we do not know whether they may predict cancer. Smoking cessation and a healthy diet are probably useful. Because the measurement of SAF is simple, non-invasive, quick and cheap, it may help to select subjects for early cancer screening as far as possible for some localizations: colon, liver, skin.3
Limitations
SAF is not a direct measurement of AGE and it may be influenced by other fluorophores in the skin; nevertheless, SAF does correlate with pentosidine, a common AGE, in skin biopsies. Our population only included subjects with type 2 diabetes, and further work will be required to search whether our data may apply to the general cancer population. Our record of new cancer cases was limited to those that were registered in the medical files of our institution. We registered only one breast cancer, and it seems probable that some women developed a breast cancer, were treated in another hospital and lost of our sight. The incidence of cancer was however high in our subjects: 22/1000 person-years, in the high range of previous reports: 7–28/1000 person-years,25 so we probably did not miss many cases. We do not have reliable information about metformin use among our participants, whereas it may reduce cancer risk in type 2 diabetes.48 Metformin may block early glycation reaction and alter the AGE-RAGE axis.49 However, the SAF does not seem to differ in patients treated compared with not treated by metformin.50 Although the SAFs were higher among the 12 women who developed a cancer, they did not significantly differ from the other 162 women. Further work will however be required if we want to determine whether the relation with autofluorescence differs according to gender, and to the localization of cancer, which also needs more cases.
Conclusion
In summary, our study shows that a high SAF predicts 2.5-fold more new cancers during the years after its measurement in subjects with type 2 diabetes. This argues for the role of accumulated AGEs in tissues, and glucose memory, in the increased risk of cancer in type 2 diabetes, which should not be solely attributed to obesity and hyperinsulinemia. Lifestyle changes (healthy diet, smoking cessation), nephroprotection and glucose control may help reduce the accumulation of AGEs and the risk of cancer. The simple and non-invasive measurement of the SAF may help select subjects in cancer screening programs.
References
Footnotes
Contributors NF is the corresponding author, researched the data and wrote the manuscript. AL, MR, MM, MLe, ACD, CD, MLi and QB researched the data and reviewed the manuscript. KM, LBB and PP reviewed the manuscript. VR researched the data and wrote the manuscript.
Funding The authors have not declared a specific grant for this research from any funding agency in the public, commercial or not-for-profit sectors.
Competing interests None declared.
Patient consent for publication Not required.
Ethics approval All the participants gave an informed consent to participate in the study, which was approved by the Comité de Protection des Personnes Sud-Ouest et Outre-Mer III (DC 2014/102).
Provenance and peer review Not commissioned; externally peer reviewed.
Data availability statement Data are available upon reasonable request. All data relevant to the study are included in the article. Deidentified participant data of patients of the Diabetology Unit, Hospital Bordeaux, France. VR (0000-0002-5175-6479 ORCID) is the guarantor of the work.