Article Text

Abstract
Introduction The geographical distribution of hypoglycemic events requiring emergency assistance was explored in Andalusia (Spain), and potentially associated societal factors were determined.
Research design and methods This was a database analysis of hypoglycemia requiring prehospital emergency assistance from the Public Company for Health Emergencies (Empresa Pública de Emergencias Sanitarias (EPES)) in Andalusia during 2012, which served 8 393 159 people. Databases of the National Statistics Institute, Basic Spatial Data of Andalusia and System of Multiterritorial Information of Andalusia were used to retrieve spatial data and population characteristics. Geographic Information System software (QGIS and GeoDA) was used for analysis and linkage across databases. Spatial analyses of geographical location influence in hypoglycemic events were assessed using Moran’s I statistics, and linear regressions were used to determine their association with population characteristics.
Results The EPES attended 1 137 738 calls requesting medical assistance, with a mean hypoglycemia incidence of 95.0±61.6 cases per 100 000 inhabitants. There were significant differences in hypoglycemia incidence between basic healthcare zones attributable to their geographical location in the overall population (Moran’s I index 0.122, z-score 7.870, p=0.001), women (Moran’s I index 0.088, z-score 6.285, p=0.001), men (Moran’s I index 0.076, z-score 4.914, p=0.001) and aged >64 years (Moran’s I index 0.147, z-score 9.753, p=0.001). Hypoglycemia incidence was higher within unemployed individuals (β=0.003, p=0.001) and unemployed women (β=0.005, p=0.001), while lower within individuals aged <16 years (β=−0.004, p=0.040), higher academic level (secondary studies) (β=−0.003, p=0.004) and women with secondary studies (β=−0.005, p<0.001). In subjects aged >64 years, lower rate of hypoglycemia was associated with more single-person homes (β=−0.008, p=0.022) and sports facilities (β=−0.342, p=0.012).
Conclusions This analysis supports the geographical distribution of hypoglycemia in the overall population, both genders and subjects aged >64 years, which was affected by societal factors such as unemployment, literacy/education, housing and sports facilities. These data can be useful to design specific prevention programs.
- hypoglycemia
- epidemiology
This is an open access article distributed in accordance with the Creative Commons Attribution Non Commercial (CC BY-NC 4.0) license, which permits others to distribute, remix, adapt, build upon this work non-commercially, and license their derivative works on different terms, provided the original work is properly cited, appropriate credit is given, any changes made indicated, and the use is non-commercial. See: http://creativecommons.org/licenses/by-nc/4.0/.
Statistics from Altmetric.com
Significance of this study
What is already known about this subject?
Hypoglycemic events are serious acute diabetes complications that often require emergency department visits and hospital admissions.
Our previous assessment of out-of-hospital emergency care due to hypoglycemic episodes experienced by a large population dwelling in Andalusia (Spain) revealed their high resource utilization and costs for the Spanish healthcare system.
What are the new findings?
Spatial analyses showed significant differences in the incidence of hypoglycemic events requiring emergency assistance between the basic healthcare zones of Andalusia in the overall population, women, men and subjects aged >64 years.
Linear regression analyses showed that hypoglycemia was higher within unemployed individuals, while lower within those aged <16 years and higher academic level. In subjects aged >64 years, hypoglycemia was less detected in those living in single-person homes.
These analyses support that distribution of hypoglycemia is affected by societal factors such as unemployment, literacy/education and housing.
How might these results change the focus of research or clinical practice?
Spatial analyses using Geographic Information System software are useful to characterize health outcomes in prevalent diseases such diabetes mellitus.
This information can be useful to design specific healthcare programs to prevent hypoglycemic events according to their geographical distribution and societal characteristics.
Introduction
Diabetes is a lifelong disease that has become a global concern worldwide due to its increasing prevalence and a wide range of potential complications that may impact both patient daily living and national healthcare systems.1 The occurrence of hypoglycemic events is one of the most serious acute complications in patients with diabetes, which may entail sequelae and fatal consequences if the glycemic state is not controlled.2 These episodes often require emergency department visits and hospital admissions,3 4 especially when patients are elderly.3 5 Insulin-related hypoglycemia was responsible for nearly 100 000 visits per year to US emergency departments.3 In Spain, a self-reported survey in patients with diabetes showed that 30% of responders with severe hypoglycemia required emergency hospital care and 19% hospital admission.6 Our previous assessments of out-of-hospital emergency care due to hypoglycemia also supported high resource utilization and costs for the Spanish healthcare system.7 Indeed, it showed that hypoglycemic episodes experienced by a large Spanish population dwelling in Andalusia (Spain) were common emergencies requiring in situ emergency care, transfer and hospital care for less than 24 hours that accounted for an annual cost of over €6 000 000.
As diabetes management mainly lies in outpatient care, complications derived from the uncontrolled disease may also depend on factors outside the hospital setting.4 These may include cultural and socioeconomic barriers that affect healthcare delivery, such as low literacy, social support or communication with healthcare providers.8 Geographical distribution of diabetes complications may, therefore, contribute to clarify the existence of patterns that may be affected by societal peculiarities. In fact, spatial analyses have been widely used to explore the influence of location and its potentially associated factors in the occurrence of events in health science.9 In the diabetes field, several methods have been used to assess the geographical variation of disease prevalence, distance to the primary care provider, patient–endocrinologist ratio, glycemic control or other clinical outcomes.10–13 From these assessments, it emerged that sociodemographic factors such as population-dense areas, poor environmental quality, population aging, more deprived places, low socioeconomic status and low neighborhood education were associated with a higher prevalence of diabetes.10–13 The neighborhood socioeconomic status was also associated with glycemic control,10 and prophylactic measures to reduce weight, eliminate detrimental habits and normalize metabolism or arterial pressure decreased diabetes complications.10
In light of the above, we used spatial analyses to explore the geographical distribution of hypoglycemic events in a large population from Spain, as well as determining societal factors that may be associated with their occurrence.
Methods
Study design
The Emergency Assistance of the Person with Diabetes Project (Proyecto de Atención Urgente Extrahospitalaria del Paciente Diabético) carried out in Andalusia (Spain) comprised a data collection from the Andalusian Public Company for Health Emergencies (Empresa Pública de Emergencias Sanitarias (EPES)) database on all registered calls requesting emergency assistance due to hypoglycemia from 1 January 2012 to 31 December 2012.7 This retrospective study brought together the hypoglycemia incidence data obtained from each basic healthcare zone, geographical location and local societal factors. The requirement for informed consent was waived based on the study nature.7 All authors had access to the database population used to create the study population.
Data sources and measures
EPES database
The EPES provide comprehensive care for emergencies and accidents in the prehospital setting within the whole Andalusian region (Spain),14 which included an overall population of 8 393 159 inhabitants in 2012.15 As cases attended by other Andalusian emergency healthcare providers with a final diagnosis of hypoglycemia must be reported to EPES, its database contained information on all calls requesting emergency assistance due to hypoglycemic episodes. It included unique identifiers for tracking specific individuals and additional details such as their gender and location of residence. With regard to their location, only their basic healthcare zones could be accessed due to personal data protection regulations. These basic healthcare zones were used to link the information contained in the different databases considered in the analysis (online supplemental figure 1).
Supplemental material
The diagnosis of hypoglycemic events was based on the criteria proposed by the American Diabetes Association,2 when blood glucose levels were <70 mg/dL (3.9 mmol/L).7 These episodes were coded using the ninth edition of the International Classification of Diseases-Clinical Modification,16 which included the following codes: 249.3, 250.3, 249.8, and 250.8.
Basic spatial data of Andalusia
The Basic Spatial Data of Andalusia (Datos Espaciales de Referencia de Andalucía) is a set of geographical databases of the whole Andalusian region that enable spatial analyses to be conducted.17 It provided data on administrative divisions (eg, basic healthcare zones) and geographical information (eg, surface and geometry) that were used for Geographic Information System (GIS) analysis in this study. Basic healthcare zones are the territorial units for the effective provision of primary healthcare services in Andalusia and may include one or more primary care centers.
Spanish National Statistics Institute
The National Statistics Institute provides a wealth of official statistics on its webpage, including overall data for Spain and for the different Spanish regions. It was used to obtain data on the population and housing census of Andalusia registered as of 1 November 2011.18 These data were used to calculate the population, gender distribution, age, literacy/education level, single-person homes, dependence index (ie, proportion of dependent population: aged <18 and >65 years with respect to aged 18–64 years), foreign population and marital status in each basic healthcare zone. The incidence of hypoglycemic events was calculated taking into account the cases described in the EPES database and the overall population of the basic healthcare zone obtained from the population and housing census of Andalusia.
System of Multiterritorial Information of Andalusia
The System of Multiterritorial Information of Andalusia (Sistema de Información Multiterritorial de Andalucía) is a database of the Institute of Statistics and Cartography of Andalusia (Instituto de Estadística y Cartografía de Andalucía) that offers multithematic and multiterritorial statistical information.19 We used this database to identify information on homes with pending payments, annual net income, unemployed individuals, pharmacies, sports facilities and deceases from endocrine, nutritional or metabolic diseases in all basic healthcare zones throughout 2012.
Statistical analyses
Spatial autocorrelation
In this work, spatial autocorrelation measurements have been made for local identification of clusters on the chosen data and scale. Local study metrics of spatial clusters on variables associated with geographic locations (formatted as spatial data) used by GIS assume that all observations and their spatial dimension influence and relate to each other, but those closest to each other do so more intensely than those who are more distant.20 By establishing a priori geographical relationships of proximity between statistical observations, the finding of the degree to which this statement is true is usually addressed by the application of spatial autocorrelation, which is defined as the measure to which we can reject the null hypothesis that the spatial distribution of a variable is completely random. The statistics used in this study are local Moran’s I. This metric compares each observation of the universe with all of its ‘next’ observations to indicate the degree to which, statistically, the values of a particular variable seem to be grouped locally. This measurement (in its local version) returns, for each observation, z-values that establish the degree to which high or low values relate to their neighborhood and p values describing their significance, the degree to which the null hypothesis of complete spatial randomness can be rejected. The combination of both continuous variables generates, for each observation, a discrete variable of qualitative type, indicating the cluster class to which it belongs. Then, the geospatial study provided the following main data: local Moran’s I index, z-score, p value and cluster types.21 For this study, the basic healthcare zones are the territorial units to compare its hypoglycemic events incidence (cases per 100 000 inhabitants) using clusters (contiguous pairs) of them by proximity and calculating randomness at each cluster. The clustering types included statistically significant clusters of high values surrounded by high values (high–high) or low values surrounded by low values (low–low), clusters of high values surrounded by low values (high–low), clusters of low values surrounded by high values (low–high) and non-significant clusters.
Association of sociodemographic factors
Linear regression analyses were performed to assess the association of sociodemographic factors with hypoglycemic events, including hypoglycemia incidence as the dependent variable and the following factors as independent variables: age; individuals aged <16, 16–64 and >64 years; women and men; illiterates, individuals without studies and with primary, secondary or tertiary studies; single-person homes and homes with pending payments; dependence index; net income per inhabitant; married, unemployed and foreign individuals; deceases from endocrine, nutritional or metabolic diseases; pharmacies and sports facilities per 100 000 inhabitants; and inhabitants per hectare.
Statistical approach
The analyses were conducted in the overall population and according to gender and the following age ranges: <16 years, 16–64 years and >64 years. In addition, hypoglycemia incidence was compared among these subgroups using Mann-Whitney tests. A significance level of 0.001 was used for Moran’s I statistics and 0.05 for multivariate regressions and subgroup comparisons. Missing data were not considered in the analyses, which were performed using the GIS software (QGIS and GeoDA22) and the Statistical Package for the Social Sciences V.22.
Results
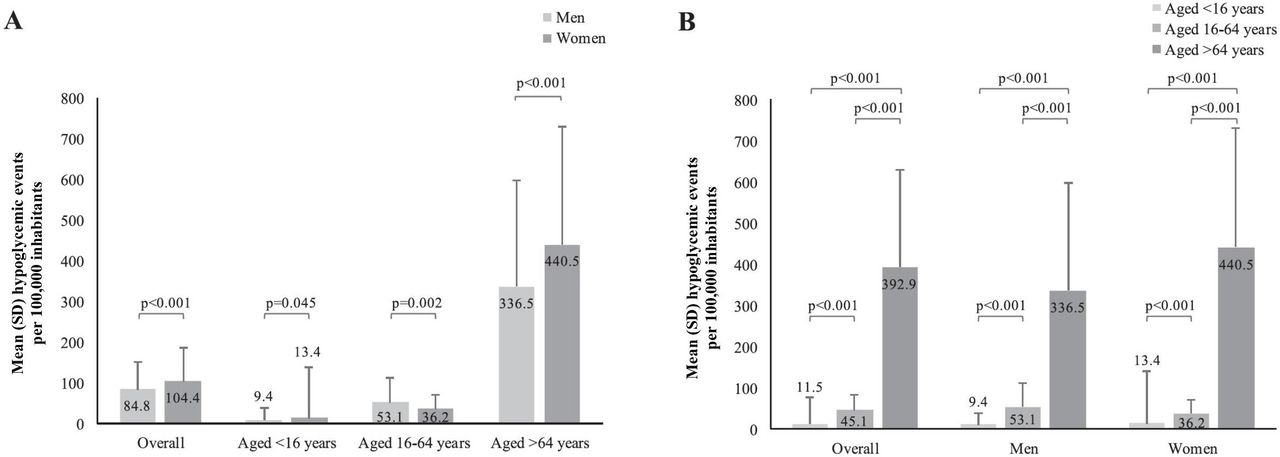
The EPES emergency coordination centers attended 1 137 738 calls requesting medical assistance during 2012, 8683 (0.8%) of which were due to hypoglycemia.7 The population characteristics in the 216 basic healthcare zones of Andalusia are described in table 1. The calculated mean (±SD) incidence of hypoglycemic events in the overall Andalusian population was 95.0±61.6 cases per 100 000 inhabitants (table 1). Comparisons according to gender showed that hypoglycemia incidence was higher in women than in men, overall and according to age groups except for 16–64 years (figure 1A and online supplemental table 1). Comparisons according to age ranges showed that hypoglycemia incidence increased with age, reaching its highest value when age was >64 years (figure 1B and online supplemental table 2).
Supplemental material
Supplemental material
Overall characteristics of the Andalusian population (N=216)*

Comparison of hypoglycemic events per 100 000 inhabitants according to gender (A) and age ranges (B).
Geographical distribution
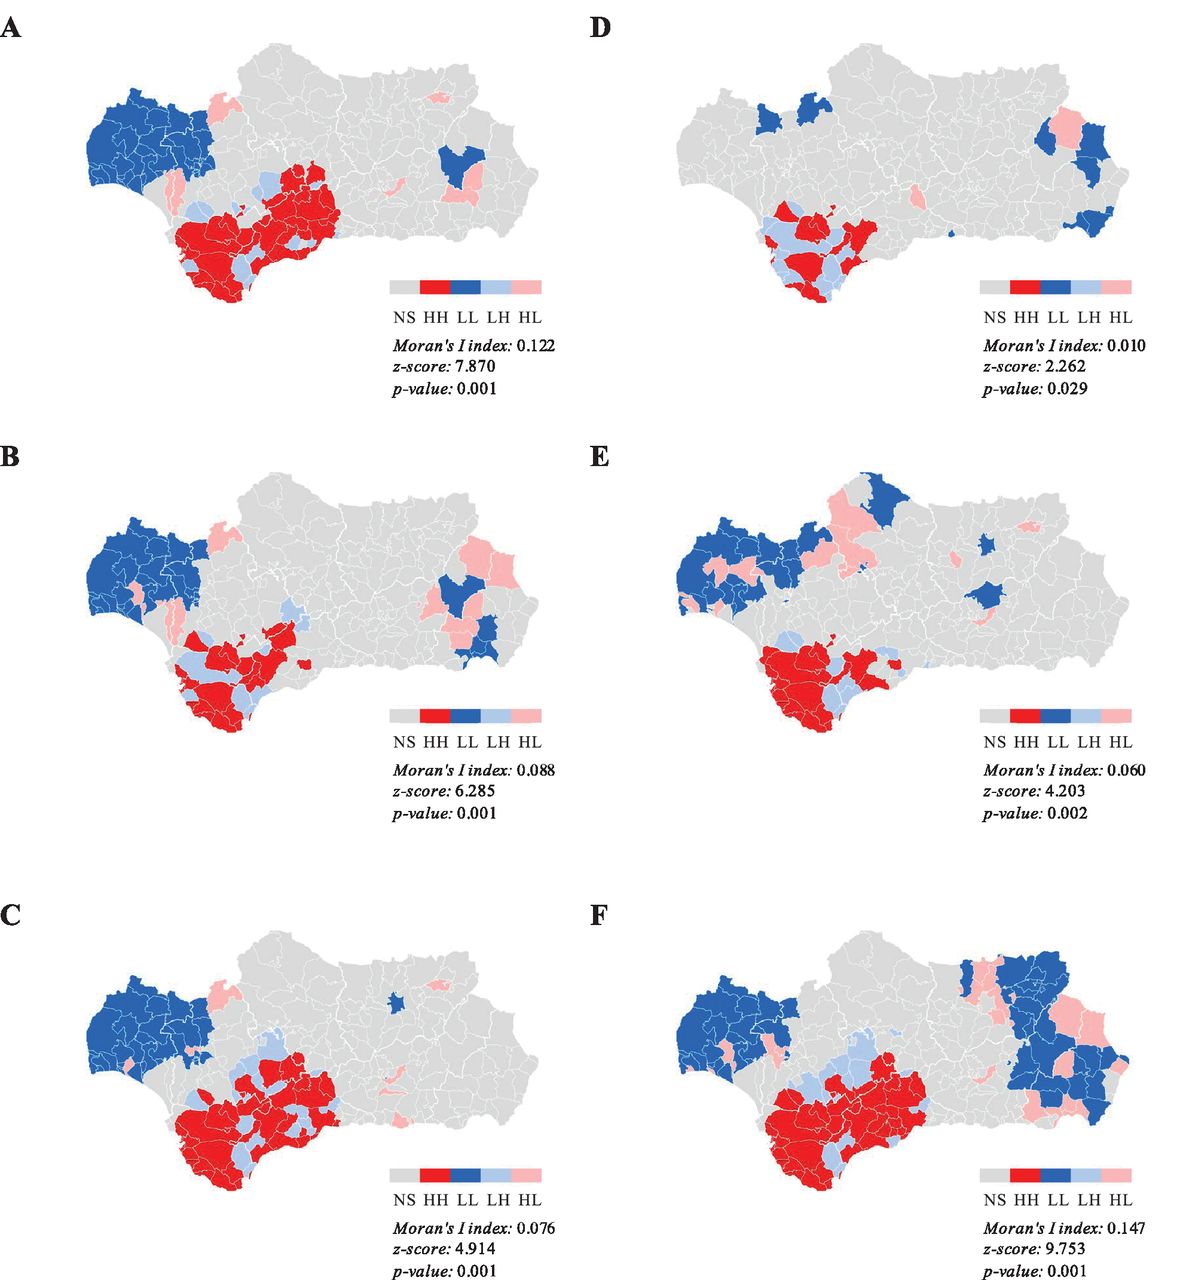
The geographical distribution of hypoglycemic events in the different basic healthcare zones of Andalusia is depicted in figure 2. Spatial analyses showed that there were significant differences in hypoglycemia incidence between basic healthcare zones attributable to their geographical location (significant spatial autocorrelation) (Moran’s I index 0.122, z-score 7.870, p=0.001), with one cluster of high values (high–high) and two clusters of low values (low–low) (figure 2A).

Geographical distribution of hypoglycemic events per 100 000 inhabitants in the overall population (A), women (B), men (C), aged <16 years (D), aged 16–64 years (E) and aged >64 years (F). HH, high–high cluster; HL, high–low cluster; LH, low–high cluster; LL, low–low cluster; NS, non-significant.
This spatial autocorrelation was also observed when the analyses were conducted in women (Moran’s I index 0.088, z-score 6.285, p=0.001; figure 2B) and men (Moran’s I index 0.076, z-score 4.914, p=0.001; figure 2C). In these cases, up to two clusters with high values (high–high) and three clusters with low values (low–low) were identified, some of which partly coincided (figure 2B and C).
When the analyses were conducted according to age groups, the correlation was found in the age group >64 years (Moran’s I index 0.147, z-score 9.753, p=0.001), with one cluster of high values (high–high) and three clusters of low values (low–low) (figure 2F). No significant spatial patterns were observed in age groups <16 years (Moran’s I index 0.010, z-score 2.262, p=0.029; figure 2D) and 16–64 years (Moran’s I index 0.060, z-score 4.203, p=0.002; figure 2E).
Additional data on spatial distribution of sociodemographic population characteristics are provided in online supplemental figures 2−13.
Supplemental material
Supplemental material
Supplemental material
Supplemental material
Supplemental material
Supplemental material
Supplemental material
Supplemental material
Supplemental material
Supplemental material
Supplemental material
Supplemental material
Linear regression analyses
Linear regression analyses showed that hypoglycemia incidence was directly associated with the number of unemployed individuals (β=0.003, p=0.001) and inversely associated with the number of individuals aged <16 years (β=−0.004, p=0.040) and those with secondary studies (β=−0.003, p=0.004) (table 2).
Sociodemographic factors associated with hypoglycemia incidence in linear regression analyses
Similarly, hypoglycemia incidence was directly associated with the number of unemployed women (β=0.005, p=0.001) and inversely associated with the number of women with secondary studies (β=−0.005, p<0.001), though no association was found in men (table 2).
With regard to age, hypoglycemia incidence was directly associated with the number of unemployed (β=0.002, p=0.039) and foreign individuals (β=0.002, p<0.001) and inversely associated with the number of single-person homes (β=−0.004, p=0.001) and homes with pending payments (β=−0.002, p<0.001) in subjects aged <16 years (table 2). Hypoglycemia incidence was also directly associated with the number of unemployed individuals (β=0.002, p=0.001) and those without studies (β=0.002, p=0.009) in those aged 16–64 years (table 2). In subjects aged >64 years, hypoglycemia incidence was inversely associated with the number of single-person homes (β=−0.008, p=0.022) and sports facilities (β=−0.342, p=0.012) (table 2).
Discussion
Our spatial analysis of hypoglycemic events requiring prehospital emergency assistance in Andalusia performed by the Local Moran’s I statistic supported the existence of geographical patterns in the overall population, both genders and subjects aged >64 years. The maps generated considering these populations pointed at different areas according to the incidence of hypoglycemic events, unmasking up to two regions with high and up to three regions with low hypoglycemia incidence. As diabetes management mainly lies in outpatient care, the significant gathering and dispersion of hypoglycemic events may be affected by out-of-hospital factors. Indeed, socioeconomic variables such as unemployment, literacy/education, housing and sports facilities were associated with hypoglycemia incidence in our linear regression analyses.
The hypoglycemia distribution in the overall population may be driven by its higher incidence in women, especially those unemployed and with low literacy/education. Linear regression findings supported the direct association of hypoglycemia incidence with the number of unemployed individuals and its inverse association with the number of those with secondary studies in the female and overall populations. The clustering maps agreed with these findings as the cluster with high hypoglycemias partly overlapped that of high unemployment and the cluster with low hypoglycemias almost completely overlapped that with higher rates of secondary studies in both women and overall populations. However, these variables seem to be unrelated to the hypoglycemia incidence in men, despite its distinct geographical pattern, suggesting the effect of other factors or more complex interactions that are still pending clarification.
With regard to the association between the hypoglycemia incidence and the number of individuals aged <16 years in the overall population, the lower representativity of their hypoglycemic events and the type of diabetes that usually affect this age group should be noted; while adult and elderly patients are mainly affected by type 2 diabetes, young patients are mostly cases of type 1 diabetes.23 In addition, our geographical analysis revealed no significant pattern of hypoglycemic events in this subset of younger subjects, in contrast to the geographical pattern seen in those aged >64 years. Even considering that hypoglycemic events in this age range are few in the whole dataset, they are, unfortunately, very frequent in the daily life of people with type 1 diabetes due to their need for complex insulin regimens. Therefore, the influence of external factors in the occurrence of hypoglycemia events in this group could be less discriminating.
On the contrary, the distinct distribution of hypoglycemic events in the older population may be affected by societal factors, such as the number of single-person homes and sports facilities. However, the inverse association of hypoglycemia incidence and single-person homes contrasts with our expectation and merits reflection. Our previous report,7 which showed a clearly lower incidence of severe hypoglycemic episode emergency calls during the night and a peak during the first morning hours, suggests absence of detection during the night and, perhaps, another person other than the patient noticing the condition after the night. We can speculate that our finding (less severe hypoglycemic events in single-person homes) is an issue of non-detection rather than a real protective factor.
There was a partial overlap of the high-value and one of the low-value hypoglycemia clusters with a low-value and a high-value cluster of sports facilities, respectively. Although the fear of hypoglycemia can be a major barrier to physical activity,8 its relationship with the number of sports facilities remains unclarified. Complex interactions with other indirect indicators are likely involved in these associations, and further analyses are therefore needed to shed light on these issues. Indeed, the R2 coefficient values of the statistically significant associations with societal factors could be considered of mild to medium effect,24 which highlight the underlying multifactorial nature of the hypoglycemia incidence distribution.
To our knowledge, only one report has used spatial and multivariate analyses to understand the geographical clustering and socioeconomic factors associated with hypoglycemic events.25 Its findings unmasked 21 local government areas with increased risk of hypoglycemia attended by prehospital emergency medical service and also revealed the influence of area-level factors such as the proportion of overseas-born residents and access to a motor vehicle in the state of Victoria in Australia. Other studies have investigated the geographical distribution of diabetes prevalence and cardiac, neurologic, renal and lower extremity diabetic complications, revealing significant clustering in many countries worldwide.10–13 26–39 Reported data in European countries showed the influence of area deprivation, population density, educational attainment, income level and green urban areas in diabetes prevalence.10 32 Sociodemographic and environment-related variables were also associated with diabetes prevalence in some areas of the USA, Canada, New Zealand and China,11–13 27 28 33 35 38 including age, race/ethnicity, economic status, physical inactivity, active commuting, recreation facilities, unhealthy lifestyle, natural amenities, lone-parent families, vacant houses, literacy/education, smoking, unemployment and criminality. In addition, population characteristics such as elderly residents also predicted the higher rates of moderate to severe cardiac, neurologic, renal and lower extremity complications in New York City, as well as the proportion of certain races/ethnicities, insurance rates and poverty.26 Areas of increased prevalence of lower extremity complications such as diabetic foot ulceration and amputation have also been associated with local deprivation considering employment, income, crime, housing, health, education and access in Scotland.31 Although comparisons among study findings are limited by the outcome and methodologic differences, the identification of local variability using geographical analyses highlights its suitability to promote and monitor public policies for diabetes management. Furthermore, the incidence rate of severe hypoglycemia reported in our project is within the range evidenced by different studies performed using distinct reporting methods worldwide (online supplemental table 3).7 40–45
Supplemental material
Despite the crucial role of diabetes care in delaying disease-related complications, the different local context of patient groups within regions or countries also seems to unevenly affect their appearance.26 31 37 Understanding spatial variations of diabetic outcomes and their relationships with societal factors can identify high-risk areas and ground-specific programs prioritizing interventions to improve healthcare delivery to involved communities.10 11 25 26 36 37 The identification of successful clusters in obtaining proposed goals may serve as an example of actions that may be considered when promoting and delivering healthcare,13 37 though reasons for distinct healthcare needs in specific communities warrant further research to achieve optimal results.11 26 Thus, we consider that our analysis represents a suitable approach to identify hypoglycemia patterns and population peculiarities that can be used to tailor targeted interventions and improve preventive healthcare programs.
We nonetheless acknowledge certain limitations that should be considered when interpreting our findings, including the retrospective collection of information available in several databases and the inherent spatial analysis bias derived from its geometric and graphic nature. Although spatial autocorrelation techniques reduce the subjectivity of data visualization in space and spatial analysis is an appropriate method for descriptive and exploratory purposes, it cannot provide satisfactory explanations. We therefore performed linear regression analyses to provide further insight into the association of hypoglycemia with a broad range of socioeconomic factors retrieved from different databases. However, medical charts of people who called requesting assistance could not be accessed and the potential influence of other unconsidered factors such as those related to diabetes management could not be assessed. Despite the fact that it was not a nationwide study, it included all calls requesting emergency assistance from one of the largest regions in Spain with more than 8 million inhabitants. Additional studies are still needed to confirm its applicability to other regions or countries.
In conclusion, our geographical analysis revealed differences in the risk of hypoglycemic events requiring emergency assistance in the different geographic areas, which seems to be affected by age and associated with societal factors such as employment, literacy/education, housing and sports facilities. These findings warrant further research to more deeply understand spatial patterns of hypoglycemia and design-specific prevention programs according to its geographical distribution and societal characteristics.
Acknowledgments
The authors would like to thank Esther Álvarez-García, of the Scientific Advisory & Medical Writing Department at Dynamic Science S.L., for her writing assistance in the preparation of this manuscript.
References
Supplementary materials
Supplementary Data
This web only file has been produced by the BMJ Publishing Group from an electronic file supplied by the author(s) and has not been edited for content.
Footnotes
Contributors All authors have participated sufficiently in the work presented by the article to take public responsibility for the content. FG-P contributed to conception of the work presented by the article, acquisition, analysis and interpretation of data, and drafting of the article. MB was the main person responsible for Geographic Information System analysis. CA, MB and RJB contributed to the analysis and interpretation of data and revised the article for critically important content. All authors provided their final approval of the version to be published.
Funding Menarini Laboratories, S.A. supported the editorial assistance by means of an unrestricted grant. The conception and design, acquisition of data or analysis and interpretation of data were conducted thanks to the unconditional effort of all participating investigators.
Map disclaimer The depiction of boundaries on the map(s) in this article does not imply the expression of any opinion whatsoever on the part of BMJ (or any member of its group) concerning the legal status of any country, territory, jurisdiction or area or of its authorities. The map(s) are provided without any warranty of any kind, either express or implied.
Competing interests FG-P has taken part in advisory panels for Sanofi and Novo Nordisk; he has received research support from Sanofi, Novo Nordisk, Boehringer Ingelheim Pharmaceuticals and Lilly, and he has acted as a speaker for Sanofi, Novo Nordisk, Boehringer Ingelheim Pharmaceuticals, AstraZeneca Pharmaceuticals LP, Bristol-Myers Squibb Company and Lilly. CA has received research support from Sanofi, Novo Nordisk, Boehringer Ingelheim Pharmaceuticals and Lilly, and she has acted as a speaker for Sanofi, Novo Nordisk, Boehringer Ingelheim Pharmaceuticals, AstraZeneca Pharmaceuticals LP and Bristol-Myers Squibb Company.
Patient consent for publication Not required.
Ethics approval This study is embedded in the Emergency Assistance of the Person with Diabetes Project (PAUEPAD, for its initials in Spanish). Institutional review board approval was obtained through the Empresa Pública de Emergencias Sanitarias and Investigation Committee (approval number: PAUEPAD26032013), and the requirement for informed consent was waived based on the nature of the study.
Provenance and peer review Not commissioned; externally peer reviewed.
Data availability statement All data relevant to the study are included in the article or uploaded as supplemental information. Further data are available on reasonable request.
Supplemental material This content has been supplied by the author(s). It has not been vetted by BMJ Publishing Group Limited (BMJ) and may not have been peer-reviewed. Any opinions or recommendations discussed are solely those of the author(s) and are not endorsed by BMJ. BMJ disclaims all liability and responsibility arising from any reliance placed on the content. Where the content includes any translated material, BMJ does not warrant the accuracy and reliability of the translations (including but not limited to local regulations, clinical guidelines, terminology, drug names and drug dosages), and is not responsible for any error and/or omissions arising from translation and adaptation or otherwise.