Article Text

Abstract
Introduction We compared diabetes incidence in South Asians aged ≥45 years in urban India (Chennai and Delhi) and Pakistan (Karachi), two low-income and middle-income countries undergoing rapid transition, with blacks and whites in the US, a high-income country.
Research design and methods We computed age-specific, sex-specific and body mass index (BMI)-specific diabetes incidence from the prospective Center for Cardiometabolic Risk Reduction in South Asia Study (n=3136) and the Atherosclerosis Risk in Communities Study (blacks, n=3059; whites, n=9924). We assessed factors associated with incident diabetes using Cox proportional hazards regression.
Results South Asians have lower BMI and waist circumference than blacks and whites (median BMI, kg/m2: 24.9 vs 28.2 vs 26.0; median waist circumference, cm 87.5 vs 96.0 vs 95.0). South Asians were less insulin resistant than blacks and whites (age-BMI-adjusted homeostatic model assessment of insulin resistance, µIU/mL/mmol/L: 2.30 vs 3.45 vs 2.59), and more insulin deficient than blacks but not whites (age-BMI-adjusted homeostasis model assessment of β-cell dysfunction, µIU/mL/mmol/L: 103.7 vs 140.6 vs 103.9). Age-standardized diabetes incidence (cases/1000 person-years (95% CI)) in South Asian men was similar to black men and 1.6 times higher (1.37 to 1.92) than white men (26.0 (22.2 to 29.8) vs 26.2 (22.7 to 29.7) vs 16.1 (14.8 to 17.4)). In South Asian women, incidence was slightly higher than black women and 3 times (2.61 to 3.66) the rate in white women (31.9 (27.5 to 36.2) vs 28.6 (25.7 to 31.6) vs 11.3 (10.2 to 12.3)). In normal weight (BMI <25 kg/m2), diabetes incidence adjusted for age was 2.9 times higher (2.09 to 4.28) in South Asian men, and 5.3 times (3.64 to 7.54) in South Asian women than in white women.
Conclusions South Asian adults have lower BMI and are less insulin resistant than US blacks and whites, but have higher diabetes incidence than US whites, especially in subgroups without obesity. Factors other than insulin resistance (ie, insulin secretion) may play an important role in the natural history of diabetes in South Asians.
- diabetes mellitus
- type 2
- epidemiology
- ethnic groups
- India
This is an open access article distributed in accordance with the Creative Commons Attribution Non Commercial (CC BY-NC 4.0) license, which permits others to distribute, remix, adapt, build upon this work non-commercially, and license their derivative works on different terms, provided the original work is properly cited, appropriate credit is given, any changes made indicated, and the use is non-commercial. See: http://creativecommons.org/licenses/by-nc/4.0/.
Statistics from Altmetric.com
Significance of this study
What is already known about this subject?
South Asians exhibit high prevalent type 2 diabetes, even at low body mass indices (BMI).
Few longitudinal studies have compared incident diabetes in South Asians with other ethnic groups, across BMI distributions, and including measures of pathophysiology (insulin resistance, insulin secretion).
What are the new findings?
Compared with US whites, South Asians experienced higher rates of incident diabetes, especially in subgroups without obesity.
South Asians were less insulin resistant than comparable US blacks and whites.
South Asians were more insulin deficient than US blacks and whites.
How might these results change the focus of research or clinical practice?
Findings will influence screening guidelines, prevention and therapeutic regimens for South Asians with type 2 diabetes, especially people without obesity, with a focus on primarily targeting improvements in insulin secretion.
Introduction
South Asians, defined as people residing in or with origins in India, Pakistan, Bangladesh, Sri Lanka, Nepal, Bhutan and Maldives, comprise nearly 2 billion people globally (nearly 30% of the world population), and experience a high risk of developing type 2 diabetes.1–4 This phenomenon, first observed in the diaspora who migrated to higher-income countries,5–7 has become acutely evident in the past few decades with urbanization and industrialization of low-income and middle-income countries, and with the dramatic rise in diabetes prevalence within South Asia itself, particularly in cities.8–12
A number of studies comparing South Asians with other groups have reported a higher diabetes prevalence in this population after accounting for age and body mass index (BMI).2 13–15 However, data on the incidence of diabetes in South Asians living in South Asia are limited. A few studies in urban South Asia have documented high incidence of type 2 diabetes in South Asians.16 17 Studies in Canada and the USA1 18 19 have revealed a higher incidence of type 2 diabetes in South Asians, compared with Chinese, whites and blacks. However, prior studies have not had long duration or rigorous follow-up for incident diabetes and have lacked in population representativeness or in measures of insulin resistance and secretion.
Using data from the Center for Cardiometabolic Risk Reduction in South Asia Study (CARRS), we report the age-specific and BMI-specific incidence by sex for urban South Asians adults living in India and Pakistan. We compared diabetes incidence among South Asians (aged ≥45 years) (n=3136) from CARRS with blacks (n=3059) and whites (n=9924) aged 45–64 years in the USA using data from the Atherosclerosis Risk in Communities (ARIC) study.
Methods
Details of methods used in CARRS and ARIC20 21 are published elsewhere. Brief descriptions of study population, harmonized analytical samples and measurements are provided below.
Study populations and analytical samples
Center for Cardiometabolic Risk Reduction in South Asia Study
CARRS is a representative sample of adult residents living in Chennai and Delhi (India) and Karachi (Pakistan), recruited in 2010–11, and followed for assessments in 2012–13, 2013–14, 2014 and 2016–17. The first, second and fourth assessments were conducted in person and the third by telephone. As reported previously,20 CARRS used a population-based, multistage, cluster sampling design based on local administrative boundaries to recruit adult men and women to be representative of each city. At the first stage of sampling, 20 wards were randomly selected from the urban districts of each city. At the second stage of sampling, five census enumeration blocks (CEBs) were selected. At the third stage, 20 households were randomly selected. And the fourth and final stage, one age-eligible man and non-pregnant woman from each household was randomly selected using the Kish method. The participants with equal age-sex strata (20–45, 46–60, ≥60 years) were selected. The baseline data were collected on n=16 287 participants aged ≥20 years, however we analyzed only those whose age was ≥45 years at baseline in order to be comparable to ARIC (ie, excluded those <45 years, n=6853). The present analysis includes participants with baseline data collected between October 2010 and December 2011, excluding those with diabetes at baseline (n=2541) and/or those with missing diabetes status (n=70). Participants with at least one follow-up assessment by February 2017 (n=3136) were included. Median follow-up time (IQR) was 4.8 (3.8–5.1) years. Diabetes at baseline was defined as fasting plasma glucose (FPG) ≥7.00 mmol/L (126 mg/dL), hemoglobin A1c (HbA1c) ≥6.5% (48 mmol/mol) or self-reported/physician diagnosed diabetes or glucose lowering medication use. A total of 2205 participants had impaired glucose tolerance (ie, FPG ≤100–125 mg/dL or HbA1c ≤5.7%–6.5%) at baseline.
Atherosclerosis Risk in Communities
The ARIC study is an ongoing, community-based cohort of 15 792 adults recruited from four communities in the USA: Forsyth County, North Carolina; Washington County, Maryland; suburbs of Minneapolis, Minnesota and Jackson, Mississippi. The ARIC Cohort Component began in 1987, and each ARIC field center randomly selected and recruited a cohort sample of approximately 4000 individuals aged 45–64 years from a defined population in their community, to receive extensive examinations, including medical, social and demographic data. Follow-up also occurs semi-annually, by telephone, to maintain contact and to assess health status of the cohort. The first examination was done between 1987 and 1989 when participants were aged 45–64 years. For these analyses, visit 1 (1987–1989) was baseline with follow-up through visit 4 (1996–1998) (median follow-up time: 8.8 years, IQR 5.6–9.0 years). We excluded the small number of participants who reported race other than white or black (n=48), participants with prevalent diabetes defined as in CARRS above (n=1867) and those who were missing diabetes status (n=882). We also excluded those who were under the age of 45 at visit 1 (n=35). A total of 6351 participants had fasting glucose (at baseline) between 100 and 125 mg/dL or HbA1c (at visit 2) between 5.7% and 6.5%. A total of 12 983 ARIC participants were included in the analysis (n=3059 blacks and n=9924 whites).
Measurements
Sociodemographic data, anthropometry (height, weight, waist circumference), history of smoking, diabetes status, family history of diabetes and measured systolic (SBP) and diastolic (DBP) blood pressures were available in both CARRS and ARIC. For the assessment of blood pressure, in CARRS, participants were rested for 5 min, and blood pressure was measured twice using an electronic sphygmomanometer (Omron HEM-7080 and HEM-7080IT-E; Omron, Tokyo, Japan). A third measurement was taken if the difference between the first two systolic or diastolic measurements was >10 or 5 mm Hg, respectively. The mean of last two readings (ie, second and third reading) was used for analysis. In ARIC, SBP and DBP were measured three times per participant using a standardized Hawksley random-zero instrument. The mean of the second and third measurement was used.
FPG was measured by hexokinase/kinetic method in Chennai and Delhi site and by glucose oxidase/end point method in Karachi in CARRS. HbA1c was measured by high-performance liquid chromatography (HPLC) method in all three sites with reagents from Bio-Rad Laboratories, Hercules, California, USA certified by National Glycohemoglobin Standardization Program (NGSP) and traceability to Diabetes Control and Complications Trial. In ARIC, glucose was assayed by a hexokinase method in serum at visits 1 and 2 and in plasma at visits 3 and 4. Persons fasting <8 hours were excluded from baseline and follow-up. HbA1c was measured from frozen whole-blood samples collected at ARIC visit 2 only and were assayed using HPLC (Tosoh A1c 2.2 Plus Glycohemoglobin Analyzer method in 2003–2004 and Tosoh G7 method in 2007–2008, Tosoh, Tokyo, Japan) and standardized to the Diabetes Control and Complications Trial assay.22 Serum insulin was measured at visit 1 by radioimmunoassay using an Insulin Kit (Cambridge Medical Diagnosis, Billerica, Massachusetts, USA). Among CARRS, serum insulin concentration was measured using the electrochemiluminesence method (COBAS E 411; Roche Diagnostics), and validation of CARRS insulin measurements against a US reference laboratory, the Northwest Lipid Metabolism and Diabetes Research Laboratories have been reported earlier.23
In both cohorts, lipids (low-density lipoprotein-cholesterol (LDL-c), high-density lipoprotein-cholesterol (HDL-c), triglycerides) were measured in fasting serum; LDL-c was calculated using the Friedewald equation, except when triglycerides were >4.52 mmol/L (400 mg/dL). BMI was calculated as measured weight in kilograms divided by measured height in meter squared. BMI was categorized as <25; 25–29.9 and ≥30 kg/m2 (normal weight, overweight and obese). Homeostasis model assessment of insulin resistance (HOMA-IR) was calculated as=fasting insulin (µIU/L)×fasting glucose (nmol/L)/22.5 or (I0 (µIU/mL)×G0 (mmol/L)/22.5); and homeostasis model assessment of β-cell dysfunction (HOMA-B) for insulin secretion was calculated as=(20×insulin)/(glucose−3.5) or (20×I0 (µIU/mL)/G0 (mmol/L)−3.5).24
Incident diabetes
In the CARRS and ARIC cohorts, incident diabetes was defined as FPG ≥7.00 mmol/L (126 mg/dL), HbA1c ≥6.5% (48 mmol/mol) or self-reported/physician diagnosed diabetes or on medication during follow-up. Additional analyses using only the FPG criteria was also undertaken.
Statistical analysis
Baseline characteristics among South Asians, US blacks and US whites were compared. Data were presented as mean (SD), median (IQR) or percentages as appropriate. The median test was used to compare the difference in median values between South Asians versus US blacks and South Asians versus US whites. To compare the difference in proportions, χ2 test was used. Per cent incidence rates with 95% CIs were computed. Person-years were estimated from the date of enrolment to the time of diabetes diagnosis or the last date of visit or death, whichever was documented earlier. Age-specific incidence (cases/1000 person-years) by sex and ethnicity was calculated. Age-standardized diabetes incidence (per 1000 person-years) using the world age distribution by sex25 was also reported.
BMI-specific incidence (cases/1000 person-years) of diabetes, adjusted for age and stratified by sex and ethnicity, was calculated using Poisson models. The relative risk (incidence rate ratio (IRR)) and absolute risk (incidence rate difference (IRD)) comparing South Asians or US blacks minus US whites (US whites as referent group) and 95% CIs were estimated. Multivariable Cox proportional hazards models were used to assess the associations of HOMA-IR and HOMA-B with incident diabetes, separately in CARRS and ARIC. We tested for linear association of incident diabetes with age and BMI. Unlike BMI, age did not have a linear association with diabetes. Therefore, in the final adjusted model we included age and a quadratic term for age, gender, BMI, HOMA-IR (z-score) and HOMA-B (z-score). Proportionality hazards assumptions (proportionality, interaction among predictors, time dependence) were evaluated, and were satisfied.
We conducted supplementary analyses among those without self-reported diabetes and with FPG <7.00 mmol/L (126 mg/dL) at baseline, with incident diabetes defined as those with FPG ≥7.00 mmol/L (126 mg/dL), or self-reported/physician-diagnosed diabetes, or medication use at any time during follow-up. We undertook these supplementary analyses as HbA1c may vary by ethnicity.
All analyses were conducted using Stata V.16.0 (College Station, Texas, USA).
Results
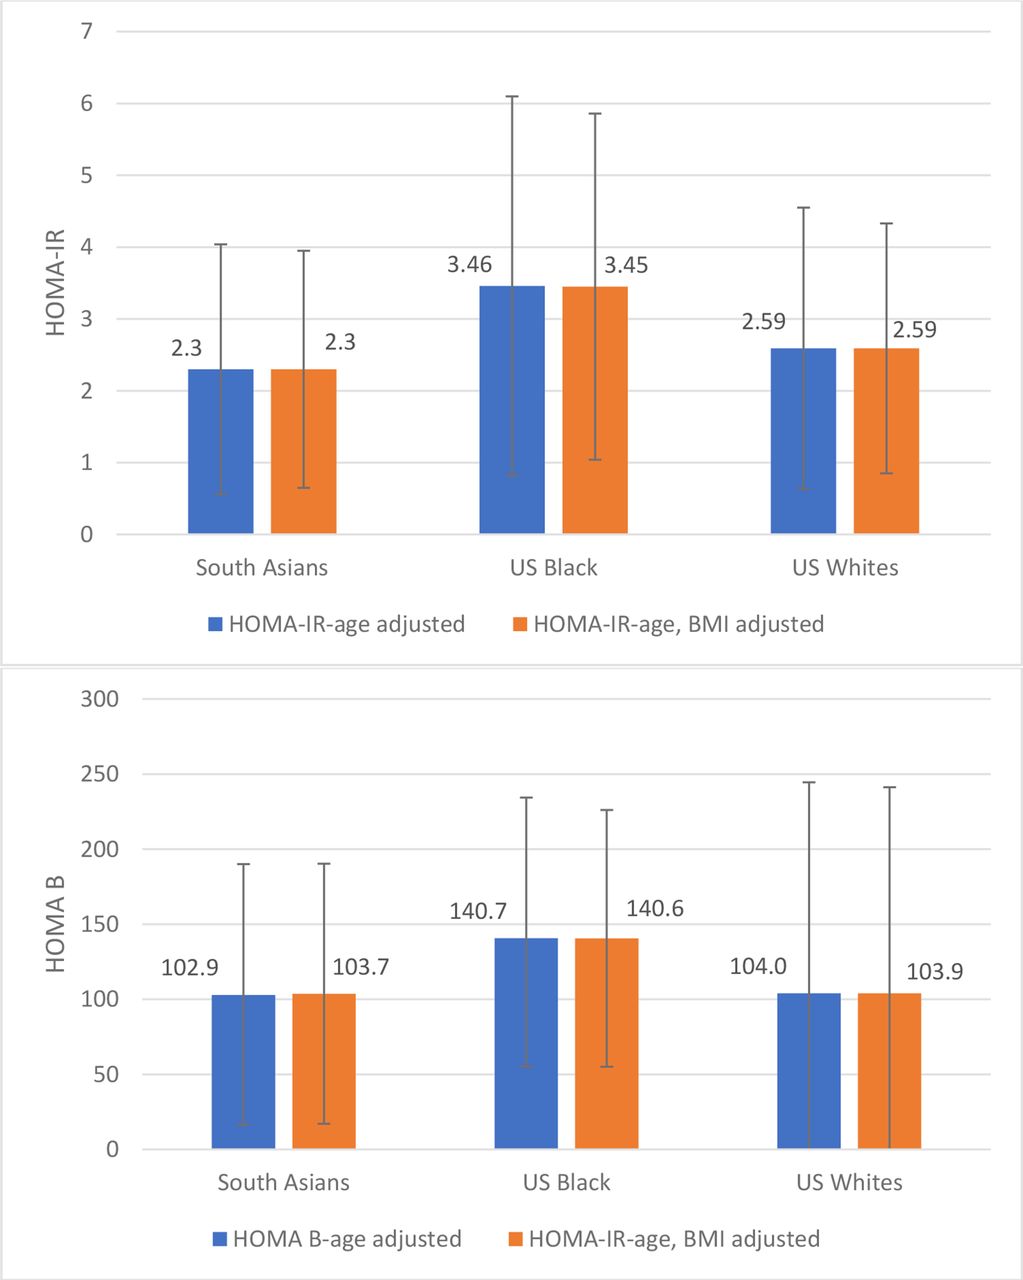
At baseline (table 1), the median age (years) of South Asians, US blacks and US whites were comparable (52.0 vs 52.0 vs 54.0). Overall, South Asians had lower median BMI and waist circumference, lower levels of HDL-c, LDL-c, higher levels of triglycerides, SBP, DBP and lower fasting insulin than blacks and whites and there was significant difference between South Asian versus blacks and South Asian versus whites (table 1). South Asians were less insulin resistant than blacks and whites (age-BMI-adjusted HOMA-IR, µIU/mL/mmol/L: 2.30 vs 3.45 vs 2.59, South Asian vs blacks p<0.001; South Asian vs whites p<0.001), South Asians were secreting less insulin than blacks but not whites (age-BMI-adjusted HOMA-B, µIU/mL/mmol/L: 103.7 vs 140.6 vs 103.9, South Asian vs blacks p<0.001, South Asian vs whites p=0.9305) (figure 1).
Characteristics of study populations without diabetes in the CARRS (2010–2011) and ARIC (1987–1989) cohorts

Mean values for HOMA-IR (µIU/mL×mmol/L) and HOMA-B (µIU/mL/mmol/L) adjusted by age and age/BMI. BMI, body mass index; HOMA-B, homeostasis model assessment of β-cell dysfunction; HOMA-IR, homeostatic model assessment of insulin resistance.
The median (IQR) duration of follow for South Asians, blacks and whites was 4.8 (3.8, 5.1); 8.6 (5.6, 8.8) and 8.9 (8.7, 9.0), respectively. Among 3136 South Asians without diabetes at baseline (52.5% men), 389 incident cases of diabetes developed during the follow-up (table 2). Among 3059 US blacks without diabetes at baseline (37.8% men), 588 incident cases of diabetes developed during the follow-up, and among 9924 US whites without diabetes (46.6% men), 1036 incident cases of diabetes developed during the follow-up.
Age-specific incidence of diabetes (cases/1000 PYR) by sex and ethnicity
Age-standardized diabetes incidence (cases/1000 person-years, 95% CI) in South Asian men was similar to US black men, but higher compared with US white men (IRR (95% CI) 26.0 (22.2 to 29.8) vs 26.2 (22.7 to 29.7) vs 16.1 (14.8 to 17.4), respectively). In women, South Asians had a slightly higher incidence of diabetes compared with US black women (IRR (95% CI) 31.9 (27.5 to 36.2) vs 28.6 (25.7 to 31.6) vs 11.3 (10.2 to 12.3), respectively). The diabetes incidence was 1.6 times higher in South Asian men (IRR (95% CI) 1.62 (1.37 to 1.92)) as compared with US white men but approximately 3 times higher in South Asian women (IRR (95% CI) 3.09 (2.61 to 3.66)) as compared with US white women. The absolute risk difference of incident diabetes (cases/1000 person years) was higher in South Asian men (IRD (95% CI 10.1 (6.1 to 14.2)) and women (IRD (95% CI) 22.4 (17.8 to 27.0)) as compared with US white men and women, respectively.
In those with BMI <25 kg/m2 (table 3), risk of diabetes in men was 3 times higher in South Asians (IRR (95% CI) 2.99 (2.09 to 4.28)) and 2.1 times higher in US blacks (IRR (95% CI) 2.11 (1.35 to 3.25)) as compared with US whites. Similarly, in women, the risk of diabetes in those with BMI <25 kg/m2 was 5.3 times higher in South Asian (IRR (95% CI) 5.27 (3.64 to 7.54)) and 2.5 times higher in US blacks (IRR (95% CI) 2.36 (1.56 to 3.78)) as compared with US whites. The absolute number of incident cases/1000 person-years was higher in South Asian men (IRD (95% CI) 12.5 (7.7 to 17.2)) and women (IRD (95% CI 17.9 (11.7 to 24.2)) as compared with US whites men and women with BMI <25 kg/m2.
BMI-specific incidence of diabetes (cases/1000 PYR) by sex and ethnicity
In those with BMI ≥30 kg/m2 (table 3), diabetes incidence in South Asian men was 1.21 (0.76, 1.84) times higher than in US white men and in South Asian women, diabetes incidence was 2.1 (1.56, 2.74) times higher than in US white women (table 3). The absolute diabetes risk was higher in South Asian women than in US white women (IRD (95% CI 17.9 (11.7 to 24.2)) with BMI >30 kg/m2.
In multivariable Cox models (table 4), associations between age, sex, BMI and family history of diabetes with diabetes risk were similar in South Asians, US whites and US blacks. Family history of diabetes was significantly associated with incident diabetes among black and white Americans but not among South Asians. For the association with diabetes, South Asians had the lowest HR for HOMA-IR (HR for 1 SD (95% CI) South Asian: 2.67 (2.05 to 3.48); blacks: 14.55 (11.11 to 19.07); whites: 34.64 (27.63 to 43.42)) and largest HR for HOMA-B (HR (95% CI) South Asian: 0.44 (0.34 to 0.58); blacks: 0.08 (0.06 to 0.11); whites: 0.05 (0.04 to 0.06)).
Factors associated with diabetes incidence by ethnicity, Cox proportional hazards analysis
Patterns of association were similar in sensitivity analyses using a more specific definition of diabetes based on FPG ≥7.00 mmol/L (126 mg/dL) or glucose-lowering medication use (online supplemental table). These additional analyses also confirmed that although HbA1c may vary by ethnicity and was not available in the ARIC cohort at the first visit, this did not impact the pattern of differences in diabetes incidence between ethnicities.
Supplemental material
Discussion
Our prospective analyses, using data from two well-established cohorts (the CARRS and ARIC studies), confirm that South Asian adults living in urban India and Pakistan are, on average, less obese than blacks and whites in the USA, yet have higher diabetes incidence than US whites. This difference was more pronounced in women compared with men, and was also more marked in those with low BMI. Contrary to the widely held view that South Asians have a high propensity to insulin resistance,5 6 26–28 our results are consistent with South Asians being less insulin resistant than US blacks or whites. These findings suggest that obesity and insulin resistance may not be the driving factors behind the high incidence of diabetes in South Asians, and impaired insulin secretion may be more important.
There are several studies indicating that South Asians have a higher prevalence of diabetes even at lower BMI compared with other race/ethnic groups.1–4 A study assessing diabetes prevalence in New York City by race/ethnicity noted that South Asians with normal BMI had nearly five times the diabetes prevalence of comparable normal weight whites, and more than double the prevalence of overweight whites.2 Similarly, a study assessing diabetes prevalence by weight category in US immigrants found that normal weight South Asians had nearly twice the diabetes prevalence of overweight European immigrants.4 Few studies have also examined the incidence rate of diabetes among South Asians compared with other race/ethnic groups by BMI category. A study comparing the incidence rates of diabetes across race/ethnic groups and BMI strata in Ontario, Canada found that the incidence rate of diabetes was 3 times higher in normal weight (BMI 18.5–25 kg/m2) South Asians than in white Canadians.1 Our study adds further evidence to the notion that South Asians are at high risk for diabetes at low BMI by indicating that in those with BMI <25 kg/m2, the risk of diabetes incidence was 3 and 5.3 times higher in South Asian men and women, respectively compared with whites. The reasons for the high risk of diabetes in South Asians is likely multifactorial, reflecting genetic, epigenetic, lifestyle factors, together with differences in pathophysiological mechanisms.
While earlier studies have noted high levels of insulin resistance in South Asians,5 6 26–28 increasing evidence suggest that South Asians have an innate susceptibility to defects in insulin secretion. Cross-sectional studies from Chennai, India, have noted that South Asians have reduced insulin secretion, even at mild levels of dysglycemia.29 In young adults, dysfunction in insulin secretion, more so than insulin resistance, appears to be closely associated with diabetes.30 As South Asian adults have impaired early phase insulin release, consistently across all weight status classes, as reflected in the first 30 min of an oral glucose tolerance test, existing evidence suggests that pathways of disease development may emphasize pathways related to deficient insulin secretion, impaired fasting glucose and possibly exacerbated by ectopic hepatic and intramyocellular fat accumulation.23 31 A study assessing the associations of insulin secretion and insulin resistance on glycemic status in South Asians living in the USA found that after accounting for visceral fat, poor insulin secretion was more strongly associated with hyperglycemia than was insulin resistance.32 In our study, we found that South Asians were less insulin resistant than both whites and blacks, and less insulin secretion than black participants. This coupled with the high incidence rates of diabetes in South Asians adds further evidence that insulin secretion may be the primary and relatively more important defect driving diabetes risk in this race/ethnic population. This has major implications for ethnicity-specific diabetes treatment guidelines.33
Our study has several limitations that should be taken into account in interpreting these results. Although both CARRS and ARIC were population-based cohorts, they were assembled at different time period using different sampling methodologies, and also CARRS was purely urban, while ARIC was largely urban and suburban. Our comparison of diabetes incidence in South Asians with blacks and whites was restricted to ages ≥45 years as the ARIC cohort only recruited people aged 45 years and over. This limits our ability to examine the differences between younger South Asians and comparably aged blacks and whites, which may be important as South Asians have high diabetes prevalence at younger ages.13 15 34 35 Indeed, at baseline in our analysis, South Asians had a higher prevalence of diabetes, and thus we may be underestimating diabetes incidence in this cohort as a smaller at-risk group was followed. However, we found that across all ages from 45 years up, South Asians had a higher diabetes incidence than whites, and this was especially marked at lower BMIs. Our analysis primarily relied on BMI as a measure of body composition, and this measure does not fully capture body fat distribution.36–38 However, additional analysis using waist circumference (online supplemental table S5) as a measure of central adiposity found similar differences between South Asians and blacks and whites in diabetes incidence across the distribution of adiposity.
To ensure comparability of end points, we used the same definition of diabetes across the two studies and relied on person-years of follow-up to standardize incidence estimates. In ARIC, HbA1c was not available at baseline; however, sensitivity analyses restricting the comparison to only self-reported diabetes or fasting blood glucose ≥7.00 mmol/L (126 mg/dL) found similar patterns of differences between the ethnic groups. A limitation was that the CARRS and ARIC cohorts were initiated at different time periods and have some differences in follow-up, but our primary measure is incidence per 1000 person-years, and the focus of our comparison is around biological variables. Furthermore, the rise in diabetes in low-income and middle-income countries, like India and Pakistan, has happened over the past two decades, and no earlier cohorts exist.
Our study also has significant strengths. Both CARRS and ARIC are well-established and well-retained cohort studies of high quality, with standardized data collection, and multiple time points of follow-up for rigorous assessment of diabetes. Our study also examined diabetes incidence across the full distribution of BMI, used rigorous capture of incident diabetes and had longitudinal follow-up. Furthermore, we included measures of insulin resistance and secretion (ie, HOMA-IR and HOMA-B), which are validated against gold standards, and are considered reasonable for population studies.39 40
In conclusion, in this study of prospective data from two longitudinal cohorts, we found that the incidence of diabetes among South Asian adults is higher than US whites, and markedly so in people without obesity. Our results are also consistent with South Asians being less insulin resistant than US blacks or whites. Factors other than obesity and insulin resistance (eg, innate insulin deficiency) may thus be important in the risk of diabetes in South Asians. Screening, prevention and treatment guidelines may need to be tailored more appropriately to address the mechanisms of disease risk in South Asians.
Acknowledgments
The authors would like to thank the staff and participants of the CARRS and ARIC study for their important contributions.
References
Supplementary materials
Supplementary Data
This web only file has been produced by the BMJ Publishing Group from an electronic file supplied by the author(s) and has not been edited for content.
Footnotes
Contributors Conceptualization: KMVN, MKA, DP, NT, VM, SAP, DK, DM, RS, RMA and ES. Data curation: DK and ND. Formal analysis: DK, ND and HHC. Writing—original draft: KMVN. Writing—review and editing: DK, SAP, UPG, LRS, DP, NT, MKA, ES, VM, ND, HHC, MK, DM, RS and RMA. All authors have read and agreed to the published version of the manuscript.
Funding The CARRS Study was funded in part by the National Heart, Lung, and Blood Institute (NHLBI), National Institutes of Health (NIH), Department of Health and Human Services, under contract no. HHSN268200900026C, and the United Health Group, Minneapolis, Minnesota, USA. KMVN, MKA, UPG and SAP were funded in part by the National Institute of Diabetes and Digestive and Kidney Diseases of the NIH under award number P30DK111024. KMVN was funded in part for “Worksite Lifestyle Program for Reducing Diabetes and Cardiovascular Risk in India” project funded by NHLBI, NIH, Department of Health and Human Services under award number R01HL125442. SAP, KMVN, MKA, NT and DP were supported in part by the NHLBI of the NIH, award number 5U01HL138635 under the Hypertension Outcomes for T4 Research within low-income and middle-income countries (Hy-TREC) program. RS was supported by a Wellcome Trust Capacity Strengthening Strategic Award Extension phase to the Public Health Foundation of India and a consortium of UK universities (WT084754/Z/08/A) and was supported by grant number 1 D43 HD065249 from the Fogarty International Center and the Eunice Kennedy Shriver National Institute of Child Health and Human Development at the NIH. DK has been supported by Fogarty International Center for PH leader Course, NIH under grant number D43TW009135. ES was supported by NIH/NHLBI grant K24 HL152440. The Atherosclerosis Risk in Communities study has been funded in whole or in part with Federal funds from the NHLBI, NIH, Department of Health and Human Services (contract numbers HHSN268201700001I, HHSN268201700002I, HHSN268201700003I, HHSN268201700004I and HHSN268201700005I).
Competing interests None declared.
Patient consent for publication Not required.
Ethics approval The CARRS surveillance study has been approved by the Institutional Review Boards (IRBs) of Public Health Foundation of India, New Delhi, All India Institute of Medical Sciences (IEC/NP-17/07.09.09), New Delhi, Madras Diabetes Research Foundation (MDRF/EC/EPI/2009/10), Chennai, India, Aga Khan University, Karachi, Pakistan and Emory University, Atlanta, USA. In addition, the study has received regulatory approval from the National Heart, Lung, and Blood Institute (NHLBI), National Institutes of Health (NIH), USA and the Health Ministry Screening Committee of India, New Delhi. Written consent was obtained from all participants.
Provenance and peer review Not commissioned; externally peer reviewed.
Data availability statement Data are available on reasonable request and please contact Dr KMVN (email id: knaraya@emory.edu).
Supplemental material This content has been supplied by the author(s). It has not been vetted by BMJ Publishing Group Limited (BMJ) and may not have been peer-reviewed. Any opinions or recommendations discussed are solely those of the author(s) and are not endorsed by BMJ. BMJ disclaims all liability and responsibility arising from any reliance placed on the content. Where the content includes any translated material, BMJ does not warrant the accuracy and reliability of the translations (including but not limited to local regulations, clinical guidelines, terminology, drug names and drug dosages), and is not responsible for any error and/or omissions arising from translation and adaptation or otherwise.