Article Text

Abstract
Introduction Although various lipid and non-lipid analytes measured by nuclear magnetic resonance (NMR) spectroscopy have been associated with type 2 diabetes, a structured comparison of the ability of NMR-derived biomarkers and standard lipids to predict individual diabetes risk has not been undertaken in larger studies nor among individuals at high risk of diabetes.
Research design and methods Cumulative discriminative utilities of various groups of biomarkers including NMR lipoproteins, related non-lipid biomarkers, standard lipids, and demographic and glycemic traits were compared for short-term (3.2 years) and long-term (15 years) diabetes development in the Diabetes Prevention Program, a multiethnic, placebo-controlled, randomized controlled trial of individuals with pre-diabetes in the USA (N=2590). Logistic regression, Cox proportional hazards model and six different hyperparameter-tuned machine learning algorithms were compared. The Matthews Correlation Coefficient (MCC) was used as the primary measure of discriminative utility.
Results Models with baseline NMR analytes and their changes did not improve the discriminative utility of simpler models including standard lipids or demographic and glycemic traits. Across all algorithms, models with baseline 2-hour glucose performed the best (max MCC=0.36). Sophisticated machine learning algorithms performed similarly to logistic regression in this study.
Conclusions NMR lipoproteins and related non-lipid biomarkers were associated but did not augment discrimination of diabetes risk beyond traditional diabetes risk factors except for 2-hour glucose. Machine learning algorithms provided no meaningful improvement for discrimination compared with logistic regression, which suggests a lack of influential latent interactions among the analytes assessed in this study.
Trial registration number Diabetes Prevention Program: NCT00004992; Diabetes Prevention Program Outcomes Study: NCT00038727.
- lipoproteins
- prediabetic state
- diabetes mellitus
- type 2
- lipids
Data availability statement
Data may be obtained from a third party and are not publicly available. In accordance with the NIH Public Access Policy, we continue to provide all manuscripts to PubMed Central including this manuscript. DPP/DPPOS has provided the protocols and lifestyle and medication intervention manuals to the public through its public website (https://www.dppos.org). The DPPOS abides by the NIDDK data sharing policy and implementation guidance as required by the NIH/NIDDK (https://www.niddkrepository.org/studies/dppos/).
This is an open access article distributed in accordance with the Creative Commons Attribution Non Commercial (CC BY-NC 4.0) license, which permits others to distribute, remix, adapt, build upon this work non-commercially, and license their derivative works on different terms, provided the original work is properly cited, appropriate credit is given, any changes made indicated, and the use is non-commercial. See: http://creativecommons.org/licenses/by-nc/4.0/.
Statistics from Altmetric.com
Significance of this study
What is already known about this subject?
A large number of lipid and lipoprotein biomarkers demonstrate robust associations with type 2 diabetes, and certain lipid biomarkers such as triglycerides and high-density lipoprotein cholesterol are components of established clinical type 2 diabetes risk prediction models.
High-throughput, large-scale, low-cost assessments of previously unconsidered biomarkers, such as full nuclear magnetic resonance (NMR)-derived biomarker panels, are becoming commonplace.
What are the new findings?
Lipoproteins and other NMR-derived analytes do not offer clinically meaningful improvement in the prediction of type 2 diabetes compared with standard laboratory lipids or a minimal model that comprised age, sex, ethnicity and fasting glucose in a population of individuals with pre-diabetes.
Association is not prediction: while numerous biomarkers demonstrate robust statistical associations with type 2 diabetes, their cumulative discriminative utility can be low.
Baseline postprandial 2-hour glucose levels offer a meaningful improvement in discriminating future diabetes when compared with simpler models including fasting glucose.
How might these results change the focus of research or clinical practice?
Future studies should evaluate NMR-derived analytes and biomarkers from other ‘omics’ profiles with regard to their discriminatory utilities for type 2 diabetes in diverse, prospective, general population cohorts using statistically appropriate predictive models.
Introduction
Lipid and lipoprotein abnormalities are well-established risk factors for type 2 diabetes.1 Elevated triglyceride and reduced high-density lipoprotein cholesterol (HDL-C) levels have been shown to associate with incident diabetes after adjustment of other standard diabetes risk factors,2–4 and triglyceride values >250 mg/dL and HDL-C <35 mg/dL have been recommended by the American Diabetes Association as screening criteria for pre-diabetes and diabetes5 and are routinely used in diabetes risk scores.4 Furthermore, alterations in lipoprotein size and concentration such as those characterized by nuclear magnetic resonance (NMR) have been found to associate with incident diabetes6–10 and have been shown to identify insulin resistance-based dyslipoproteinemia early in the course of diabetes development.6 7 In most studies to date, these associations remained statistically significant after adjusting for standard lipid measurements.6–9
While alterations in lipids and lipoproteins demonstrate reproducible, robust statistical associations with type 2 diabetes, it is unknown whether standard lipid measurements have predictive utility (good classification of future cases) for diabetes incidence and whether lipoproteins improve prediction over standard lipids or standard diabetes risk factors.11 This is especially pertinent in subjects at high risk of developing diabetes, such as those with pre-diabetes, where improved individualized prediction12 might allow more targeted implementation of prevention strategies. The statistical methods underlying evaluation of risk factor association differ from those used for assessing outcome prediction. Specifically, to properly assess whether a biomarker can classify an individual correctly according to whether they eventually develop a disease or not requires specific statistical testing pertaining to outcome prediction and discriminative utility13 14 using measures such as the receiver operating characteristic area under the curve (ROC AUC) and other metrics.
We leveraged data from the Diabetes Prevention Program (DPP) and the Diabetes Prevention Program Outcomes Study (DPPOS) to evaluate the predictive utility of standard lipid measurements as well as NMR-measured lipoprotein size and concentration for incident diabetes. The DPP was a randomized clinical trial that tested the effect of lifestyle and metformin interventions compared with placebo in preventing diabetes in a large cohort with pre-diabetes who were at high risk of diabetes development.15 We evaluated whether lipid measures added predictive utility to standard glycemic, anthropometric and other established risk factors in the three intervention groups. Since these interventions have significant effects on metabolic markers,16 we included in the analysis both baseline measures and their changes 1 year after randomization, and we tested whether these factors predicted incident diabetes differently in participants who progressed relatively rapidly compared with those who progressed more slowly. In addition, because the NMR method has been extended to include several novel non-lipid biomarkers that have been shown to associate with diabetes,17 these were tested as well. Lastly, based on the assumption that state-of-the-art machine learning algorithms might have advantages over logistic regression models when latent interactions exist in the data matrix,18 we examined whether there were differences in discriminative utilities using a range of standard statistical and machine learning algorithms. All models were internally validated using a robust, nested cross-validation framework.
Materials and methods
Participants
The DPP was a multiethnic, multicenter, randomized controlled trial (RCT) located in the USA. Initially, 3234 individuals with fasting glucose levels 95–125 mg/dL and impaired glucose tolerance who were overweight or obese were randomized into four arms: intensive lifestyle intervention, metformin, troglitazone and placebo control.15 19 The troglitazone arm was subsequently terminated due to side effects. Individuals in the metformin arm received 850 mg metformin two times per day, and those in the lifestyle arm received individual and group-based counseling and were encouraged to maintain a moderate level of physical activity and reduce their dietary fat consumption.15 The placebo arm received general advice on healthy lifestyle habits. The primary endpoint of the DPP was type 2 diabetes incidence, assessed semiannually by a fasting glucose test and annually by an oral glucose tolerance test, and the RCT was terminated at 3.2 years.20 The DPPOS was established as a continuation of the DPP. By maintaining the three original intervention groups, the main aim of the DPPOS was to investigate whether the treatment effects on diabetes would translate into long-lasting health effects.21 After removing individuals who were initially randomized to the troglitazone arm and those with no NMR analytes measured, the total sample size for this study was 2590 at baseline. All participants provided written, informed consent.
Standard laboratory and NMR methods
Information on basic and clinical variables in the DPP has been reported elsewhere.19 22 In brief, anthropometric measures, blood pressure and clinical data were collected using standard methods. Measures of insulin, glycemia and standard lipids were obtained at the Central Biochemistry Laboratory (Northwest Lipid Research Laboratories, University of Washington, Seattle, Washington).16 The reciprocal of the fasting insulin level (1/FI or IFI) was used as a marker of insulin resistance, and the insulinogenic index (Δ-insulin (30–0 min)/Δ-glucose (30–0 min)) was used as a marker of insulin secretion. The insulinogenic index was determined during an oral glucose tolerance test.23 Lipoprotein subclass concentrations and lipoprotein sizes at randomization (the beginning of the DPP) and 1 year after randomization were quantified by NMR spectroscopy at LipoScience using fasting heparin samples stored at −70°C.16 Laboratory lipids included serum triglycerides, total cholesterol, HDL-C and low-density lipoprotein cholesterol (LDL-C) levels. NMR analytes included lipid/lipoprotein and non-lipid measures. The lipid-related analytes included HDL-related measures: large, medium, small HDL and H1P, H2P, H3P, H4P, H5P, H6P, and H7P concentrations, and HDL size; LDL-related measures: large, small LDL concentrations and LDL size; and triacylglycerol-rich lipoprotein (TRL)-related measures: very large, large, medium, small TRL concentrations, TRL-carried cholesterol and triglyceride levels, TRL size, LDL peak particle density, apolipoprotein B and apolipoprotein A1.16 22 The H1P–H7P subclasses represent a refined classification of HDL particles from the smallest (H1P) to the largest particles (H7P). Non-lipid analytes were also measured using NMR, including amino acids (glycine, valine, leucine, isoleucine, alanine), ketones (acetone, beta-hydroxy-butyrate, acetoacetate, total ketones), citrate, and glycoprotein acetylation (GlycA), a novel inflammatory biomarker.24 The predictive utility of these analytes was evaluated for incident diabetes at the end of the DPP (short-term, 3.2 years) and at the end of the DPPOS (long-term, 15 years).
Statistical analyses
Statistical analyses were performed using R v.3.6.1.25 In the analytic framework, single analytes measured at baseline were evaluated in univariate prediction models. In addition, the following multivariable models were evaluated:
Model 1: age at randomization, sex (male, female), self-reported ethnicity (non-Hispanic white, African American, Hispanic, American Indian and Asian American), laboratory lipids, lipid-lowering medication use (yes/no), and treatment arm (placebo, lifestyle, metformin).
Model 2: Model 1 + all baseline lipid-related NMR analytes.
Model 3: age at randomization, sex, self-reported ethnicity, fasting glucose, baseline hemoglobin A1c (HbA1c), and treatment arm.
Model 4: Model 3 + family history of diabetes (yes/no), gestational diabetes mellitus history (yes/no for women and not applicable for men), systolic blood pressure (SBP), blood pressure medication use (yes/no), waist circumference, and body mass index (BMI).
Model 5: Model 3 + all laboratory lipids and lipid-lowering medication use.
Model 6: Model 3 + all laboratory lipids, all baseline lipid-related NMR analytes, and lipid-lowering medication use.
Model 7a: Model 6 + all baseline NMR analytes.
Model 7b: Model 6 + all baseline NMR analytes and their changes.
Model 8: Model 7a + family history of diabetes, gestational diabetes mellitus history, SBP, blood pressure medication use, waist circumference, and BMI.
Model 9: Model 4 + postprandial glucose, insulinogenic index, and IFI.
In Model 7b, NMR analytes changes were defined as:

As NMR data at 1 year were available in a smaller sample (n=2067 vs N=2590), model comparison was undertaken in two separate analytic steps: (1) using the total sample size at baseline (N=2590) and not considering model 7b; and (2) using the total sample size at baseline and follow-up (n=2067) and considering all models, including model 7b. The data contained no missing values.
Before analyses, variables with zero or near-zero variances and linearly dependent variables were removed. To determine the effect of correlation among included variables on the subsequent analytic framework, three distinct pairwise correlation filters were used in separate models: (1) Pearson’s |r|>0.6; (2) Pearson’s |r|>0.8; and (3) no correlation filter. Model comparisons were undertaken in a 5-fold nested cross-validation framework (illustrated by online supplemental figure 1) using the caret package.26 In brief, the outer cross-validation loops split the data into five training and validation sets (80%) and five hold-out test sets (20%). The inner cross-validation loops split the five training + validation sets into five training (80%) and validation sets (20%). In this construct, the inner loops are used for hyperparameter optimization using a grid search, and the outer loops are used to establish discriminative utility using the hold-out test sets. The hyperparameter optimization step was implemented as machine learning algorithms have a large number of parameters (eg, number of hidden units and layers in a neural network, number of trees in random forest) that can alter the performance of the algorithms. As the performance of the algorithms depends on the used data, it is of importance to systematically evaluate a wide range of these tunable parameters during the training + validation phase.
Supplemental material
All numeric variables have been scaled to mean=0 and SD=1 in the training sets, and the summary statistics of the training data were used to scale the test data in a separate step.27 Downsampling of the majority outcome class in the training set was implemented to ensure outcome balance. No downsampling was undertaken in the test sets. In the inner and outer cross-validation loops, the Matthews Correlation Coefficient (MCC) was used as a measure of discriminative utility, as it has been shown to be one of the most robust measures in binary classification problems.28 MCC is defined as:

where TP, TN, FP and FN correspond to the number of true positives, true negatives, false positives and false negatives from the confusion matrix, respectively. ROC AUC values were also presented as a secondary measure. MCC and ROC AUC values from the five tests sets were averaged. Of note, ROC AUC values range between 0 and 1, with 0.5 representing random guess. In contrast, MCC values range between −1 (perfect negative correlation) and 1 (perfect correlation), with 0 representing random guess (no correlation).
Logistic regression (generalized linear model, GLM), Cox proportional hazards model and six hyperparameter-tuned machine learning algorithms were employed to assess the discriminative utilities of the models. The six algorithms were stochastic gradient boosting, random forest, support vector machines with linear kernel (SVM-L), polynomial kernel (SVM-P) and radial kernel (SVM-R), and artificial neural network (ANN). The methods and hyperparameters are described in online supplemental file 2. We hypothesized that any improvement in discriminative utilities between GLM and the more elaborate machine learning algorithms will be due to linear and/or non-linear interactions that the logistic regression framework would not be able to detect without adding explicit interaction terms. To test this hypothesis, we conducted an experiment on simulated data to assess whether latent interactions would be detected or not using the eight algorithms above. This simulation experiment and its results are described in detail in online supplemental file 3.
Supplemental material
Supplemental material
Results
Baseline and 1-year characteristics
Baseline clinical characteristics are shown in table 1. Concentrations and sizes of the main lipoprotein classes and their 1-year changes have been reported previously in a smaller subset of the DPP.16 Additional NMR analysis contributed more detailed phenotypic resolution with additional measured metabolites, in a larger sample size. Thus, the descriptive statistics of baseline and 1-year NMR analytes and their changes by treatment and overall were recalculated and shown in online supplemental tables 1–3, respectively. At 3.2 and 15 years following randomization, 20.9% and 50.4% of the study cohort had developed diabetes, respectively. A heatmap representing Spearman correlations among laboratory lipids and NMR analytes is shown in the interactive online supplemental figure 2.
Supplemental material
Supplemental material
Supplemental material
Supplemental material
Clinical characteristics at baseline among participants with available data (N=2590)
Comparison of lipid-related models
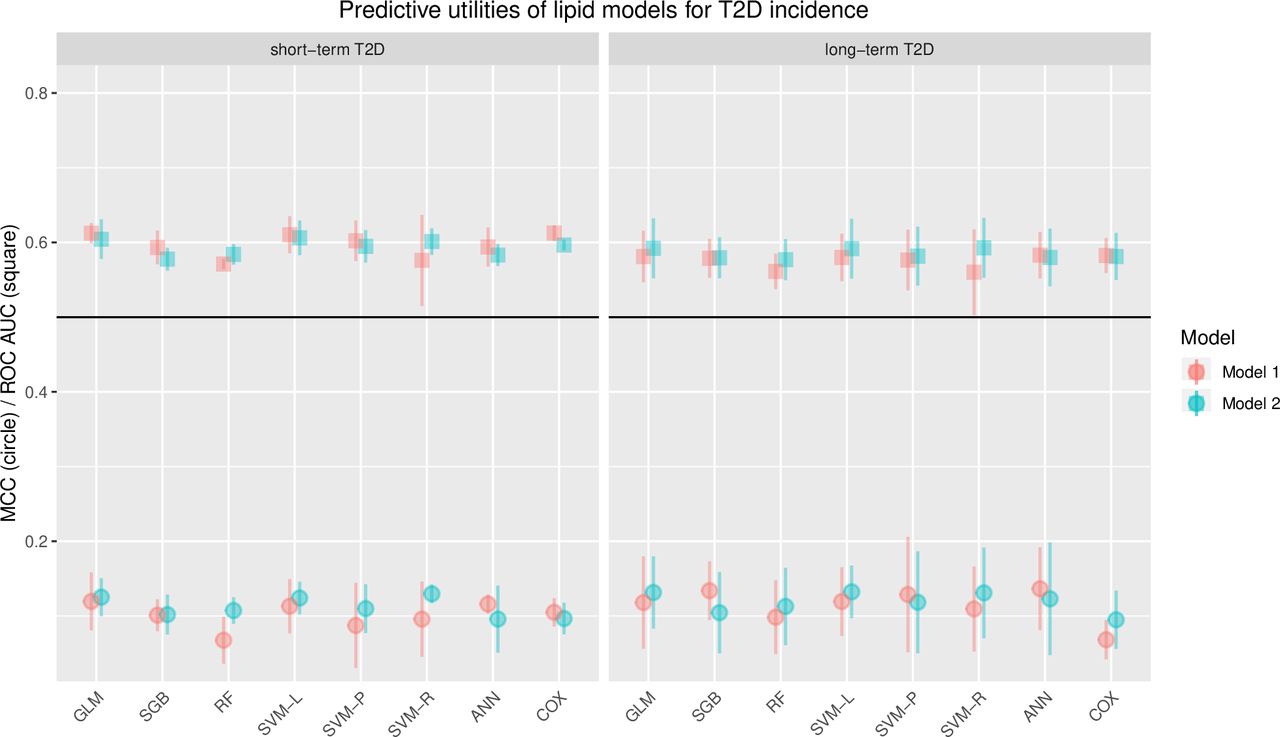
We first evaluated Model 1 and Model 2 to compare the predictive utilities of standard lipids and all lipid-related NMR analytes. MCC and ROC AUC values from these models are presented in figure 1. The means and SD for MCC and ROC AUC for all models, methods, and correlation filters are browsable in the interactive online supplemental table 4. The discriminative utilities of models for short-term and long-term diabetes demonstrated a maximum observed MCC of 0.16 and a maximum ROC AUC of 0.62. Model 2 offered small improvement in the discriminative utilities compared with model 1 for both short-term and long-term diabetes. A maximum MCC of 0.12 was observed for model 1 using the GLM and ANN methods for short-term diabetes (max ROC AUC=0.61) and a maximum MCC of 0.14 using ANN for long-term diabetes (max ROC AUC=0.58). In comparison, a maximum MCC of 0.16 was observed for model 2 using the SVM-L method for short-term diabetes (max ROC AUC=0.62) and a maximum MCC of 0.16 using SVM-R for long-term diabetes (max ROC AUC=0.60).
Supplemental material

MCC and ROC AUC statistics across all machine learning algorithms and baseline lipid-related prediction models in relation to short-term and long-term diabetes incidence (N=2590). MCC averages are represented by circles and ROC AUC averages are represented by squares. The averages are calculated from the five obtained MCC and ROC AUC values from the five separate test sets in the nested cross-validation framework. The error bars represent SD of the five obtained MCC and ROC AUC values. The left panel shows the discriminative utilities for short-term, while the right panel shows the discriminative utilities for long-term diabetes incidence. Model 1 includes predictors: age at randomization, sex, self-reported ethnicity, all laboratory lipids, lipid-lowering medication use and treatment arm. Model 2 includes all Model 1 predictors and all baseline lipid-related NMR analytes. ANN, artificial neural network; GLM, generalized linear model (refers to logistic regression here); MCC, Matthews Correlation Coefficient; NMR, nuclear magnetic resonance; RF, random forest; ROC AUC, receiver operating characteristic area under the curve; SGB, stochastic gradient boosting; SVM-L, support vector machine with linear kernel; SVM-P, support vector machine with polynomial kernel; SVM-R, support vector machine with radial kernel; T2D, type 2 diabetes.
Univariate prediction models
As a second step, we examined univariate prediction models. The results from these models for short-term and long-term diabetes, using GLM, are presented in figure 2A. In these analyses, standard lipid and lipid-related NMR analytes as well as clinical and glycemic risk factors and non-lipid NMR analytes were included. Using MCC, the strongest predictors of both short-term and long-term diabetes were glycemic traits, although the insulinogenic index and IFI were considerably weaker than others. Among standard lipids, triglycerides showed the strongest prediction for short-term diabetes using both MCC and ROC AUC (MCC=0.15; ROC AUC=0.62), while HDL-C was the strongest predictor of long-term diabetes development (MCC=0.08; ROC AUC=0.56). Among NMR lipid analytes, TRL size had the highest prediction for short-term diabetes (MCC=0.15; ROC AUC=0.56), while large and small LDL particles, LDL size and TRL size demonstrated the highest predictive utility for long-term diabetes (MCC ~0.10; ROC AUC ~0.57 for these four lipid analytes).

(A) Univariate discriminative utilities of continuous analytes at baseline in relation to short-term and long-term diabetes incidence (N=2590). The MCC and ROC AUC values are averages, calculated from the five obtained MCC and ROC AUC values from the five separate test sets in the nested cross-validation framework using the GLM method (logistic regression). The black circles represent MCC and ROC AUC values for short-term diabetes, while the red circles represent MCC and ROC AUC values for long-term diabetes. The predictors are sorted according to their MCC values for short-term diabetes. Model 1 includes predictors: age at randomization, sex, self-reported ethnicity, all laboratory lipids, lipid-lowering medication use and treatment arm. Model 2 includes all model 1 predictors and all baseline lipid-related NMR analytes. (B) Distributions of the six best performing univariate predictors for short-term diabetes, stratified by incident diabetes status (N=2590). The upper panel of the figure shows a schematic explanation for distributions that generally indicate good versus poor discriminative utility. The lower panel of the figure shows the density plots of the variables fasting glucose, 2-hour glucose, HbA1c, insulinogenic index, TRL size and glycine. AcAc, acetoacetate; ApoA1, apolipoprotein A1; ApoB, apolipoprotein B; BHB, beta-hydroxy-butyrate; BMI, body mass index; GlycA, glycoprotein acetylation; GLM, generalized linear model; HbA1c, hemoglobin A1c; HDL-C, high-density lipoprotein cholesterol; IFI, reciprocal of the fasting insulin level; LDL-C, low-density lipoprotein cholesterol; MCC, Matthews Correlation Coefficient; NMR, nuclear magnetic resonance; PPD, peak particle density; ROC AUC, receiver operating characteristic area under the curve; SBP, systolic blood pressure; T2D, type 2 diabetes; TC, total cholesterol; TG, triglycerides; TRL, triglyceride rich lipoprotein; TRL-C, TRL-cholesterol; TRL-G, TRL-triacylglycerol.
The outcome-stratified distributions of the top six classifiers for short-term diabetes, namely fasting glucose (MCC=0.25), 2-hour glucose (MCC=0.23), HbA1c (MCC=0.19), insulinogenic index (MCC=0.15), TRL size (MCC=0.15) and glycine (MCC=0.15), are shown in figure 2B. The main difference for long-term diabetes was that after the glycemic traits, the next three strongest univariate predictors were all branched chain amino acids (valine, isoleucine, leucine). The associations between baseline analytes and the outcomes, the development of diabetes at 3.2 and 15 years, are shown in online supplemental tables 5 and 6, respectively.
Supplemental material
Supplemental material
Comparison of all models
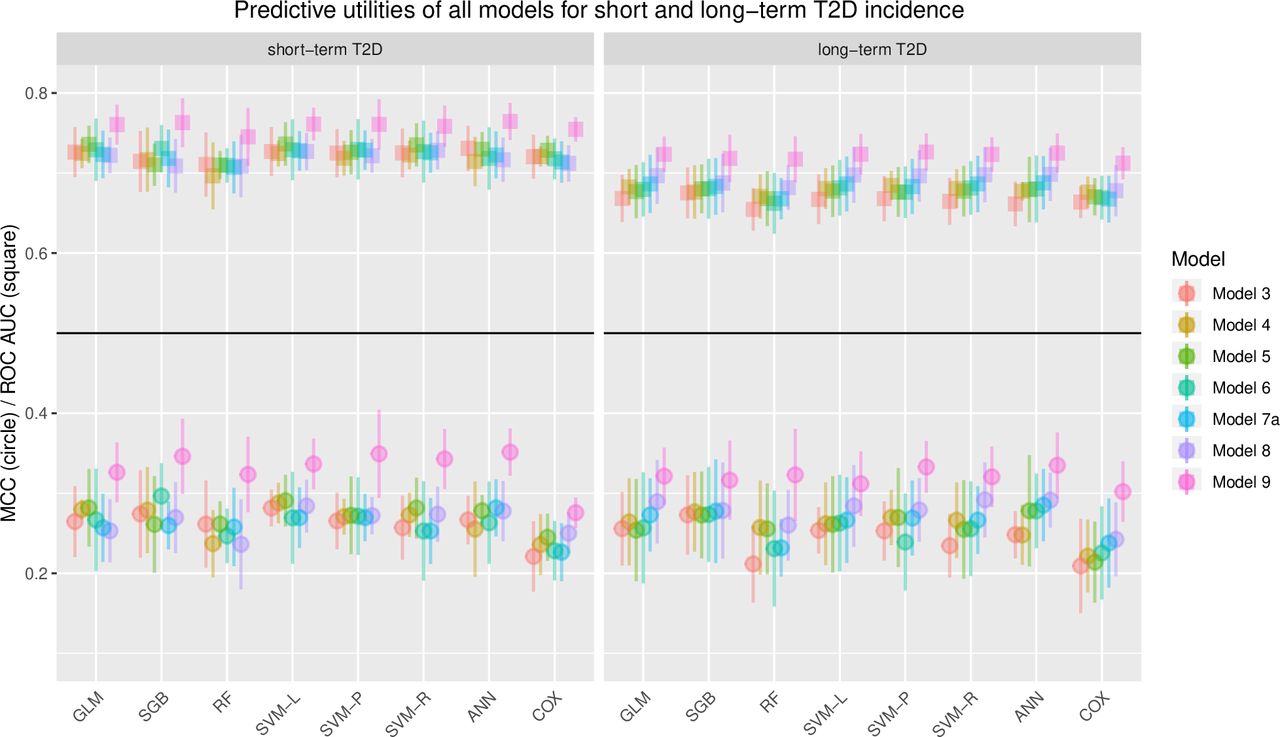
In order to test whether the inclusion of lipid data augmented the predictive utility of models incorporating usual epidemiological measures, we next evaluated seven additional models of increasing complexity. Baseline models are presented in figure 3, while all models (including model 7b with the 1-year change variables and a smaller sample size) are presented in online supplemental figure 3. The means and SD for MCC and ROC AUC for all methods, models and correlation filters are browsable in the interactive online supplemental table 4.
Supplemental material
MCC and ROC AUC statistics across all machine learning algorithms and all prediction models in relation to short-term and long-term diabetes incidence (N=2590). MCC averages are represented by circles and ROC AUC averages are represented by squares. The averages are calculated from the five obtained MCC and ROC AUC values from the five separate test sets in the nested cross-validation framework. The error bars represent SD of the five obtained MCC and ROC AUC values. The left panel shows the discriminative utilities for short-term, while the right panel shows the discriminative utilities for long-term diabetes incidence. This figure demonstrates the model results for all baseline models (N=2590). ANN, artificial neural network; GLM, generalized linear model (refers to logistic regression here); MCC, Matthews Correlation Coefficient; RF, random forest; ROC AUC, receiver operating characteristic area under the curve; SGB, stochastic gradient boosting; SVM-L, support vector machine with linear kernel; SVM-P, support vector machine with polynomial kernel; SVM-R, support vector machine with radial kernel; T2D, type 2 diabetes.
The standard and NMR lipid measures or the full NMR panel did not improve prediction (max MCC=0.30; max ROC AUC=0.74) when added to the simpler clinical model including fasting glucose (max MCC=0.30; max ROC AUC=0.73).
The highest discriminative utility was observed for Model 9 (including 2-hour glucose). This was seen in evaluation of short-term diabetes prediction (using SVM-R; MCC=0.36) and long-term diabetes prediction (using SVM-P and ANN; MCC=0.34). For prediction of short-term diabetes the ANN, SVM-L and SVM-R resulted in ROC AUC=0.77, and for long-term diabetes the SVM-P, SVM-R and ANN methods produced ROC AUC=0.73.
In a sensitivity analysis, Model 9 was repeated without the IFI and insulinogenic index variables. This analysis yielded very similar results to the original Model 9 metrics, indicating that 2-hour glucose alone here is sufficient to achieve the highest MCC and ROC AUC values.
Although Cox models and random forest generally underperformed the other methods in both short-term and long-term T2D classification (figure 3), there were no large differences in discriminative utilities between GLM and the other machine learning algorithms.
No meaningful differences were observed when comparing the results from models filtered by the other evaluated correlation thresholds (|r|>0.8 and no filter). Rank transformation of NMR analytes did not materially affect the results.
Discussion
We have undertaken analyses of the predictive utility of traditional clinical factors, biochemical measures of routinely measured blood lipids, and NMR measures of lipoproteins as predictors of short-term and long-term incident diabetes in the DPP and the DPPOS. We found that standard lipids such as triglycerides and HDL-C were poor predictors of both short-term and long-term incident type 2 diabetes in the DPP and the DPPOS. Triglyceride level was a somewhat better predictor of short-term diabetes than HDL-C in univariate analysis, whereas HDL-C was the better predictor of longer-term diabetes development. This may at least in part be due to the fact that HDL-C is a more stable measure over time than triglycerides. Although TRL size appeared overall to be the best individual NMR-based predictor of incident diabetes, a model containing NMR-measured lipoprotein measures provided minimal added discriminative utility in predicting incident diabetes over the model containing only standard lipids in our study. The best predictive models included measures of glycemia; the inclusion of standard lipids or NMR-based lipoprotein size and concentration measures did not augment the predictive utility of models incorporating glycemia.
Multiple studies demonstrate that elevated triglyceride and reduced HDL-C are strongly associated with insulin resistance and diabetes development.2–4 In our analyses, total HDL and triglycerides were also significantly associated with diabetes development. These lipid alterations were shown to be due to lipoprotein size and concentration abnormalities resulting from insulin resistance, which manifest prior to the development of dysglycemia.6–10 There may also be other mechanisms linking lipoprotein abnormalities to diabetes development.29 These studies also showed that these epidemiological associations remained statistically significant after the adjustment of conventional risk factors for diabetes development such as BMI, family history and glycemic measures. This observation suggests that lipid and lipoprotein markers may have value for risk stratification in patients with dysglycemia. In addition, in most studies,6–9 lipoprotein abnormalities such as higher very-low-density lipoprotein (VLDL) size remained associated with incident diabetes after adjusting for triglyceride and HDL-C concentrations, suggesting increased sensitivity as markers of risk compared with standard lipid measurements.
Single or multiple NMR analytes, related measures, or composite scores based on NMR analytes such as the lipoprotein insulin resistance score have been shown to strongly associate with glycemia30 31 and type 2 diabetes.10 32 33 However, the question as to whether various lipid and non-lipid NMR analytes can offer improvement in the classification of future type 2 diabetes status is debated. Recent studies showing strong associations between the lipoprotein insulin resistance score and type 2 diabetes incidence showed no or very small improvement in discriminative utilities of NMR lipoproteins when compared with established predictors.9 32
The apparent contradiction between our findings (showing limited predictive utility) versus our supplemental analysis of associations and previous studies (reporting strong associations of the same biomarkers) showcases a common, yet poorly understood, phenomenon. Biomarkers with robust statistical associations in populations are often poor classifiers of future disease status in individuals13 34 35 and therefore may not have value for individualized (n=1) prediction.12 While association studies are important in demonstrating a link between a biomarker and a disease, and may point to potential interventions for preventing or treating a disease, prediction of disease is more useful in making clinical decisions in a given individual. Thus, while lipids and lipoprotein abnormalities are linked to the pathophysiological changes underlying the development of type 2 diabetes and may have importance in identifying individuals with pre-diabetes at increased risk of cardiovascular disease, in our analyses they did not add discriminative value in predicting incident diabetes.
Of note, the expanded NMR assessment that included measurement of branched chain amino acids and glycine, which have been shown to be associated with insulin resistance and incident diabetes,36 also did not add discriminative utility to the glycemic model, although glycine and TRL size were among the best individual non-glucose predictors of short-term diabetes and branched chain amino acids were the best univariate predictors of long-term diabetes after glycemic traits in this cohort. Interestingly, TRL size has been shown to improve risk prediction for diabetes elsewhere, particularly in individuals with lower HbA1c values.37 Since lifestyle intervention and to a lesser extent metformin treatment caused beneficial changes in lipids and lipoproteins16 in the DPP, we also tested an NMR model that included changes in analytes after 1 year of lifestyle and metformin treatment, but found that these treatment-related changes added no additional discriminative utility for incident diabetes.
Other than known strengths and limitations of using data emanating from randomized trials,38 a further limitation of our analysis should be considered. Our findings were obtained in a clinical trial with pre-diabetes who were at high risk of developing diabetes and whose risk factor distributions may be different from individuals in the general population. Thus, these results might not be generalizable to populations with different distributions of diabetes risk factors. Specifically, our findings might not apply when assessing risk or predicting diabetes in people with normal glucose response. Predictive models for incident diabetes that also include data from healthier populations might provide evidence for stronger discriminative utilities of non-glycemic markers.39 On the other hand, the importance of more precise prediction of diabetes in high-risk subjects remains, since in the DPPOS, even after 15 years of follow-up, over 40% of participants in the placebo group did not develop diabetes.40 An additional potential limitation is the long-term storage of blood samples before the NMR analysis—as all samples were analyzed >7 years after the samples had been obtained, it is possible that some more sensitive molecules, for instance amino acids, could have been affected.41
In our study, the fasting glucose and 2-hour glucose levels at baseline were the best univariate predictors (mean MCC ~0.25 and ROC AUC ~0.67) outperforming all other risk factors including BMI and measures of insulin resistance and insulin secretion. This is not unexpected since these glycemic measures define the criteria for the diagnosis of incident diabetes in the DPP/DPPOS. The addition of 2-hour glucose to the glycemic model including fasting glucose increased its discriminative utility, and although 2-hour glucose measurement is less widely used than it once was to identify people with pre-diabetes, it clearly improved prediction of diabetes over other measures. This improvement in discriminative utility when adding 2-hour glucose to the model had been observed elsewhere in large populations.42 Of note, even the best model (Model 9, max MCC=0.36, max ROC AUC=0.77) that included both the fasting and 2-hour glucose measurements was not able to predict future diabetes well in our study. New biomarkers arising from various ‘omics’ platforms, environmental and lifestyle determinants, personal disease histories and other layers of personal data may prove useful in improving prediction models.43 Lipidomics and metabolomics, in particular, offer promising avenues for further research;44 multiple recent reports demonstrate that these more refined assessments have the potential to yield well-performing predictive models, even when compared with simpler models incorporating glycemic measures.45–50 Future studies should evaluate lipidomic and metabolomic profiles, sampled at multiple occasions—in both fasting and metabolically challenged states—to gain a more holistic picture and hopefully superior predictive models to predict diabetes.
Overall prediction was somewhat superior for all models for short-term diabetes (metrics of discriminative utility consistently higher in these models compared with those in the long-term diabetes models), although this was only apparent when assessing predictive validities using ROC AUC. This could reflect a higher predictive validity of risk factors in those at highest risk of diabetes development.
In this study, we chose to compare standard statistical methods for prediction with sophisticated machine learning algorithms that can provide improvement to established methods in prediction modeling.51 We acknowledge that the relatively small sample size in our study is a limitation when applying machine learning algorithms. We aimed to offset the small sample size by establishing a nested cross-validation framework so that all observations can be used in test sets and thereby maximize test data size and decrease the chances of mismatch between the random test data and the whole cohort. A simulation study was undertaken to test the utility of machine learning algorithms to detect latent interactions that might impact discriminative utilities. The result of the performed simulation experiment was that latent interactions, if present, would be detected using some of the more sophisticated machine learning algorithms, compared with simpler methods, such as GLM and SVM-L. As no large improvement in the discriminative utilities was observed when comparing prediction models, the results of this study are indicative of the lack of interactions that would meaningfully impact the performance of the used predictive models, for example, between our measures and the treatment arms.
In conclusion, although lipid and lipoprotein size and concentration measures associate strongly with incident diabetes, they did not add predictive utility to other standard clinical and glycemic risk factors in the DPP/DPPOS. Even using the best predictors, namely fasting and 2-hour glucose measurements, binary prediction of diabetes development was only moderate. Given that machine learning algorithms were not superior to traditional logistic regression in this setting, we conclude that influential non-linearities in the analyzed data were limited.
Supplemental material
Data availability statement
Data may be obtained from a third party and are not publicly available. In accordance with the NIH Public Access Policy, we continue to provide all manuscripts to PubMed Central including this manuscript. DPP/DPPOS has provided the protocols and lifestyle and medication intervention manuals to the public through its public website (https://www.dppos.org). The DPPOS abides by the NIDDK data sharing policy and implementation guidance as required by the NIH/NIDDK (https://www.niddkrepository.org/studies/dppos/).
Ethics statements
Ethics approval
The study protocols were approved by the institutional review board of each clinical center and participating centers.
Acknowledgments
The authors thank Dr Naji Younes (Associate Research Professor, Department of Biostatistics and Bioinformatics, George Washington University) for his feedback on statistical methodology. The research group gratefully acknowledges the commitment and dedication of the participants of the DPP and the DPPOS.
References
Supplementary materials
Supplementary Data
This web only file has been produced by the BMJ Publishing Group from an electronic file supplied by the author(s) and has not been edited for content.
Footnotes
Collaborators Pennington Biomedical Research Center (Baton Rouge, LA): George A. Bray, MD*, Kishore Gadde, MD*, Iris W. Culbert, BSN, RN, CCRC**, Jennifer Arceneaux RN, BSN**, Annie Chatellier, RN, CCRC**, Amber Dragg RD, LDN**, Catherine M. Champagne, PhD, RD, Crystal Duncan, LPN, Barbara Eberhardt, RD, LDN, Frank Greenway, MD, Fonda G. Guillory, LPN, April A. Herbert, RD, Michael L. Jeffirs, LPN, Betty M. Kennedy, MPA, Erma Levy, RD, Monica Lockett, LPN, Jennifer C. Lovejoy, PhD, Laura H. Morris, BS, Lee E. Melancon, BA, BS, Donna H. Ryan, MD, Deborah A. Sanford, LPN, Kenneth G. Smith, BS, MT, Lisa L. Smith, BS, Julia A. St.Amant, RTR, Richard T. Tulley, PhD, Paula C. Vicknair, MS, RD, Donald Williamson, PhD, Jeffery J. Zachwieja, PhD; University of Chicago (Chicago, IL): Kenneth S. Polonsky, MD*, Janet Tobian, MD, PhD*, David A. Ehrmann, MD*, Margaret J. Matulik, RN, BSN**, Karla A. Temple, PhD, RDN, LDN**, Bart Clark, MD, Kirsten Czech, MS, Catherine DeSandre, BA, Ruthanne Hilbrich, RD, Wylie McNabb, EdD, Ann R. Semenske, MS, RD; Jefferson Medical College (Philadelphia, PA): Jose F. Caro, MD*, Kevin Furlong, DO*, Barry J. Goldstein, MD, PhD*, Pamela G. Watson, RN, ScD*, Kellie A. Smith, RN, MSN**, Jewel Mendoza, RN, BSN**, Marsha Simmons, CCRP**, Wendi Wildman, RN**, Renee Liberoni, MPH, John Spandorfer, MD, Constance Pepe, MS, RD; University of Miami (Miami, FL): Richard P. Donahue, PhD*, Ronald B. Goldberg, MD*, Ronald Prineas, MD, PhD*, Juliet Ojito, RN**, Patricia Rowe, MPA**, Jeanette Calles, MSEd**, Paul Cassanova-Romero, MD, Sumaya Castillo-Florez, MPH, Hermes J. Florez, MD, Anna Giannella, RD, MS**, Lascelles Kirby, MS, Carmen Larreal, Olga Lara, Valerie McLymont, RN, Jadell Mendez, Arlette Perry, PhD, Patrice Saab, PhD, Beth Veciana; The University of Texas Health Science Center (San Antonio, TX): Steven M. Haffner, MD, MPH*, Helen P. Hazuda, PhD*, Maria G. Montez, RN, MSHP, CDE**, Kathy Hattaway, RD, MS, Juan Isaac, RN, BSN, Carlos Lorenzo, MD, PhD, Arlene Martinez, RN, BSN, CDE, Monica Salazar, Tatiana Walker, RD, MS, CDE; University of Colorado (Denver, CO): Dana Dabelea, MD, PhD*, Richard F. Hamman, MD, DrPH*, Patricia V. Nash, MS**, Sheila C. Steinke, MS**, Lisa Testaverde, MS**, Jennifer Truong, MPH**, Denise R. Anderson, RN, BSN, Larry B. Ballonoff, MD, Alexis Bouffard, MA, RN, BSN, Brian Bucca OD, FAOO, B. Ned Calonge, MD, MPH, Lynne Delve, Martha Farago, RN, James O. Hill, PhD, Shelley R. Hoyer, BS, Tonya Jenkins, RD, CDE, Bonnie T. Jortberg, MS, RD, CDE, Dione Lenz, RN, BSN, CDE, Marsha Miller, MS, RD, Thomas Nilan, BS, Leigh Perreault, MD, David W. Price, MD, Judith G. Regensteiner, PhD, Emily B. Schroeder, MD, Helen Seagle, MS, RD, Carissa M. Smith, BS, Brent VanDorsten, PhD; Joslin Diabetes Center (Boston, MA): Edward S. Horton, MD*, Medha Munshi, MD*, Kathleen E. Lawton, RN**, Sharon D. Jackson,CCRC,MS, RD, CDE**, Catherine S. Poirier, RN, BSN**, Kati Swift, RN, BSN**, Ronald A. Arky, MD, Marybeth Bryant, Jacqueline P. Burke, BSN, Enrique Caballero, MD, Karen M. Callaphan, BA, Barbara Fargnoli, RD, Therese Franklin, Om P. Ganda, MD, Ashley Guidi, BS, Mathew Guido, BA, Alan M. Jacobsen, MD, Lyn M. Kula, RD, Margaret Kocal, RN, CDE, Lori Lambert, MS, RD, LD, Kathleen E. Lawton, RN, Sarah Ledbury, Med, RD, Maureen A. Malloy, BS, Roeland J.W. Middelbeek, MD, Maryanne Nicosia, MS, RD, Cathryn F. Oldmixon, RN, Jocelyn Pan, BS, MPH, Marizel Quitingon, Stacy Rubtchinsky, BS, Ellen W. Seely, MD, Jessica Sansoucy, BS, Dana Schweizer, BSN, Donald Simonson, MD, Fannie Smith, MD, Caren G. Solomon, MD, MPH, Jeanne Spellman, RD, James Warram, MD; VA Puget Sound Health Care System and University of Washington (Seattle, WA): Steven E. Kahn, MB, ChB*, Basma Fattaleh, BA **, Brenda K. Montgomery, RN, BSN, CDE**, Celeste Colegrove, BS, Wilfred Fujimoto, MD, Robert H. Knopp, MD, Edward W. Lipkin, MD, Michelle Marr, BA, Ivy Morgan-Taggart, Anne Murillo, BS, Kayla O’Neal, BS, Dace Trence, MD, Lonnese Taylor, RN, BS, April Thomas, RD, MPH, CDE, Elaine C. Tsai, MD, MPH; University of Tennessee (Memphis, TN): Samuel Dagogo-Jack, MD, MSc, FRCP, FACP*, Abbas E. Kitabchi, PhD, MD, FACP*, Mary E. Murphy, RN, MS, CDE, MBA**, Laura Taylor, RN, BSN, CDE**, Jennifer Dolgoff, RN, BSN**, William B. Applegate, MD, MPH, Michael Bryer-Ash, MD, Debra Clark, LPN, Sandra L. Frieson, RN, Uzoma Ibebuogu, MD, Raed Imseis, MD, Helen Lambeth, RN, BSN, Lynne C. Lichtermann, RN, BSN, Hooman Oktaei, MD, Harriet Ricks, Lily M.K. Rutledge, RN, BSN, Amy R. Sherman, RD, LD, Clara M. Smith, RD, MHP, LDN, Judith E. Soberman, MD, Beverly Williams-Cleaves, MD, Avnisha Patel, MLT, Ebenezer A. Nyenwe, MD, FACP, Ethel Faye Hampton, R.N; Northwestern University’s Feinberg School of Medicine (Chicago, IL): Boyd E. Metzger, MD*, Mark E. Molitch, MD*, Mariana K. Johnson, MS, RN**, Daphne T. Adelman, MBA, RN, Catherine Behrends, Michelle Cook, MS, Marian Fitzgibbon, PhD, Mimi M. Giles, MS, RD, Deloris Heard, MA, Cheryl K.H. Johnson, MS, RN, Diane Larsen, BS, Anne Lowe, BS, Megan Lyman, BS, David McPherson, MD, Samsam C. Penn, BA, Thomas Pitts, MD, Renee Reinhart, RN, MS, Susan Roston, RN, RD, Pamela A. Schinleber, RN, MS, Amisha Wallia, MD; Massachusetts General Hospital (Boston, MA): David M. Nathan, MD*, Charles McKitrick, BSN**, Heather Turgeon, BSN**, Mary Larkin, MSN**, Marielle Mugford, BA**, Kathy Abbott, Ellen Anderson, MS, RD, Laurie Bissett, MS, RD, Kristy Bondi, BS, Enrico Cagliero, MD, Jose C. Florez, MD, PhD+, Linda Delahanty, MS, RD, Valerie Goldman, MS, RD, Elaine Grassa, Lindsery Gurry BSN, RN, CDE, Kali D’Anna, Fernelle Leandre BS, Peter Lou, MD, Alexandra Poulos, Elyse Raymond, BS, Valerie Ripley, BS, Christine Stevens, RN, Beverly Tseng; University of California-San Diego (La Jolla, CA): Jerrold M. Olefsky, MD*, Elizabeth Barrett-Connor, MD*, Sunder Mudaliar, MD*, Maria Rosario Araneta, PhD*, Mary Lou Carrion-Petersen, RN, BSN**, Karen Vejvoda, RN, BSN, CDE, CCRC**, Madeline Beltran, RN, BSN, CDE, Lauren N. Claravall, BS, Jonalle M. Dowden, BS, Steven V. Edelman, MD, Pranav Garimella, MBBS, Robert R. Henry, MD, Javiva Horne, RD, Marycie Lamkin, RN, Simona Szerdi Janesch, BA, Diana Leos, William Polonsky, PhD, Jean Smith, RN, Jennifer Torio-Hurley; Columbia University (New York, NY): F. Xavier Pi-Sunyer, MD*, Jane E. Lee, MS**, Susan Hagamen, MS, RN, CDE**, David B. Allison, PhD, Nnenna Agharanya, Nancy J. Aronoff, MS, RD, Maria Baldo, Jill P. Crandall, MD, Sandra T. Foo, MD, Jose A. Luchsinger, MD, MPH, Carmen Pal, MD, Kathy Parkes, RN, Mary Beth Pena, RN, Ellen S. Rooney, BA, Gretchen E.H. Van Wye, MA, Kristine A. Viscovich, ANP; Indiana University (Indianapolis, IN): David G. Marrero, PhD*, Kieren J. Mather, MD*, Melvin J. Prince, MD*, Susie M. Kelly, RN, CDE**, Marcia A. Jackson**, Gina McAtee**, Paula Putenney, RN**, Ronald T. Ackermann, MD, Carolyn M. Cantrell, Yolanda F. Dotson, BS, Edwin S. Fineberg, MD, Megan Fultz, John C. Guare, PhD, Angela Hadden, James M. Ignaut, MA, Marion S. Kirkman, MD, Erin O’Kelly Phillips, Beverly D. Porter, MSN, Paris J. Roach, MD, Nancy D. Rowland, BS, MS, Madelyn L. Wheeler, RD; Medstar Research Institute (Washington, DC): Vanita Aroda, MD*, Michelle Magee, MD*, Robert E. Ratner, MD*, Gretchen Youssef, RD, CDE**, Sue Shapiro, RN, BSN, CCRC**, Natalie Andon, RN, Catherine Bavido-Arrage, MS, RD, LD, Geraldine Boggs, MSN, RN, Marjorie Bronsord, MS, RD, CDE, Ernestine Brown, Holly Love Burkott, RN, Wayman W. Cheatham, MD, Susan Cola, Cindy Evans, Peggy Gibbs, Tracy Kellum, MS, RD, CDE, Lilia Leon, Milvia Lagarda, Claresa Levatan, MD, Milajurine Lindsay, Asha K. Nair, BS, Jean Park, MD, Maureen Passaro, MD, Angela Silverman, Gabriel Uwaifo, MD, Debra Wells-Thayer, NP, CDE, Renee Wiggins, RD; University of Southern California/UCLA Research Center (Alhambra, CA): Mohammed F. Saad, MD*, Karol Watson, MD*, Maria Budget**, Sujata Jinagouda, MD**, Medhat Botrous, MD**, Anthony Sosa**, Sameh Tadros**, Khan Akbar, MD, Claudia Conzues, Perpetua Magpuri, Kathy Ngo, Amer Rassam, MD, Debra Waters, Kathy Xapthalamous; Washington University (St. Louis, MO): Julio V. Santiago, MD*, Samuel Dagogo-Jack, MD, MSc, FRCP, FACP*, Neil H. White, MD, CDE*, Angela L. Brown, MD*, Samia Das, MS, MBA, RD, LD**, Prajakta Khare-Ranade, MSc, RDN, LD**, Tamara Stich, RN, MSN, CDE**, Ana Santiago, RN, Edwin Fisher, PhD, Emma Hurt, RN, Tracy Jones, RN, Michelle Kerr, RD, Lucy Ryder, RN, Cormarie Wernimont, RD, LD; Johns Hopkins School of Medicine (Baltimore, MD): Sherita Hill Golden, MD, MHS, FAHA*, Christopher D. Saudek, MD*, Vanessa Bradley, BA**, Emily Sullivan, MEd, RN**, Tracy Whittington, BS**, Caroline Abbas, Adrienne Allen, Frederick L. Brancati, MD, MHS, Sharon Cappelli, Jeanne M. Clark, MD, Jeanne B. Charleston, RN, MSN, Janice Freel, Katherine Horak, RD, Alicia Greene, Dawn Jiggetts, Deloris Johnson, Hope Joseph, Kimberly Loman, Nestoras Mathioudakis, MD, MHS, Henry Mosley, John Reusing, Richard R. Rubin, PhD, Alafia Samuels, MD, Thomas Shields, Shawne Stephens, Kerry J. Stewart, EdD, LeeLana Thomas, Evonne Utsey, Paula Williamson; University of New Mexico (Albuquerque, NM): David S. Schade, MD*, Karwyn S. Adams, RN, MSN**, Janene L. Canady, RN, CDE**, Carolyn Johannes, RN, CDE**, Claire Hemphill, RN, BSN**, Penny Hyde, RN, BSN**, Leslie F. Atler, PhD, Patrick J. Boyle, MD, Mark R. Burge, MD, Lisa Chai, RN, Kathleen Colleran, MD, Ysela Gonzales, Doris A. Hernandez-McGinnis, Patricia Katz, LPN, Carolyn King, Med, Amer Rassam, MD, Sofya Rubinchik, MD, Willette Senter, RD, Debra Waters, PhD; Albert Einstein College of Medicine (Bronx, NY): Jill Crandall, MD*, Harry Shamoon, MD*, Janet O. Brown, RN, MPH, MSN**, Gilda Trandafirescu, MD**, Danielle Powell, MPH, Elsie Adorno, BS, Liane Cox, MS, RD, Helena Duffy, MS, C-ANP, Samuel Engel, MD, Allison Friedler, BS, Angela Goldstein, FNP-C, NPP, CSW, Crystal J. Howard-Century, MA, Jennifer Lukin, BA, Stacey Kloiber, RN, Nadege Longchamp, LPN, Helen Martinez, RN, MSN, FNP-C, Dorothy Pompi, BA, Jonathan Scheindlin, MD, Elissa Violino, RD, MS, Elizabeth A. Walker PhD, RN, Judith Wylie-Rosett, EdD, RD, Elise Zimmerman, RD, MS, Joel Zonszein, MD; University of Pittsburgh (Pittsburgh, PA): Trevor Orchard, MD*, Elizabeth Venditti, PhD*, Rena R. Wing, PhD*, Susan Jeffries, RN, MSN**, Gaye Koenning, MS, RD**, M. Kaye Kramer, BSN, MPH**, Marie Smith, RN, BSN**, Susan Barr, BS, Catherine Benchoff, Miriam Boraz, PhD, Lisa Clifford, BS, Rebecca Culyba, BS, Marlene Frazier, Ryan Gilligan, BS, Stephanie Guimond, BS, Susan Harrier, MLT, Louann Harris, RN, Andrea Kriska, PhD, Qurashia Manjoo, MD, Monica Mullen, MHP, RD, Alicia Noel, BS, Amy Otto, PhD, Jessica Pettigrew, CMA, Debra Rubinstein, MD, Linda Semler, MS, RD, Cheryl F. Smith, PhD, Valarie Weinzierl, MPH, Katherine V. Williams, MD, MPH, Tara Wilson, BA; University of Hawaii (Honolulu, HI): Marjorie K. Mau, MD*, Narleen K. Baker-Ladao, BS**, John S. Melish, MD, Richard F. Arakaki, MD*, Renee W. Latimer, BSN, MPH**, Mae K. Isonaga, RD, MPH**, Ralph Beddow, MD, Nina E. Bermudez, MS, Lorna Dias, AA, Jillian Inouye, RN, PhD, Kathy Mikami, BS, RD, Pharis Mohideen, MD, Sharon K. Odom, RD, MPH, Raynette U. Perry, AA, Robin E. Yamamoto, CDE, RD; Southwest American Indian Centers (Phoenix, AZ; Shiprock, NM; Zuni, NM): William C. Knowler, MD, DrPH*+, Norman Cooeyate**, Mary A. Hoskin, RD, MS**, Carol A. Percy, RN, MS**, Alvera Enote**, Camille Natewa**, Kelly J. Acton, MD, MPH, Vickie L. Andre, RN, FNP, Rosalyn Barber, Shandiin Begay, MPH, Peter H. Bennett, MB, FRCP, Mary Beth Benson, RN, BSN, Evelyn C. Bird, RD, MPH, Brenda A. Broussard, RD, MPH, MBA, CDE, Brian C. Bucca, OD, FAAO, Marcella Chavez, RN, AS, Sherron Cook, Jeff Curtis, MD, Tara Dacawyma, Matthew S. Doughty, MD, Roberta Duncan, RD, Charlotte Dodge, Cyndy Edgerton, RD, Jacqueline M. Ghahate, Justin Glass, MD, Martia Glass, MD, Dorothy Gohdes, MD, Wendy Grant, MD, Robert L. Hanson, MD, MPH, Ellie Horse, Louise E. Ingraham, MS, RD, LN, Merry Jackson, Priscilla Jay, Roylen S. Kaskalla, David Kessler, MD, Kathleen M. Kobus, RNC-ANP, Jonathan Krakoff, MD, Jason Kurland, MD, Catherine Manus, LPN, Cherie McCabe, Sara Michaels, MD, Tina Morgan, Yolanda Nashboo, Julie A. Nelson, RD, Steven Poirier, MD, Evette Polczynski, MD, Christopher Piromalli, DO, Mike Reidy, MD, Jeanine Roumain, MD, MPH, Debra Rowse, MD, Robert J. Roy, Sandra Sangster, RD, Janet Sewenemewa, Miranda Smart, Darryl Tonemah, PhD, Rachel Williams, FNP, Charlton Wilson, MD, Michelle Yazzie; George Washington University Biostatistics Center (DPP Coordinating Center Rockville, MD): Raymond Bain, PhD*, Sarah Fowler, PhD*, Marinella Temprosa, PhD*, Michael D. Larsen, PhD*, Tina Brenneman**, Sharon L. Edelstein, ScM**, Solome Abebe, MS, Julie Bamdad, MS, Melanie Barkalow, Joel Bethepu, Tsedenia Bezabeh, Anna Bowers, Nicole Butler, Jackie Callaghan, Caitlin E. Carter, Costas Christophi, PhD, Gregory M. Dwyer, MPH, Mary Foulkes, PhD, Yuping Gao, Robert Gooding, Adrienne Gottlieb, Kristina L. Grimes, Nisha Grover-Fairchild, MPH, Lori Haffner, MS, Heather Hoffman, PhD, Kathleen Jablonski, PhD, Steve Jones, Tara L. Jones, Richard Katz, MD, Preethy Kolinjivadi, MS, John M. Lachin, ScD, Yong Ma, PhD, Pamela Mucik, Robert Orlosky, Qing Pan, PhD, Susan Reamer, James Rochon, PhD, Alla Sapozhnikova, Hanna Sherif, MS, Charlotte Stimpson, Ashley Hogan Tjaden, MPH, Fredricka Walker-Murray; Lifestyle Resource Core: Elizabeth M. Venditti, PhD*, Andrea M. Kriska, PhD, Linda Semler, MS, RD, LDN, Valerie Weinzierl, MPH; Central Biochemistry Laboratory (Seattle, WA): Santica Marcovina, PhD, ScD*, F. Alan Aldrich**, Jessica Harting**, John Albers, PhD, Greg Strylewicz, PhD; NIH/NIDDK (Bethesda, MD): R. Eastman, MD, Judith Fradkin, MD, Sanford Garfield, PhD, Christine Lee, MD, MS; Centers for Disease Control & Prevention (Atlanta, GA): Edward Gregg, PhDPing Zhang, PhD; Carotid Ultrasound: Dan O’Leary, MD*, Gregory Evans; Coronary Artery Calcification Reading Center: Matthew Budoff, MD, Chris Dailing. CT Scan Reading Center: Elizabeth Stamm, MD*; Dual Energy X-ray Absorptiometry Reading Center (San Francisco, CA): Ann Schwartz, PhD, Caroline Navy, Lisa Palermo, MS; Epidemiological Cardiology Research Center- Epicare (Winston-Salem, NC): Pentti Rautaharju, MD, PhD*, Ronald J. Prineas, MD, PhD**, Teresa Alexander, Charles Campbell, MS, Sharon Hall, Yabing Li, MD, Margaret Mills, Nancy Pemberton, MS, Farida Rautaharju, PhD, Zhuming Zhang, MD, Elsayed Z. Soliman, MD*, Julie Hu, MSc, Susan Hensley, BS, Lisa Keasler, Tonya Taylor; Fundus Photo Reading Center (Madison, WI): Barbara Blodi, MD*, Ronald Danis, MD*, Matthew Davis, MD*, Larry Hubbard*, Ryan Endres**, Deborah Elsas**, Samantha Johnson**, Dawn Myers**, Nancy Barrett, Heather Baumhauer, Wendy Benz, Holly Cohn, Ellie Corkery, Kristi Dohm, Amitha Domalpally, MD, PhD, Vonnie Gama, Anne Goulding, Andy Ewen, Cynthia Hurtenbach, Daniel Lawrence, Kyle McDaniel, Jeong Pak, James Reimers, Ruth Shaw, Maria Swift, Pamela Vargo, CRA, Sheila Watson; Neurocognitive Assessment Group: Jose A. Luchsinger, MD, MPH, Jennifer Manly, PhD; Nutrition Coding Center (Columbia, SC): Elizabeth Mayer-Davis, PhD*, Robert R. Moran, PhD**; Quality of Well-Being Center (La Jolla, CA): Ted Ganiats, MD*, Kristin David, MHP*, Andrew J. Sarkin, PhD*, Erik Groessl, PhD, Naomi Katzir, Helen Chong, MA; University of Michigan (Ann Arbor, MI): William H. Herman, MD, MPH, Michael Brändle, MD, MS, Morton B. Brown, PhD; +Genetics Working Group: Jose C. Florez, MD, PhD (Massachusetts General Hospital, Broad Institute), David Altshuler, MD, PhD (Massachusetts General Hospital, Broad Institute), Liana K. Billings, MD (Massachusetts General Hospital), Ling Chen, MS (Massachusetts General Hospital), Maegan Harden, BS (Broad Institute), Robert L. Hanson, MD, MPH (NIDDK), William C. Knowler, MD, DrPH (NIDDK), Toni I. Pollin, PhD (University of Maryland), Alan R. Shuldiner, MD (University of Maryland), Kathleen Jablonski, PhD (Coordinating Center), Paul W. Franks, PhD, MPhil, MS (Lund University, Sweden, Umeå University, Sweden, Harvard School of Public Health), Marie-France Hivert, MD (Université de Sherbrooke).
Contributors TVV, RBG and MT designed the study. TVV, JL and GC performed the statistical analyses. SD-J, CL, KJM, XP-S, SB, RBG and MT provided supervision. TVV drafted the manuscript. All authors critically revised and approved the manuscript. TVV and MT have primary responsibility for the final content (guarantors).
Funding TVV is supported by the Novo Nordisk Foundation (https://novonordiskfonden.dk/en/) Postdoctoral Fellowship within Endocrinology/Metabolism at International Elite Research Environments via NNF16OC0020698, the Swedish Research Council (Strategic Research Area Exodiab) (https://www.vr.se/english/) via Dnr 2009-1039, and the Swedish Foundation for Strategic Research (https://strategiska.se/en/) via Dnr IRC15-0067. SB is supported by the Novo Nordisk Foundation via NNF14CC0001 and NNF17OC0027594. The National Institute of Diabetes and Digestive and Kidney Diseases (NIDDK) of the National Institutes of Health provided funding to the clinical centers and the coordinating center for the design and conduct of the study, and collection, management, analysis, and interpretation of the data (U01 DK048489). The Southwestern American Indian Centers were supported directly by the NIDDK, including its Intramural Research Program, and the Indian Health Service. The General Clinical Research Center Program, National Center for Research Resources, and the Department of Veterans Affairs supported data collection at many of the clinical centers. Funding was also provided by the National Institute of Child Health and Human Development, the National Institute on Aging, the National Eye Institute, the National Heart, Lung, and Blood Institute, the National Cancer Institute, the Office of Research on Women’s Health, the National Institute on Minority Health and Health Disparities, the Centers for Disease Control and Prevention, and the American Diabetes Association. Merck KGaA provides medication for DPPOS. DPP/DPPOS have also received donated materials from Bristol Myers Squibb, Parke-Davis, and LifeScan. LifeScan, Health O Meter, Hoechst Marion Roussel, Merck-Medco Managed Care, Merck and Co, Nike Sports Marketing, Slim Fast Foods, and Quaker Oats donated materials, equipment, or medicines for concomitant conditions. McKesson BioServices, Matthews Media Group, and the Henry M Jackson Foundation provided support services under subcontract with the coordinating center. The sponsor of this study was represented on the steering committee and played a part in study design, how the study was done, and publication. All authors in the writing group had access to all data. The opinions expressed are those of the study group and do not necessarily reflect the views of the funding agencies. A complete list of centers, investigators, and staff can be found in online supplemental file 1.
Competing interests None declared.
Provenance and peer review Not commissioned; externally peer reviewed.
Supplemental material This content has been supplied by the author(s). It has not been vetted by BMJ Publishing Group Limited (BMJ) and may not have been peer-reviewed. Any opinions or recommendations discussed are solely those of the author(s) and are not endorsed by BMJ. BMJ disclaims all liability and responsibility arising from any reliance placed on the content. Where the content includes any translated material, BMJ does not warrant the accuracy and reliability of the translations (including but not limited to local regulations, clinical guidelines, terminology, drug names and drug dosages), and is not responsible for any error and/or omissions arising from translation and adaptation or otherwise.