Article Text

Abstract
Introduction Glucose variability is associated with mortality and macrovascular diabetes complications. The mechanisms through which glucose variability mediates tissue damage are not well understood, although cellular oxidative stress is likely involved. As heat shock proteins (HSPs) play a role in the pathogenesis of type 2 diabetes (T2D) complications and are rapidly responsive, we hypothesized that HSP-related proteins (HSPRPs) would differ in diabetes and may respond to glucose normalization.
Research design and methods A prospective, parallel study in T2D (n=23) and controls (n=23) was undertaken. T2D subjects underwent insulin-induced blood glucose normalization from baseline 7.6±0.4 mmol/L (136.8±7.2 mg/dL) to 4.5±0.07 mmol/L (81±1.2 mg/dL) for 1 hour. Control subjects were maintained at 4.9±0.1 mmol/L (88.2±1.8 mg/dL). Slow Off-rate Modified Aptamer-scan plasma protein measurement determined a panel of HSPRPs.
Results At baseline, E3-ubiquitin-protein ligase (carboxyl-terminus of Hsc70 interacting protein (CHIP) or HSPABP2) was lower (p=0.03) and ubiquitin-conjugating enzyme E2G2 higher (p=0.003) in T2D versus controls. Following glucose normalization, DnaJ homolog subfamily B member 1 (DNAJB1 or HSP40) was reduced (p=0.02) in T2D, with HSP beta-1 (HSPB1) and HSP-70-1A (HSP70-1A) (p=0.07 and p=0.09, respectively) also approaching significance relative to T2D baseline levels.
Conclusions Key HSPRPs involved in critical protein interactions, CHIP and UBE2G2, were altered in diabetes at baseline. DNAJB1 fell in response to euglycemia, suggesting that HSPs are reacting to basal stress that could be mitigated by tight glucose control with reduction of glucose variability.
- diabetes mellitus
- type 2
- blood glucose
Data availability statement
Data are available on reasonable request to the corresponding author.
This is an open access article distributed in accordance with the Creative Commons Attribution Non Commercial (CC BY-NC 4.0) license, which permits others to distribute, remix, adapt, build upon this work non-commercially, and license their derivative works on different terms, provided the original work is properly cited, appropriate credit is given, any changes made indicated, and the use is non-commercial. See: http://creativecommons.org/licenses/by-nc/4.0/.
Statistics from Altmetric.com
Significance of this study
What is already known about this subject?
Heat shock proteins (HSPs) are important in the pathogenesis of type 2 diabetes (T2D) and its complications, and glucose variability is associated with mortality and macrovascular diabetes complications.
What are the new findings?
Key HSPs, carboxyl-terminus of Hsc70 interacting protein and ubiquitin-conjugating enzyme E2G2 (UBE2G2), proteins critical for optimal functioning of intracellular protein degradation pathways, were altered at baseline in the patients with diabetes.
Higher levels of DNAJB1(HSP40) have been linked to insulin resistance; here, DNAJB1 levels fell significantly with euglycemic normalization of blood glucose in the T2D subjects.
On achieving euglycemia in T2D subjects, HSPB1, a chaperone protein involved in protection of the proteome from stress, and HSP70-1A, a protein member of the HSP70 family also involved in protection of the proteome from stress by targeting and direction of misfolded proteins for either refolding or degradation, also approached significance relative to baseline levels.
These data suggest an additional mechanism to account for the effect of glucose variability on diabetes-related complications.
How might these results change the focus of research or clinical practice?
HSP levels are altered in response to basal stress in T2D, and their levels can be normalized by good glucose control and reduction of glucose variability.
Introduction
The chronic hyperglycemia of type 2 diabetes (T2D) results from a combination of progressive pancreatic islet β-cell failure and increased insulin resistance (IR)1 A progressive increase in its prevalence means that T2D is now the fourth leading cause of mortality.2 This has led to an increase in diabetes-related complications and, while their molecular mechanisms are increasingly understood, new molecular therapeutic targets are needed to prevent the microvascular and macrovascular diabetes-related complications such as nephropathy, retinopathy, heart failure, and limb amputation.
Heat shock proteins (HSPs) are critical proteins classified by molecular weight3 that suppress protein aggregation, assist in folding and stability of nascent/damaged proteins, chaperone proteins into cellular compartments and target irreversibly damaged proteins for degradation under physiological and stressful conditions.4 HSPs bind and control the activity of critical enzymes for inflammation, apoptosis, metabolism and cell signaling, and genetic manipulation of certain HSPs, or modulation of their expression, has revealed their role in the pathogenesis of several chronic diseases including diabetes and its complications.5–9 They have also been indicated to play a role in ß-cell dysfunction and IR.10 Hyperglycemia leads to downregulation of protective HSPs.11 HSPs appear to have a role in diabetes complications: elevated HSP27 has been associated with diabetic neuropathy5 and diabetic nephropathy,6 while diabetic retinopathy has been associated with HSP7012 13 that is inversely related to macrovascular complications.13 14 Consequently, HSPs have been considered as potential therapeutic targets.3
Improved management of T2D involves stricter glucose control, but the effect on HSP levels on achieving euglycemia from hyperglycemia has not previously been studied. In non-diabetic individuals during exercise, glucose has been shown to attenuate the circulating HSP response, indicating a relationship between HSP and glucose.15 Low glucose levels in the hypoglycemic range are associated with HSP70 inducible form HSP72 though it was unclear whether this is simply a marker of hypoglycemia or has a more functional role.16 Changes in HSP expression have been functionally related to hyperglycemia, and glucose variability has been associated with mortality and macrovascular diabetes complications, perhaps through increased tissue damage mediated by oxidative stress (OS), though the mechanisms are unclear.17 The HSP response is rapid and acute hyperglycemia is associated with downregulation of protective HSPs;11 therefore, we hypothesized that HSPs would differ in diabetes and may respond to glucose normalization.
Research design and methods
Study design
T2D (n=23) and control (n=23) Caucasian subjects, aged between 40 and 70 years, were enrolled in a case-controlled study.
All participants provided written informed consent and were identified as previously described.18
In the T2D cohort, the duration of diabetes was <10 years and all T2D subjects had been on a stable dose of medication (metformin, statin and/or ACE inhibitor/angiotensin receptor blocker) for the prior 3 months. For inclusion of patients with T2D, only metformin as antidiabetic therapy was allowed; other inclusion criteria were HbA1c<10% (86mmol/mol)], and that patients had no history of hypoglycemic unawareness or hypoglycemia within the prior 3-month period. In the control group, diabetes was excluded with an oral glucose tolerance test. All subjects had a body mass index (BMI) between 18 and 49 kg/m2, normal renal and hepatic biochemical indices and no prior history of cancer, or any contraindication to insulin infusion to achieve hypoglycemia (ischemic heart disease, epilepsy, seizure history, drop attacks, history of adrenal insufficiency, and treated hypothyroidism).
All participants had a medical history, clinical examination, routine blood tests, and an ECG performed (table 1). The ECG was normal in all subjects.
Demographic and clinical characteristics of the study participants
The hyperinsulinemic clamp was performed as reported;19 in brief, all patients underwent a 10-hour fast prior to the clamp. T2D: baseline glucose 7.6±0.4 mmol/L (136.8±7.2 mg/dL), reduced to 4.5±0.07 mmol/L (81±1.2 mg/dL) for 1 hour. Controls: 4.9±0.1 mmol/L (88.2±1.8 mg/dL). Hemacue blood glucose samples were collected every 5 min to monitor the glucose lowering progression and samples for proteomic analysis were collected at baseline and after 1 hour of euglycemia.19
Following the hyperinsulinemic clamp, participants were given lunch and the T2D cohort were provided their (morning) diabetes medications; patients later took their evening medication as prescribed.
Biochemical markers
Blood samples were separated immediately by centrifugation at 2000 g for 15 min at 4°C, and the aliquots were stored at –80°C, within 30 min of blood collection, until batch analysis. Fasting plasma glucose, total cholesterol, triglycerides, and high-density lipoprotein cholesterol levels were measured enzymatically using a Beckman AU 5800 analyser (Beckman-Coulter, High Wycombe, UK).
SOMA-scan assay
Slow Off-rate Modified Aptamer (SOMA)-scan plasma protein measurement19 was used to determine a panel of heat shock and related proteins, namely HSP-90-alpha/beta (HSP90alpha-A1/HSP90alpha-B1), HSP-70 (HSP70-1A), Heat shock cognate 71 kDa protein (HSP70-8), HSP-beta-1 (HSPB1), 60 kDa HSP, mitochondrial (HSPD1), hsp90 co-chaperone Cdc37 (CDC37), dnaJ homolog subfamily B member-1 (DNAJB1), peptidyl-prolyl cis-trans isomerase D (PPID), stress-induced-phosphoprotein-1 (STIP1), E3 ubiquitin-protein ligase (carboxyl-terminus of Hsc70 interacting protein (CHIP) or HSPABP2), Ubiquitin-conjugating enzyme E2 G2 (UBE2G2) and HSP 90 dimer (HSP90a/b). The SOMAscan assay was performed on an in-house Tecan Freedom EVO liquid handling system (Tecan Group, Maennedorf, Switzerland) using buffers and SOMAmers from the SOMAscan HTS Assay 1.3K plasma kit (SomaLogic, Boulder, Colorado, USA) according to manufacturer’s instructions and as described previously.20 21 The assay was performed in 96-well plates containing up to 85 plasma samples, 3 quality control, and 5 calibrator plasma samples. Briefly, EDTA plasma samples were diluted into bins of 40%, 1%, and 0.05% and incubated with streptavidin-coated beads immobilized with dilution-specific SOMAmers via a photocleavable linker and biotin. After washing, bound proteins were first biotinylated and then released from beads by photocleaving the SOMAmer-bead linker. The released SOMAmer-protein complex was treated with a polyanionic competitor to disrupt unspecific interactions and recaptured on the second set of streptavidin-coated beads. Thorough washing was performed before 5’ Cy3 fluorophore labeled SOMAmers were released under denaturing conditions, hybridized on microarray chips with SOMAmer-complementary sequences, and scanned using the SureScan G2565 Microarray Scanner (Agilent, Santa Clara, California, USA).
Data processing and analysis
Initial relative fluorescent units (RFUs) were obtained from microarray intensity images using the Agilent Feature Extraction Software (Agilent, Santa Clara, California, USA). Raw RFUs were normalized and calibrated using the software pipeline provided by SomaLogic. This included (a) microarray hybridization normalization based on spiked-in hybridization controls, (b) plate-specific intensity normalization, (c) median signal normalization, and (d) median calibrator scaling of single RFU intensities according to calibrator reference values. Samples with a high degree of hemolysis (Haptoglobin log RFU <10) were excluded from the analysis.
Statistical analyses were performed on log2 RFU values using R V.3.5.2 (R Foundation for Statistical Computing, Vienna, Austria) including base R package. Data handling and differential protein expression were analyzed using the autonomics and limma22 packages. For differential protein analysis, we applied limma models containing contrasts between timepoints, as well as contrasts between healthy and patients with diabetes at single timepoints. In both models, blocking by patient ID was performed to account for random effects. Batch effect correction was performed by adding batch as a covariate to the model. Limma obtained p values were corrected using the Benjamini-Hochberg method.23
Statistical analysis
There are no studies detailing the changes in HSP response to hypoglycemia resulting from a hyperinsulinemic clamp intervention on which to base a power calculation. Sample size for pilot studies has been reviewed by Birkett and Day.24 They concluded that a minimum of 20 degrees-of-freedom was required to estimate effect size and variability. Hence, we needed to analyze samples from a minimum of 20 patients per group. Data trends were visually evaluated for each parameter and non-parametric tests were applied on data that violated the assumptions of normality when tested using the Kolmogorov-Smirnov Test. Comparison between groups was performed at each timepoint using Student’s t-test. P<0.05 was considered statistically significant. Within-group comparisons are as follows: changes from baseline, and from hypoglycemia, to each subsequent timepoint were compared using Student’s t-test. The sample size was too small to adjust for baseline covariates. Statistical analysis was performed using Graphpad Prism (San Diego, California, USA).
Protein-protein interaction; STRING analysis
STRING 11.0 (Search Tool for the Retrieval of Interacting Genes) was used to visualize the known and predicted Protein-Protein Interactions for proteins identified by SOMAscan assay in plasma of T2D versus control subjects (https://string-db.org/). Interactions between proteins are evidence-based and collated from databases, experiments, neighborhood, gene fusion, co-occurrence, text mining, coexpression, and homology. Here, we determined the relationships between the HSPs presented in this study.
Results
T2D subjects (n=23) were older than control subjects (n=23) (p<0.0001). T2D had higher BMI (p<0.0001) with duration of diabetes 4.5±2.2 years.
HSP and related protein changes are shown in table 2. Of the 13 proteins studied in this panel, CHIP was significantly lower (p=0.03) and UBE2G2 higher (p=0.003) at baseline in T2D versus controls, while there was no difference between controls and T2D subjects at baseline for HSP90alpha-A1/HSP90alpha-B1, HSP70-1A, HSC70, HSPB1, HSPD1, CDC37, DNAJB1, PPID, STIP1, and HSP 90a/b.
Comparison of heat shock and related proteins between control (n=23) and type 2 diabetes (n=23) subjects at baseline and comparison of heat shock and related proteins between diabetes at baseline and following establishment of normoglycemia (4.5±0.07 mmol/L: 81±1.2 mg/dL) for 1 hour by a hyperinsulinemic clamp
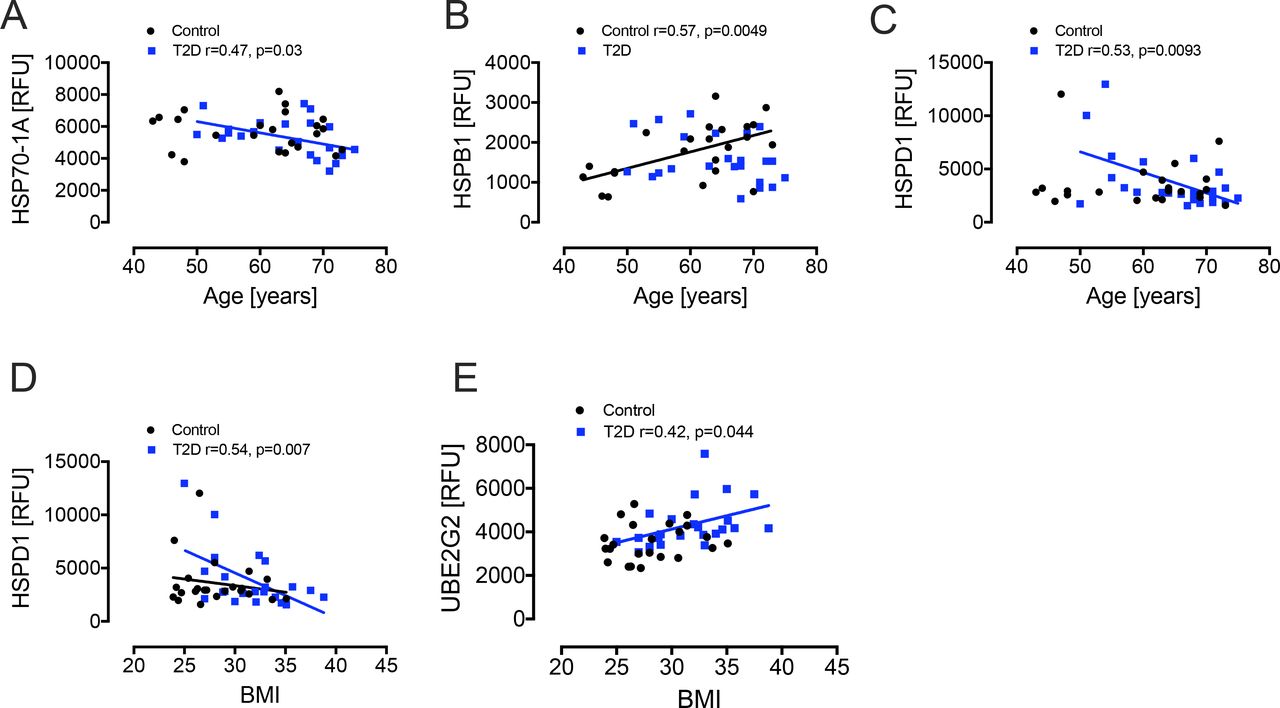
Following the hyperinsulinemic clamp, DNAJB1 was significantly reduced (p=0.02) in T2D with decreases in HSPB1 and HSP70-1A (p=0.07 and p=0.09, respectively) also approaching significance relative to T2D baseline levels (figures 1 and 2). Since age and obesity are related to lower intracellular HSPs and higher circulating HSPs levels,25 we performed correlations of the HSPs with age and BMI. There was a negative correlation for HSP70-1A (r=0.47, p=0.03) and HSPD1 (r=0.53, p=0.0093) with age in T2D and a positive correlation for HSPB1 (r=0.57, p=0.0049) with age in controls. There was a negative correlation of HSPD1 (r=0.54, p=0.007) and a positive correlation of UBE2G2 (r=0.42, p=0.044) with BMI in T2D only (figure 3).

Comparison of HSPs HSP90alpha-A1, HSP90alpha-B1, HSP70-1A, HSP70-8, HSPB1, 60 kDa heat shock protein, mitochondrial (HSPD1), CDC37, and DNAJB1 in plasma at BL and after iatrogenic induction of euglycemia (BM) in T2D subjects. Blood sampling for proteomics was performed at baseline (BL) in controls (white circles) and T2D (black squares) and again at euglycemia (BM) in T2D subjects. Proteomic (Somalogic) analysis of HSP-related proteins was undertaken for HSPs HSP90alpha-A1 (A), HSP90alpha-B1 (B), HSP70-1A (C), HSP70-8 (D), HSPB1 (E), HSPD1 (F), CDC37 (G), and DNAJB1 (H). Statistics: $p<0.05, T2D BL vs BM. BL, baseline; CDC37, hsp90 co-chaperone Cdc37; DNAJB1, dnaJ homolog subfamily B member-1; HSP, heat shock protein; HSP70-1A, heat shock protein-70; HSP70-8; heat shock cognate 71 kDa protein; HSP90alpha-A1, heat shock protein-90-alpha; HSP90alpha-B1; heat shock protein-90-beta; HSPB1, heat shock protein-beta-1; HSPD1, 60 kDa heat shock protein, mitochondrial; RFU, relative fluorescent units; T2D, type 2 diabetes.

Comparison of HSPs PPID, STIP1, CHIP, UBE2G2 and heat shock protein 90 dimer (HSP90a/b) in plasma at BL and after iatrogenic induction of euglycemia (BM) in T2D subjects. Blood sampling for proteomics was performed at baseline (BL) in controls (white circles) and T2D (black squares) and again at euglycemia (BM) in T2D subjects. Proteomic (Somalogic) analysis of HSP-related proteins was undertaken for HSPs PPID (A), STIP1 (B), CHIP (C), UBE2G2 (D), and HSP90a/b (E). Statistics: * p<0.05, BL, T2D vs control; **p<0.01, BL, T2D vs control. BL, baseline; CHIP, carboxyl-terminus of Hsc70 interacting protein; HSP, heat shock protein; PPID, peptidyl-prolyl cis-trans isomerase D; RFU, relative fluorescent units; STIP1, stress-induced-phosphoprotein 1; T2D, type 2 diabetes; UBE2G2, ubiquitin-conjugating enzyme E2G2.

Correlation analyses of heat shock proteins. For age, there was a negative correlation with HSP70-1A (A) and HSPD1 (C) in T2D (blue squares) and a positive correlation for HSPB1 (B) in controls (black squares). For BMI, there was a negative correlation with HSPD1 (D) and a positive correlation with UBE2G2 (E). BMI, body mass index; HSP, heat shock protein; HSPB1, HSP beta-1; RFU, relative fluorescent units; T2D, type 2 diabetes; UBE2G2, ubiquitin-conjugating enzyme E2G2.
As alterations in HSP responses have been documented in menopausal women,26 we subdivided our T2D and control cohorts according to gender. Of the 13 HSPs, the only gender difference was seen with HSP70-1A that was higher in T2D women vs T2D men (p=0.012).
STRING analysis revealed that plasma CHIP showed the association and network with the other identified HSPs in the study, but that UBE2G2 was only linked to CHIP (figure 4), although there was no correlation between the two in plasma for either controls or T2D subjects (data not shown).

STRING interaction network showing the interactions of heat shock-related proteins. STRING 11.0 was used to visualize the known and predicted protein-protein interactions for proteins identified by SOMAscan assay in plasma of T2D vs control subjects (https://string-db.org/). Network nodes represent proteins and the lines reflect physical and/or functional interactions of proteins. Empty nodes represent the proteins of unknown three-dimensional structure, and filled nodes represent the proteins with some three-dimensional structure, either known or predicted. Different colored lines between the proteins represent the various types of interaction evidence in STRING (databases, experiments, neighborhood, gene fusion, co-occurrence, text mining, coexpression, and homology): here, known interactions are shown in light blue (from curated databases) and pink (experimentally determined); predicted interactions are shown in dark blue (gene co-occurrence); relationships gleaned from text mining (lime green), coexpression (black), and protein homology (mauve) are also shown. HSP, heat shock protein; HSPB1, HSP beta-1; STRING, Search Tool for the Retrieval of Interacting Genes; T2D, type 2 diabetes; UBE2G2, ubiquitin-conjugating enzyme E2G2.
Conclusion
CHIP was significantly lower and UBE2G2 higher at baseline in the diabetes versus control patients. CHIP (HSPABP2) modulates the action of the chaperone proteins HSC70/HSP70 (HSP70-1A),27 suggesting that the lower level may be associated with lower HSP activity, though the actual protein level measured did not differ.28 In addition, CHIP, through E3 ubiquitin ligase activity, is a key factor in the cellular protein degradation pathway29 and its decrease may impair protein degradation leading to toxic oligomers, increased reactive oxygen species (ROS and ultimately beta cell apoptosis.
UBE2G2 is a ubiquitin-conjugating enzyme modifying proteins with ubiquitin and necessary for misfolded protein degradation. UBE2G2 interacts with the U-box of C terminus of the HSP70 interacting protein CHIP and are closely linked.28
DNAJB1 belongs to the HSP40 family and higher levels are linked to IR.30 DNAJB1 decreased significantly in response to serum glucose normalization in T2D with decreases in HSP70-1A and HSPB1 also approaching significance. It should be noted that the levels of DNAJB1 were comparable at baseline between controls and T2D, and therefore its fall in response to induction of euglycemia seen in T2D would seem discrepant but theoretically is due to a change in sensitivity of response in T2D. However, a fall in DNAJB1 would be in accord with a predicted decrease in HSP with the fall in glucose to normality; DNAJB1 acts through CHIP to modulate HSP70 to affect degradation of damaged protein and, therefore, lower levels, as seen here with the development of euglycemia, are beneficial. Hypothetically, modulation of DNAJB1 in response to glucose may be one of the mechanisms underlying clinical glucose variability through improved glucose metabolism and hepatic IR inferred from animal experiments31 that may reflect on tissue damage effects reported for glucose variability17 and represents a target for therapeutic intervention.
Glycemic variability is associated with diabetes complications possibly through increased tissue damage mediated by OS.17 Nitric oxide (NO), a pleiotropic regulator of several biological processes and a potent endogenous vasodilator, is produced by three isoforms of the enzyme NO synthase (NOS), which includes endothelial NOS (eNOS), inducible NOS (iNOS), and neuronal NOS.32 In diabetes, endothelial dysfunction occurs because of increased NO inactivation by ROS.33 Hyperglycemia downregulates eNOS in human coronary artery endothelial cells, thus contributing to the inactivation of NO that leads to endothelial dysfunction in diabetes.34 By contrast, hyperglycemia induces iNOS production and contributes to hepatic IR in ob/ob mice.35 CHIP facilitates ubiquitination of iNOS and promotes its proteasomal degradation.36 Moreover, CHIP regulates eNOS trafficking through the Golgi compartment by a co-chaperone-dependent mechanism which includes HSP70 and HSP90.37 Since hyperglycemia downregulates eNOS, we would expect higher CHIP in plasma in patients with T2D; however, our data demonstrated a lower basal level of CHIP in T2D, suggesting either hyperglycemia-induced inhibition of eNOS involving a mechanism independent to CHIP or that CHIP expression is downregulated as a consequence of altered physiological changes in T2D. HSP70 and HSP90 are also linked to inducible NO synthase and endothelial NO synthase expression,38 and CHIP targets NO synthase in concert with HSP70 while also modulating the activity of several chaperone complexes which include HSC/HSP70 and HSP90 among others.36 39 CHIP also acts as a co-chaperone for HSP70, promoting ubiquitin-mediated protein degradation.39 Therefore, both glucose variability and the expression of HSPs are associated with OS.
In previous reports, insulin upregulated eNOS expression in human coronary endothelial cells and the action of insulin was abolished by glucagon.34 Our data demonstrated 1.7-fold increased basal glucagon levels (data not shown) in T2D; therefore, it is also possible that hyperglucagonemia is associated with a lower level of CHIP in T2D. Further studies that involve endocrine factors responsible for glucose variability and their relation to the expression of HSPs would be beneficial to elucidate the mechanism of altered HSPs levels and activity in T2D. Future research focusing on diacron-reactive oxygen metabolites test40 and/or a biological antioxidant potential test41 might allow an evaluation of the oxidant-antioxidant status before and after the clamp intervention in human with T2D.
HSP70-1A is a protein member of the HSP70 family involved in protection of the proteome from stress. HSP70-1A ensures quality control of protein folding by targeting and direction of misfolded proteins for either re-folding or degradation.42 HSP70-1A interacts with CHIP and the HSP40 family proteins to promote ubiquitin-mediated protein degradation.27
The data reported here is in accord with other reports that HSP70 and 90 did not differ significantly from the controls though; conversely, HSP70 has been reported to be elevated in T2D though HSP90 did not differ.43 The level of HSP70-1A, a HSP70 family member, was lower in T2D than in controls, though not significantly so, in accord with those reporting lower HSP70 levels in diabetes,44 and with the return to euglycemia the levels decreased further. HSP90 and HSP70 expression levels have been linked with T2D;43 45 HSP70 levels have been reported to be lower in T2D, with a euglycemic clamp raising HSP70 expression while not influencing HSP90,45 suggesting that increased glucose levels may increase HSPs that are reversed when the glucose falls to normal. It has been noted that HSP70 can be glycated in a hyperglycemic environment that reduces its chaperone activity but it is unclear if that also affects plasma and tissue levels.46 Notably, circulating levels of HSP70 have also been reported to be higher in people who are insulin resistant in comparison to the healthy subjects and normalize after duodenal–jejunal bypass.47
It has been previously noted that gender difference may alter HSP levels, as was particularly seen in postmenopausal women,26 through the effect of estrogen via NO production on the HSP70 family. Here, HSP70-1A, a HSP70 family member, was lower at baseline in T2D and is thought to predispose to chronic inflammatory disease, obesity and T2D;26 indeed the negative correlation of HSP70-1A with BMI (here, higher in T2D subjects) shown here may in part account for this finding in patients with T2D. Whether glycemic variability may therefore have a greater impact on HSPs in postmenopausal women with diabetes requires further research, but it is recognized that women with diabetes have more serious complications than men.48 However, it should be noted that the subanalysis by gender in this study involved very few subjects and needs to be repeated on a much larger population to exclude false negative results.
The STRING analysis showed the close association and relationships between the differing HSPs and CHIP in this study, but only CHIP was related to UBE2G2 in the pathway, showing that the changes in CHIP may impact directly on UBE2G2, in accord with studies showing the close interaction between ubiquitin ligase CHIP and ubiquitin conjugating enzymes,49 though no correlation was seen here between CHIP and UBE2G2 in controls or T2D. The higher UBE2G2 in T2D at baseline would suggest that there was an increase in protein misfolding; however, baseline CHIP was lower, suggesting either that the close interaction between CHIP and the ubiquitin conjugating enzymes was disconnected or, more likely, that an alternative pathway was driving UBE2G2.
Only a few changes in HSPs were seen and this may be due to two possible scenarios. First, since it has been described that diabetic and obese subjects, as well as menopausal women have a poor heat shock response (low ability to increase HSP synthesis or release these proteins into the bloodstream), the reduced ability to produce a heat shock response may be reflected in the results presented here.50 Furthermore, it has been described that the duration of diabetes and the sum of comorbidities (obesity plus diabetes) show higher levels of extracellular HSPs (higher blood concentrations);26 51 therefore, these subjects may not respond with new HSP release after a glycemic “challenge.” Second, the change in blood glucose in this study was within the clinically relevant range anticipated in normal diabetes regulation and therefore, at most, a modest “glycemic” challenge, or, indeed, could be considered as not a challenge at all but rather a return to an optimal homeostatic glycemic state.
A limitation of this study is the measurement of HSP proteins that may not reflect tissue level expression. In addition, the approaching significance noted in response to euglycemia for HSP70-1A and HSPB1 in T2D relative to baseline may have actually reached significance with larger patient numbers.
These data have clinical importance as it may be seen that modest glucose fluctuation was associated with changes in HSPs and it may be that greater glucose excursions have greater impact on HSP levels. Therefore, changes in HSP level and function are clearly affected by glucose variability that, in turn, has been associated with mortality and macrovascular diabetes complications, perhaps through increased tissue damage mediated by OS; though the mechanisms are unclear, it may be mediated via HSP responses. Optimal diabetes control has been well recognized to “result in fewer disease-related symptoms and a reduced risk of late complications,”52 but does not obviate the risk or their development entirely, and a degree of glucose variability is inherent in diabetes treatment.
In future studies, it would be valuable to monitor plasma levels of other stress markers, such as cortisol, to determine their correlation and temporal relationship to the HSPs. It would also be interesting to determine whether manipulating the expression of HSPs via various means (genetic, pharmacological, diet, or physical activity) is feasible and if, thereby, modulation of IR and type 2 diabetes is possible. It would be valuable to investigate the HSP levels and responses following the use of pharmacological agents that may circumvent hypoglycemia while maintaining strict glycemic control, such as GLP-1 receptor agonists that are reported to have pleiotrophic effects on the unfolded protein response through a reduction in endoplasmic reticulum stress.53
In conclusion, HSP proteins involved in critical protein interactions were lower in diabetes, and DNAJB1 (HSP40) fell significantly with euglycemia, suggesting that HSPs are reacting to basal stress that can be improved in part by good glucose control and reduction of glucose variability.
Data availability statement
Data are available on reasonable request to the corresponding author.
Ethics statements
Ethics approval
The trial was approved by the North West-Greater Manchester East Research Ethics Committee (REC number:16/NW/0518), registered at www.clinicaltrials.gov (NCT03102801) and conducted according to the Declaration of Helsinki.
References
Footnotes
SLA and AEB are joint senior authors.
Contributors ASA, ASMM, and AEB analyzed the data and wrote the manuscript. AAQ contributed to study design, performed experiments, collected, analyzed, and interpreted data and edited the manuscript. TS supervised clinical studies and edited the manuscript. SLA contributed to study design, data interpretation and the writing of the manuscript. All authors reviewed and approved the final version of the manuscript. AEB is the guarantor of this work.
Funding The authors have not declared a specific grant for this research from any funding agency in the public, commercial or not-for-profit sectors.
Competing interests None declared.
Provenance and peer review Not commissioned; externally peer reviewed.