Article Text

Abstract
Introduction Diabetes-associated endothelial barrier function impairment might be linked to disturbances in Ca2+ homeostasis. To study the role and molecular mechanism of Orais–vascular endothelial (VE)-cadherin signaling complex and its downstream signaling pathway in diabetic endothelial injury using mouse aortic endothelial cells (MAECs).
Research design and methods The activity of store-operated Ca2+ entry (SOCE) was detected by calcium imaging after 7 days of high-glucose (HG) or normal-glucose (NG) exposure, the expression levels of Orais after HG treatment was detected by western blot analysis. The effect of HG exposure on the expression of phosphorylated (p)-VE-cadherin and VE-cadherin on cell membrane was observed by immunofluorescence assay. HG-induced transendothelial electrical resistance was examined in vitro after MAECs were cultured in HG medium. FD-20 permeability was tested in monolayer aortic endothelial cells through transwell permeability assay. The interactions between Orais and VE-cadherin were detected by co-immunoprecipitation and immunofluorescence technologies. Immunohistochemical experiment was used to detect the expression changes of Orais, VE-cadherin and p-VE-cadherin in aortic endothelium of mice with diabetes.
Results (1) The expression levels of Orais and activity of SOCE were significantly increased in MAECs cultured in HG for 7 days. (2) In MAECs cultured in HG for 7 days, the ratio of p-VE-cadherin to VE-cadherin expressed on the cell membrane and the FD-20 permeability in monolayer endothelial cells increased, indicating that intercellular permeability increased. (3) Orais and VE-cadherin can interact and enhance the interaction ratio through HG stimulation. (4) In MAECs cultured with HG, the SOCE activator ATP enhanced the expression level of p-VE-cadherin, and the SOCE inhibitor BTP2 decreased the expression level of p-VE-cadherin. (5) Significantly increased expression of p-VE-cadherin and Orais in the aortic endothelium of mice with diabetes.
Conclusion HG exposure stimulated increased expression of Orais in endothelial cells, and increased VE-cadherin phosphorylation through Orais–VE-cadherin complex and a series of downstream signaling pathways, resulting in disruption of endothelial cell junctions and initiation of atherosclerosis.
- atherosclerosis
Data availability statement
Data are available upon reasonable request.
This is an open access article distributed in accordance with the Creative Commons Attribution Non Commercial (CC BY-NC 4.0) license, which permits others to distribute, remix, adapt, build upon this work non-commercially, and license their derivative works on different terms, provided the original work is properly cited, appropriate credit is given, any changes made indicated, and the use is non-commercial. See: http://creativecommons.org/licenses/by-nc/4.0/.
Statistics from Altmetric.com
Significance of this study
What is already known about this subject?
The adherens junction of vascular endothelial (VE) cells disassembed is one of the important causes of hyperglycemia complicated vascular disease.
What are the new findings?
Store-operated Ca2+ entry (SOCE) and phosphorylated (p)-VE-cadherin are involved in the regulation of aortic endothelial barrier function under high-glucose (HG) stimulation.
Orais, key channel proteins of SOCE, interact with VE-cadherin, and the interactions are enhanced in HG-exposed mouse aortic endothelial cells.
In aortic endothelial cells, SOCE can regulate the expression of p-VE-cadherin, and p-VE-cadherin can regulate the permeability of endothelial cells.
How might these results change the focus of research or clinical practice?
Orais–VE-cadherin complex plays an important role in abnormal permeability of aortic endothelial cells caused by HG.
Targeting Orais–VE-cadherin complex could decrease the occurrence and development of atherosclerosis in patients with diabetes.
Introduction
Diabetes complications have a significant impact on patient’s health and quality of life. Patients with diabetes must control their blood glucose concentration and prevent the occurrence of diabetic vascular complications. Diabetic vascular complications often lead to atherosclerosis. Elevated blood glucose levels in patients with diabetes can lead to severe endothelial dysfunction, the pivotal mechanism involved in atherogenesis.1 Although a large number of studies have investigated diabetic vascular disease, its pathogenesis is still unclear and requires further exploration.
The vascular endothelium is a self-balancing tissue of the body that regulates vascular tension and structure, and damage or abnormalities in this tissue lead to vascular endothelial (VE) dysfunction. This dysfunction is mainly manifested as vascular tension dysregulation and abnormal vascular permeability, which then leads to a series of vascular complications. Endothelial junctions, which include tight junctions and adherens junctions, are critical in the formation and function of the vascular system. VE-cadherin is a VE-specific adherens junction protein that maintains VE cell polarity and integrity in conjunction with the tight junction protein regulatory system.2 3 VE-cadherin mediates calcium (Ca2+)-dependent intercellular adhesions.4 Ca2+ influx is a regulator of vascular permeability,5 and phosphorylation of VE-cadherin at tyrosine residues (Y731) can also increase vascular permeability.6 Some studies have found that the rat thoracic aorta endothelial cells cultured in high-glucose medium show significantly decreased expression level of VE-cadherin and increased permeability, which then lead to vascular dysfunction.7 Inhibition of Ca2+ influx or removal of extracellular Ca2+ can eliminate agonist-induced increase in cell permeability. For example, bradykinin and thrombin increase VE permeability by increasing the intracellular Ca2+ concentration.2 Taken together, the evidence indicates that VE-cadherin and Ca2+ play a crucial role in regulating endothelial permeability and may be the key molecular therapeutic targets for diabetic vascular disease.
Store-operated Ca2+ entry (SOCE) is a major Ca2+ influx pathway in most non-excitable cells.8 Stromal interaction molecule 1 (STIM1) and Ca2+ release-activated Ca2+ channel proteins 1–3 (Orai1–3) are key molecular proteins involved in SOCE.9 Some studies have reported that SOCE is associated with endothelial permeability, and knockdown of STIM1 protein expression significantly decreases the high-mobility group box 1 protein-induced endothelial hyperpermeability.10 However, the potential roles and the molecular mechanisms underlying SOCE in regulating endothelial cell permeability have yet to be elucidated.
Therefore, the primary aim of this study is to examine whether Orai proteins and VE-cadherin form signaling complexes, and if so, to determine the downstream signaling pathway associated with these complexes in diabetic endothelial injury. The overarching goals of this study were to provide a new theoretical basis for the repair of diabetic endothelial injury and to offer mechanistic insights into the pathological mechanisms of diabetic vascular disease to suggest a new target for its clinical treatment.
Materials and methods
Cell culture
The mouse aortic endothelial cell (MAEC) line was obtained from BEINA (Beijing, China) and cultured in Dulbecco’s Modified Eagle Medium (DMEM) with normal glucose (NG; D-glucose concentration, 5.6 mM) and containing 10% fetal bovine serum, added 1% penicillin and 1% streptomycin. MAECs were cultured at 37℃ in a humidity-controlled incubator with 5% CO2. Before the experiment began, the cells were typically divided into two groups. The experimental group was cultured with DMEM having high glucose (HG; D-glucose concentration, 25 mM). The control group was cultured with DMEM having NG (D-glucose concentration, 19.5 mM) plus α-mannitol (5.6 mM) to balance the osmotic pressure so that it was consistent with the experimental group. The specific conditions for each experiment are described in the figure legends.
Calcium imaging
MAECs were loaded with Fura-8-AM in DMEM with NG or HG and 0.02% Pluronic F127 (Invitrogen) for 30 min at room temperature in the dark. Excess Fura-8-AM was washed out by superfusion with a Ca2+-free solution containing (in mM) 118 NaCl, 4.7 KCl, 1.2 MgSO4, 1.2 KH2PO4, 25 NaHCO3 and 11.1 glucose at pH 7.4. Thereafter, MAECs were placed on the stage of an inverted fluorescence microscope (Nikon T200; Tokyo, Japan) and perfused with a Ca2+-free solution. Fura-8-AM was alternatingly excited at a wavelength of 488 nm using a Xenon lamp. Fluorescence emission was acquired at a wavelength of 510 nm. For each excitation wavelength, background fluorescence was subtracted, and the ratio of the emitted fluorescence (F1/F0) was calculated as a measure of the cytosolic Ca2+ concentration. For SOCE measurements, intracellular Ca2+ stores were emptied by rapid application of an inhibitor of Ca2+ reuptake, thapsigargin (TG; 2 µM) or by incubation with ATP (100 µM) for 10 min in a Ca2+-free solution. Thereafter, SOCE was measured by the application of 2 mM extracellular Ca2+ as previously described.11
Co-immunoprecipitation assay
After MAECs were lysed on ice with protein lysis buffer (1% Nonidet P-40, 150 mM NaCl, 20 mM Tris-HCl, pH 8.0, with the addition of a protease inhibitor cocktail), they were centrifuged at 12 000× g and 4°C for 20 min. Orai1–3 or VE-cadherin proteins were immunoprecipitated by incubating 800 μg of extracted protein with 5 µg of anti-Orai1–3 antibodies (ProteinTech Group, Chicago, Illinois, USA) or anti-VE-cadherin antibody (Affinity Biosciences, Ohio, USA), respectively, on a rocking platform overnight at 4℃. Protein A agarose was then added and incubated for an additional 3 hours at 4℃. The immunoprecipitates were washed with cell lysis solution, and cell lysates (100 µL) and loading buffer (25 µL) were added. Next, the sample was boiled at 100°C for 10 min. The resulting obtained supernatant was used for protein electrophoresis. For the immunoblots, all of the samples were fractionated by sodium dodecyl sulfate (SDS)-polyacrylamide gel electrophoresis using 15% agarose gels, transferred to polyvinylidene fluoride membranes, and probed with the indicated primary antibodies at a dilution of 1:200 in a phosphate-buffered saline (PBS; in mM: 137 NaCl, 2.7 KCl, 10 Na2HPO4, 1.8 KH2PO4, pH 7.4) containing 0.1% Tween-20 and 5% non-fat dry milk. Immunodetection was accomplished using horseradish peroxidase (HRP)-conjugated secondary antibody (1:5000, Affinity Biosciences) followed by an enhanced chemiluminescence plus detection system (Peiqing, Shanghai, China).
Extraction of membrane proteins and western blot analysis
Membrane proteins, specifically VE-cadherin and p-VE-cadherin, were isolated using a Membrane and Cytosol Protein Extraction Kit (Beyotime Biotechnology, China) following the manufacturer’s instructions. Cell lysates from MAECs were extracted with lysis buffer (in mM: 20 Tris, 150 NaCl, 1 EDTA, 1 EGTA, 1% Triton X-100, 0.1% SDS and 1% protease inhibitor cocktail; pH 7.4), and the protein concentration was determined using a BCA assay (Rayto, Shandong, China). For the immunoblots, the polyvinylidene difluoride membranes carrying the transferred proteins were incubated at 4℃ overnight with anti-Orai1–3, anti-VE-cadherin and anti-p-VE-cadherin Y731 antibodies (Affinity Biosciences) (all diluted 1:250) or with β-tubulin as a control (1:50 000, Affinity Biosciences). Immunodetection was conducted using HRP-conjugated antirabbit secondary antibodies (1:5000). Densitometry was performed using ImageJ analysis software, and intensities were normalized to those of β-tubulin.
Endothelial permeability assay
VE permeability was assessed using a transwell assay conducted as previously reported by Huang et al.12 In brief, MAECs were seeded on polyester membranes (pore size, 0.4 µm; Millipore, USA) in transwell inserts, placed in 24-well plates, and incubated for 24 hours to allow the growth of a confluent monolayer. The medium on the apical side of the transwell chamber was replaced with 200 μL of fluorescein isothiocyanate-dextran, 20 kDa (FD-20; Sigma, USA) solution (25 mg/mL in DMEM NG or HG medium). The transwell inserts were then moved into new wells with 500 µL of control medium containing the SOCE agonist ATP (100 μM) or the SOCE inhibitor BTP2 (10 μM). Thirty minutes after incubation, 30 μL of medium was aspirated from the apical or basolateral compartments to determine the FD-20 concentration. Samples were diluted with 270 μL PBS, and fluorescence was measured using a fluorescence microplate reader (Flexstation 3, Molecular Devices, USA) with an excitation/emission wavelength of 492/515 nm, a slit width of 1.5 nm for excitation and a slit width of 10 nm for emission. The permeability of the confluent monolayer is expressed as the fluorescence intensity of FD-20.
Transendothelial electrical resistance in vitro
The permeability of the MAECs was determined using confluent monolayers after the cells were cultured in NG or HG medium for 7 days. Measurements of transendothelial electrical resistance (TER) were performed using a Millicell-ERS (Electrical Resistance System) voltmeter (Millipore). The MAEC monolayers were treated with ATP (100 μM) or BTP2 (10 μM). The TER of the MAEC monolayers was calculated using the following equation: TER (Ω cm2 monolayer)=(average resistance of well–average resistance of blank well in Ω)×monolayer area (in cm2).13
Mouse model of type 2 diabetes
Sixteen male C57BL/6J mice (18–20 g, 4 weeks of age) were obtained from the Experimental Animal Center of Anhui Medical University and used in compliance with the US National Institutes of Health guideline (publication no. 8523). The mice were randomly placed in one of two groups: a normal control group (n=8) and a mouse model of type 2 diabetes group (n=8). Mice in the experimental group received a single intraperitoneal injection of streptozotocin (STZ, 40 mg/kg, dissolved in pH 4.5 citrate buffer; Biosharp). Control mice received an equivalent volume of citrate buffer. After the STZ injection, both groups were fed a standard mouse chow diet and were housed in a standard temperature-controlled (25±2℃) environment. Mice were considered a successful model of diabetes when their fasting blood glucose levels reached 16.7 mM, approximately 1 week after the STZ injection. Immunohistochemical assays were performed 8 weeks after the STZ injection.
Immunofluorescence analysis
MAECs (4×10⁴ cells) were seeded on cover glass. After treatment, the cells were washed three times with PBS and fixed using 4% paraformaldehyde (Ebiogo, Hefei, China). Cell membranes were permeabilized with 0.2% Triton X-100 (Beyotime Biotechnology, China) for 15 min and blocked with 3% bovine serum albumin (Beyotime Biotechnology) for 2 hours at room temperature. Primary rabbit anti-Orai1–3, anti-VE-cadherin or anti-p-VE-cadherin Y731 antibodies (diluted 1:200) were incubated with the cells overnight. Then Orai1–3, VE-cadherin and p-VE-cadherin Y731 were labeled using FITC-conjugated secondary antibodies (diluted 1:100; Invitrogen) via incubation for 2 hours. The nucleus of each cell was labeled with 4',6-diamidino-2-phenylindole (DAPI). The immunofluorescence signals were detected and images were captured using an LSM 880 confocal microscopy system (Zeiss, Germany).
Immunohistochemistry assay
Mouse thoracic aortas were perfused with PBS and fixed for 24 hours with 4% paraformaldehyde and embedded in paraffin. Paraffin sections of aortic ring segments were sliced to a thickness of 5 µm, dewaxed and washed with PBS three times. The sections were incubated with 3% hydrogen peroxide solution at 37℃ for 30 min, a citrate antigen retrieval solution for 20 min and 5% bovine serum albumin in PBS for 1 hour at room temperature. The sections were then incubated with anti-Orai1–3, anti-VE-cadherin or anti-p-VE-cadherin Y731 antibodies (diluted 1:250) overnight at 4℃. After undergoing three washes with PBS, the sections were incubated with a HRP-labeled secondary antibody. Sufficient DAPI to cover the section was added to label cell nuclei. The rinsed sections were counterstained with hematoxylin for 15 s and then mounted onto glass slides. Histological images were obtained using a digital camera mounted on an Olympus BX51 microscope.
Statistical analysis
Summary data are reported as means±SEM. Statistical analyses were performed using GraphPad Prism V.5.0. Experimental results were compared using t-tests to correct for comparison. Two-sided p values <0.05 were considered statistically significant.
Results
Effect of HG exposure on SOCE in MAECs
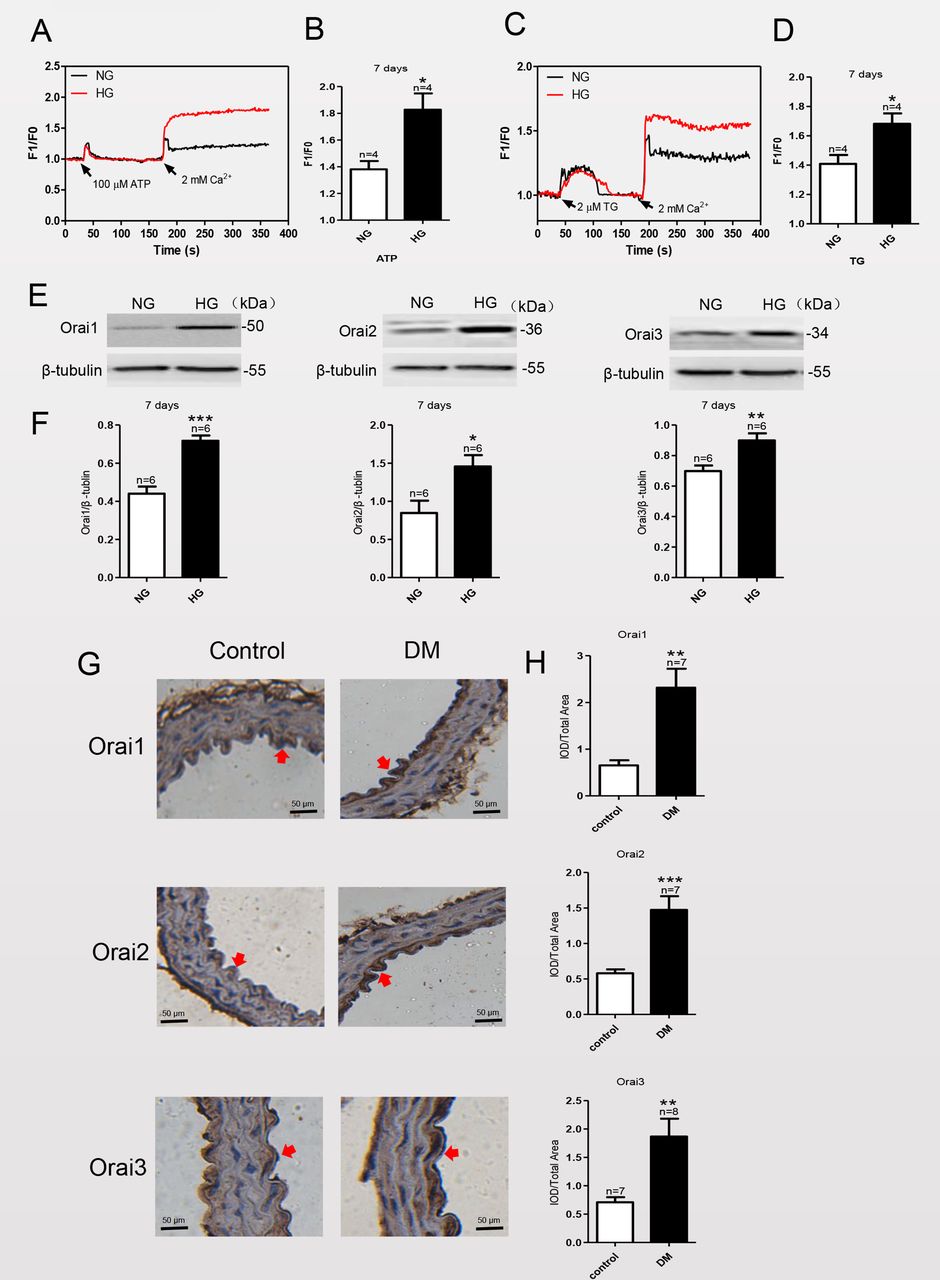
Studies have shown that culturing certain cell types, such as neonatal rat cardiomyocytes and mesangial cells, with a HG medium can significantly enhance SOCE.14 15 To investigate the effect of HG exposure on SOCE in MAECs, we used a HG medium (containing 25 mM D-glucose) to mimic diabetic hyperglycemia in vitro and compared the effects with those cultured in NG medium (19.5 mM D-glucose plus 5.6 mM α-mannitol) as a control. After culturing MAECs in NG or HG medium for various times, we examined the level of SOCE by using Ca2+ imaging and the expression levels of Orai1–3 proteins by using immunoblotting. Treatment of MAECs with the sarcoplasmic/endoplasmic reticulum (ER) Ca2+-ATPase inhibitor TG (2 μM) or with ATP (100 μM) resulted in a rapid rise in intracellular Ca2+ levels, consistent with the depletion of ER Ca2+ stores. As shown in figure 1A,C, subsequent addition of 2 mM Ca2+ to the extracellular bath solution triggered an increase in the Ca2+ level, consistent with Ca2+ influx from the extracellular solution as SOCE. The Ca2+ influx of MAECs cultured in HG for 7 days was markedly increased and sustained relative to those cultured in NG (figure 1B,D); however, the SOCE of MAECs cultured in HG for 1, 3 or 14 days did not change compared with those cultured in NG for the same amount of time (online supplemental figure 1). These results suggested that HG exposure increased SOCE of MAECs. We next investigated whether HG exposure enhanced the expression levels of key proteins that mediate SOCE.
Supplemental material

Store-operated calcium entry (SOCE) activity and Orai1–3 protein expression levels are significantly increased in mouse aortic endothelial cells (MAECs) cultured in high glucose (HG) for 7 days and in thoracic aorta endothelial cells of streptozotocin (STZ)-induced mice with diabetes. (A, C) Representative traces and (B, D) summary data showing the maximum increase in SOCE in HG-cultured MAECs. After treatment of MAECs with either 2 µM thapsigargin (TG) or 100 µM ATP for 10 min, application of 2 mM Ca2+ induces significant increase in the intracellular Ca2+ concentration through SOCE. (E) Representative western blot analysis images and (F) summary data showing Orai1, Orai2 and Orai3 expression levels in MAECs cultured in normal glucose (NG) plus mannitol or HG medium. (G) Representative images of thoracic aorta endothelium immunostaining (brown; eg, red arrowheads) for expression levels of Orai1–3 in a mouse model of diabetes mellitus (DM) and control mice. Magnification, ×200. (H) Quantification of Orai1–3 protein expression levels in the thoracic aorta endothelium of a mouse model of mice with diabetes and control mice. β-Tubulin was used as the loading control. IOD, integrated optical density; values, means±SEM (n=6–8 samples). *P<0.05, **p<0.01, ***p<0.001 compared with NG-cultured cells or control groups.
Orai proteins (Orai 1, 2 and 3) distributed on the membrane are the pore-forming proteins of store-operated Ca2+ channels and are key components of SOCE.16 As shown in figure 1E,F, compared with MAECs cultured in NG, HG exposure significantly increased the expression levels of the Orai proteins after 7 days of culture. By contrast, expression levels of Orai1–3 proteins were not significantly changed in MAECs cultured in HG compared with NG for 1, 3 or 14 days (online supplemental figure 2). Orai1–3 expression levels were significantly increased in thoracic aorta endothelium of STZ-induced mice with diabetes (figure 1G,H).
Effect of HG exposure on expression levels of VE-cadherin and p-VE-cadherin proteins and intercellular permeability in MAECs
VE-cadherin is an adherens junction protein between endothelial cells, and its internalization is related to disassembly of cell-to-cell connections, which leads to increased cell-to-cell permeability.17 VE-cadherin tyrosine phosphorylation has recently been shown to be the key to promoting VE-cadherin internalization.18 19 To explore the effect of HG exposure on VE-cadherin and p-VE-cadherin expression, western blot analysis was carried out after MAECs were cultured in HG for 1, 3, 7 or 14 days. Membrane proteins were isolated from MAECs using a commercial kit, and then western blot analysis was conducted to detect the expression levels of VE-cadherin and p-VE-cadherin (Tyr731) on the cell membrane. As shown in figure 2A,B, the ratio of p-VE-cadherin to VE-cadherin expressed on the cell membrane increased after HG treatment for 7 days, indicating that p-VE-cadherin expression increased on the cell membrane. By contrast, the ratio of p-VE-cadherin to VE-cadherin expressed on the cell membrane were not significantly changed in MAECs cultured in HG compared with NG for 1, 3 or 14 days (online supplemental figure 3). Immunofluorescence experiment was carried out after MAECs were cultured in HG for 7 days. The results of immunofluorescence assays (figure 2C–F) also showed that after HG culture, the expression of VE-cadherin on the cell membrane was not significantly changed, but the expression of p-VE-cadherin was significantly increased. The p-VE-cadherin expression level was also significantly increased in thoracic aorta endothelium of STZ-induced mice with diabetes, whereas the expression level of VE-cadherin was not significantly changed (figure 2G,H). These experimental results indicated that HG exposure increases the expression of p-VE-cadherin on MAEC membranes, thereby enhancing the permeability of cells.
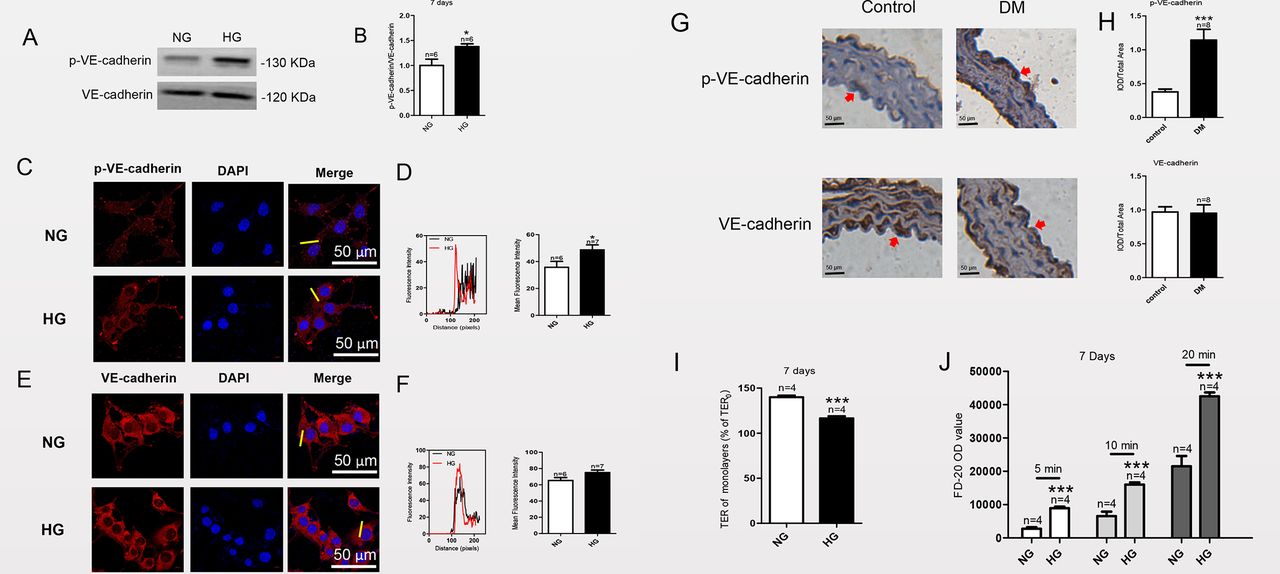
Phosphorylated vascular endothelial (p-VE)-cadherin protein expression level is markedly increased in mouse aortic endothelial cells (MAECs) cultured in high glucose (HG) for 7 days and in thoracic aorta endothelial cells of streptozotocin (STZ)-induced mice with diabetes with no change in VE-cadherin expression level; HG exposure promotes intercellular permeability in MAECs. Representative western blot analysis images (A) and summary data (B) showing p-VE-cadherin and VE-cadherin expression levels in MAECs cultured in normal glucose (NG) or HG medium. (C, E) MAECs were cultured in HG medium for 7 days and then fixed and incubated with anti-p-VE-cadherin antibody (red), anti-VE-cadherin antibody (red) and 4',6-diamidino-2-phenylindole (DAPI) (blue; cell nuclei) and then imaged with a confocal microscope. Representative confocal microscopy images and the final merged images are shown (C, E). (D, F) Fluorescence intensity profiles and summary data for anti-p-VE-cadherin antibody and anti-VE-cadherin antibody in the regions delineated by the corresponding yellow line shown in (C) and (E). (G) Representative images of thoracic aorta endothelium immunostaining (brown; eg, red arrowheads) for expression levels of p-VE-cadherin and VE-cadherin in a mouse model of diabetes mellitus (DM) and control mice. Magnification, ×200. (H) Quantification of p-VE-cadherin and VE-cadherin expression levels in the thoracic aorta endothelium of a mouse model of diabetes and control mice. IOD, integrated optical density. (I) HG-induced transendothelial electrical resistance (TER) was examined in vitro after MAECs were cultured in HG medium for 7 days. (J) FD-20 permeability was tested in a monolayer of aortic endothelial cells using a transwell permeability assay. OD, optical density; values, means±SEM (n=4–8 samples). *P<0.05, ***p<0.001 compared with NG-cultured cells or control groups.
These results suggested that HG exposure enhanced SOCE activity and expression of p-VE-cadherin on membranes of MAECs and that effect was time dependent. Therefore, subsequent experiments examining underlying mechanisms used MAECs cultured in HG medium for 7 days.
TER is an index used to evaluate endothelial barrier function.12 In a monolayer of aortic endothelial cells, HG exposure decreased TER compared with that in the control group (figure 2I). This result indicated that HG exposure enhances the permeability of an aortic endothelial cell monolayer.
We also detected the permeability of FD-20 in these cells to further assess the role of VE-cadherin phosphorylation in endothelial barrier function. As shown in figure 2J, HG exposure significantly increased the FD-20 permeability in a monolayer of aortic endothelial cells. This result also indicated that HG exposure enhances the permeability of MAECs.
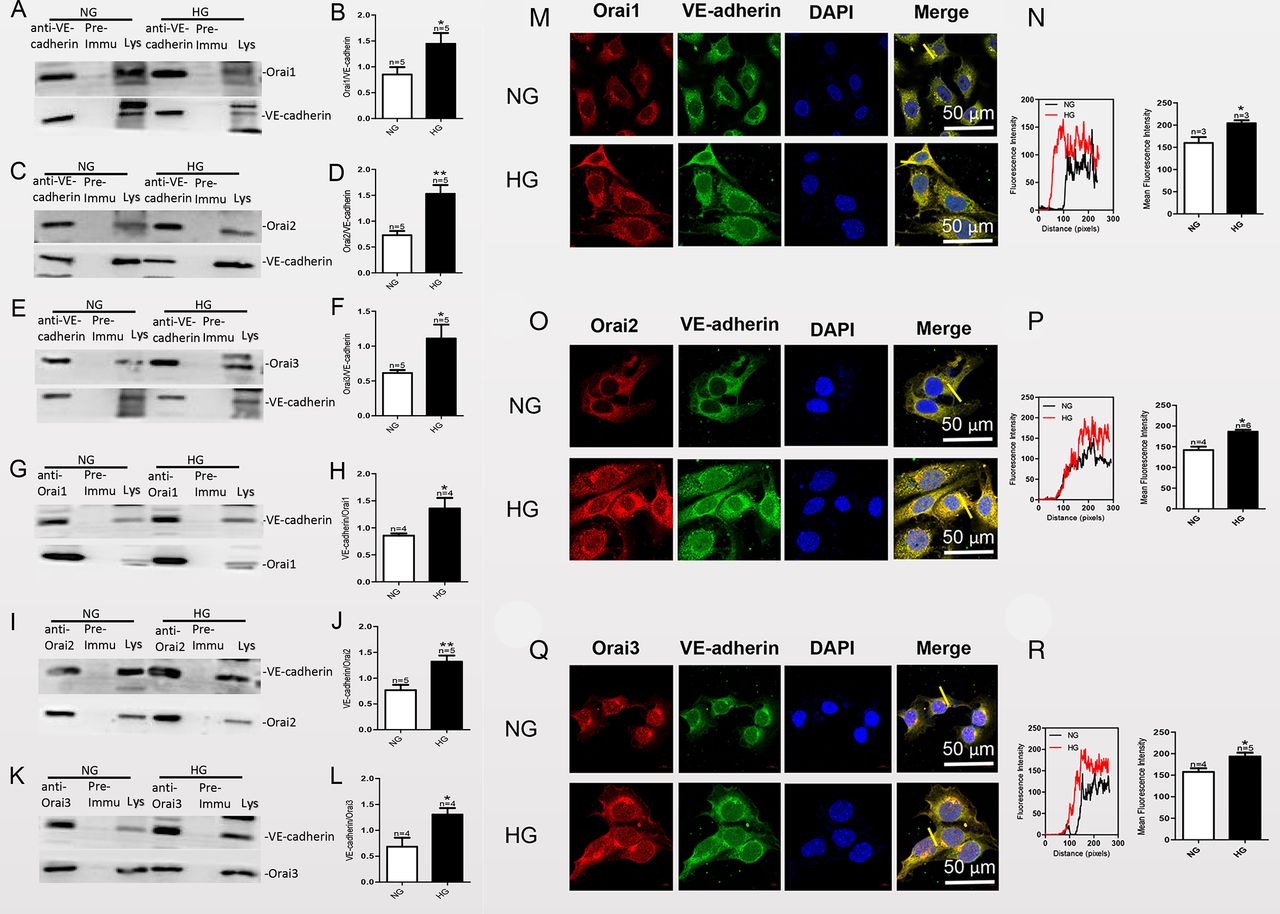
Physical interaction between Orai proteins and vascular endothelial (VE)-cadherin in mouse aortic endothelial cells (MAECs) examined by co-immunoprecipitation (co-IP) and immunofluorescence assays. (A, C, E) MAECs were cultured in high-glucose (HG) or normal-glucose (NG) medium for 7 days and then subjected to immunoprecipitation (IP). Assays positive for Orai 1, 2 or 3 protein were used to pull down VE-cadherin. (G, I, K) For reverse co-IPs, IP assays positive for VE-cadherin were used to pull down Orai 1, 2 or 3. Lys, lysate. (B, D, F, H, J, L) Summary data showing the statistical results of the corresponding co-IPs. (M, O, Q) Representative confocal microscopy images showing co-localization analysis of anti-Orai 1, 2 or 3 antibodies (red) and anti-VE-cadherin antibody (green). MAECs were cultured in HG medium for 7 days and then fixed and incubated with anti-Orai1, 2 or 3 antibody (red), anti-VE-cadherin antibody (green) and 4',6-diamidino-2-phenylindole (DAPI) (blue; nuclear stain) and then imaged by confocal microscopy. Representative confocal microscopy images and the final merged images are shown. (N, P, R) Fluorescence intensity profiles and summary data of anti-Orai1–3 antibodies and anti-VE-cadherin antibody in the regions delineated by the corresponding yellow line in (M), (O) and (Q). Co-localization area per cell was quantified by ImageJ. Values are means±SEM (n=3–6 samples). *P<0.05, **p<0.01 compared with the values of NG cultured cells.
Physical association of VE-cadherin and Orai channels in MAECs, and the effect of HG exposure on this association
Because we found that HG exposure enhanced the expression levels of Orai proteins and the phosphorylation of VE-cadherin at Y731, we performed immunoprecipitation and immunofluorescence co-localization experiments to detect whether there are physical interactions between VE-cadherin and the Orai proteins in MAECs, and the effect of HG exposure on their interactions. In co-immunoprecipitation (co-IP) experiments, the anti-VE-cadherin antibody pulled down Orai1, 2 or 3 in protein lysates freshly prepared from MAECs (figure 3A,C,E). Furthermore, the anti-Orai1, 2 or 3 antibody reciprocally pulled down VE-cadherin (figure 3G,I,K). In control experiments which immunoprecipitation was performed with IgG purified from preimmune serum, no immunoreactive band was observed. In addition, following HG exposure of the cells for 7 days, the ratio of the interactions between VE-cadherin and Orai1, 2 or 3 significantly increased (figure 3B,D,F,H,J,L). The selective interaction of VE-cadherin with Orai1, 2 or 3 was supported by double immunofluorescence assays. Immunofluorescence signals for VE-cadherin and Orai1, 2 or 3 were observed in MAECs cultured in NG or HG medium. Overlaying the VE-cadherin signal (green) with that of the Orai 1, 2 or 3 signal (red) showed clear co-localization (yellow) of VE-cadherin and Orai 1, 2 or 3 (figure 3M,O,Q) in the plasma membrane and cytosol. In agreement with our co-IP data, HG exposure increased the strength of the signals for VE-cadherin and Orai1, 2 or 3 as well as the merged signal, indicating co-localization of VE-cadherin and Orai1, 2 or 3 in MAECs (figure 3N,P,R). Taken together, these data indicated that VE-cadherin physically associates with Orai1, 2 or 3 in MAECs, and that HG exposure increases the interactions between VE-cadherin and Orai1, 2 or 3.
Effect of SOCE on expression level of p-VE-cadherin protein on the cell membrane and cell-cell permeability in MAECs cultured in HG medium
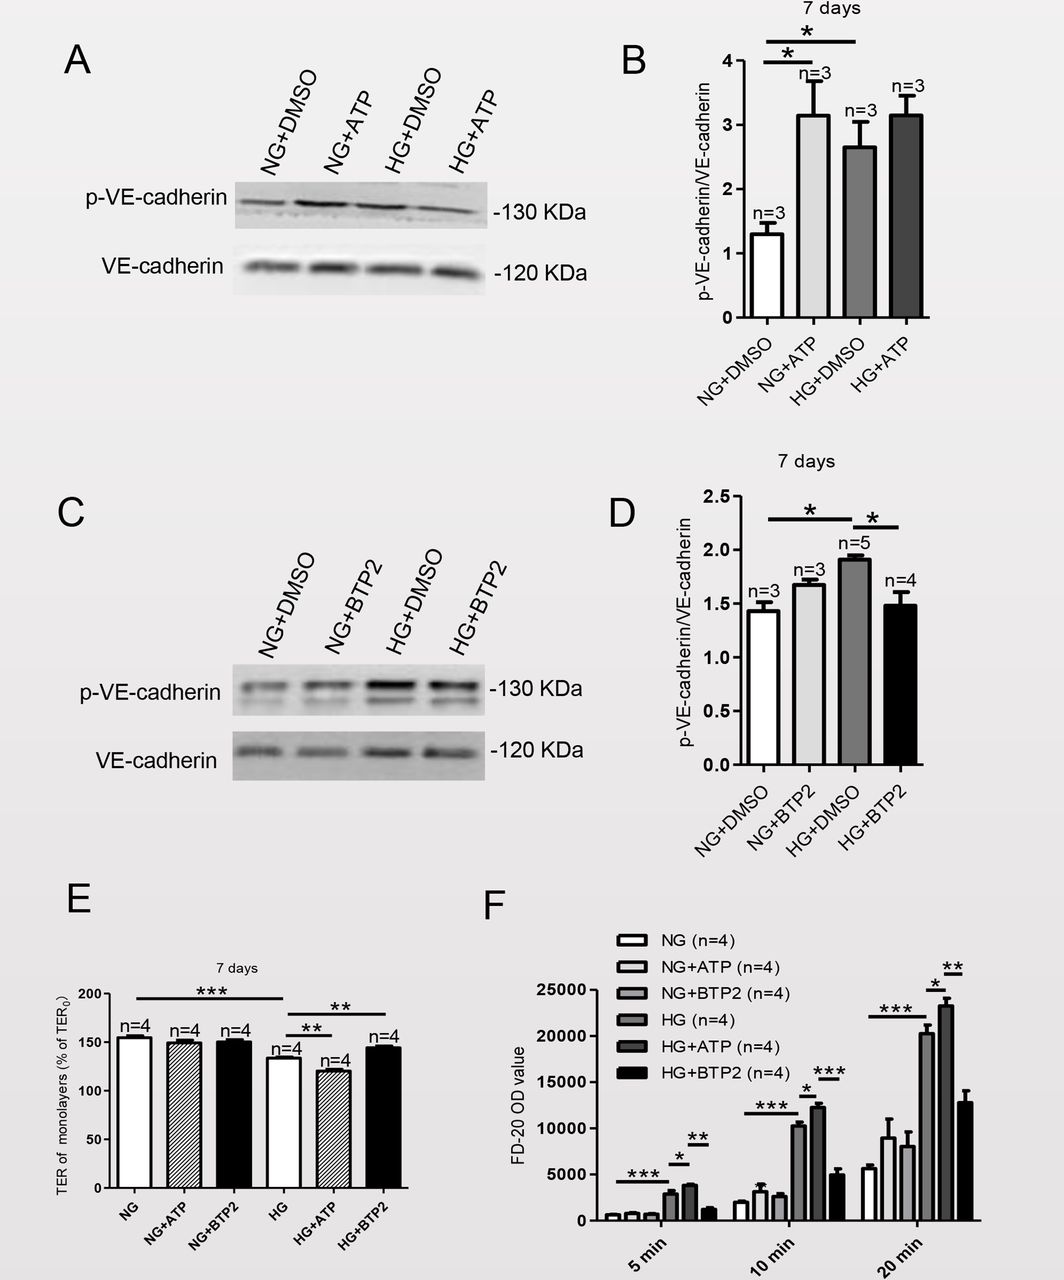
Phosphorylation of VE-cadherin on serine and tyrosine residues in vitro and in vivo has been shown to stimulate its internalization, resulting in an increase in vascular permeability.20–22 Therefore, we next assessed the functional relationship between VE-cadherin and the Orai proteins and the effect of SOCE on the expression of p-VE-cadherin after MAECs were cultured in HG for 7 days. To examine whether there was association between SOCE and p-VE-cadherin, we assessed the effects after application of the SOCE activator ATP and the SOCE inhibitor BTP2. As shown in figure 4A,B, ATP increased the expression level of p-VE-cadherin. Figure 4C,D show that BTP2 decreased the expression level of p-VE-cadherin. In addition, figure 4E shows that ATP decreased and BTP2 increased TER in HG-cultured MAECs. Furthermore, ATP increased FD-20 permeability, whereas BTP2 decreased FD-20 permeability of MAECs cultured in either NG or HG (figure 4F). These data indicated that VE-cadherin and the Orai proteins form a signaling complex that can regulate the expression level of p-VE-cadherin to affect cell permeability.

Store-operated calcium entry (SOCE) affects the expression level of phosphorylated vascular endothelial (p-VE)-cadherin protein and the endothelial barrier in mouse aortic endothelial cells (MAECs) cultured in high-glucose (HG) medium. After adding the SOCE agonist ATP (100 µM) or the SOCE inhibitor BTP2 (10 µM) or the vehicle dimethyl sulfoxide (DMSO), the expression levels of p-VE-cadherin in MAECs cultured in HG or normal-glucose (NG) medium for 7 days were detected. Representative western blot analysis images (A, C) and summary data (B, D). (E, F) Summary data showing transendothelial electrical resistance (TER) and FD-20 permeability in MAECs cultured in HG or NG medium for 7 days in the presence or absence of the SOCE agonist ATP (100 μM) or the SOCE inhibitor BTP2 (10 μM). Values are means±SEM (n=3–5 samples). *P<0.05, **p<0.01, ***p<0.001 compared with NG cultured cells or control groups.
Discussion
The major findings of this study were that Orai1–3 and VE-cadherin physically interact and that these signaling complexes play important functional roles in regulating endothelial dysfunction (such as adherens junction protein expression and barrier function) of MAECs cultured in HG medium. Diabetes is a major risk factor for atherosclerosis and cardiovascular disease.1 Endothelial injury is the pivotal mechanism involved in atherogenesis.1 Elevated blood glucose levels in patients with diabetes can lead to severe endothelial dysfunction. The endothelium acts as a permeability barrier, playing an important barrier function in the body. This barrier is mainly composed of endothelial cells, and the direct connection between endothelial cells is through connexins.4 VE-cadherin is a specific marker of endothelial cells that is mainly distributed at the junction of endothelial cells, making the connection between endothelial cells more stable and stronger. It is an indispensable molecule in regulating the barrier function of VE cells.23 In addition, VE-cadherin can form complexes with F-actin and β-catenin and can interact with signaling proteins (such as phosphoinositide 3-kinase, Src, protein kinase C) that are involved in important signaling pathways and gene expression regulation between VE cells. Thus, VE-cadherin is one of the most critical nodes in the regulation of connections between VE cells.24–26
The destruction of intercellular connexins occur in the early stage of enhanced permeability of vascular endothelium,27 which is one of the causes of endothelial dysfunction. The internalization of VE-cadherin leads to the destruction of tissue at the junction between VE cells, thereby increasing the permeability of VE cells.28 29 The tyrosine phosphorylation of VE-cadherin is involved in subtle changes in VE permeability.30 31 VE-cadherin tyrosine phosphorylation is the key to promoting VE-cadherin internalization, and Tyr731 has been shown to be involved in VE-cadherin internalization.17 18 In our study, we found that MAECs cultured in HG medium increased their expression of p-VE-cadherin (Tyr731) on the cell membrane.
Inflammatory mediators combined with G protein-coupled receptors increase endothelial permeability by increasing the intracellular Ca2+ concentration.32 SOCE activated by STIM1 is essential for tyrosine phosphorylation of VE-cadherin and therefore form a mechanism underlying increased endothelial permeability.6 The Orai channel is a four-transmembrane Ca2+ channel protein located on the cell membrane. It is divided into three subtypes: Orai1, Orai2 and Orai3. The effect of these Orai proteins on vascular permeability and the undergirding mechanism have not been previously reported. The present study found that the expression levels of all three Orai proteins increased in HG-cultured MAECs, and this increase was associated with an increase in the SOCE mediated by the Orai proteins. In addition, we found that the expression of p-VE-cadherin on the cell membrane was also increased. VE-cadherin and Orai proteins interacted with each other, and this interaction was enhanced after MAECs were cultured in HG.
In order to accurately and rapidly regulate physiological processes, signaling components are located near one another and may interact to form signaling complexes. The present study presented evidence that Orai proteins interacted with VE-cadherin and formed a Ca2+ signaling complex, and that both are concentrated at cell membranes where cells contact each other. TG or ATP can deplete intracellular Ca2+ stores and activate the Ca2+ influx mediated by Orai proteins. Our studies examining these molecular mechanisms found that ATP significantly increased the expression of p-VE-cadherin on the cell membrane, whereas the SOCE inhibitor BTP2 significantly decreased the expression of p-VE-cadherin on the cell membrane.
In the present study, TER in a monolayer of MAECs cultured in either NG or HG was lower in the group treated with ATP and higher in the group treated with BTP2. We also found that HG exposure significantly increased FD-20 permeability in the monolayer of endothelial cells, whereas treatment with BTP2 decreased FD-20 permeability. In addition, FD-20 permeability was higher in HG-exposed MAECs treated with ATP. These results indicated that tyrosine phosphorylated VE-cadherin at position 731 increased endothelial permeability. Our research also suggested that Orai–VE-cadherin signaling complexes were necessary for the adherens junction and permeability regulation of barrier functions. The findings of this study suggest that prevention and treatment of vascular complications in patients with diabetes may be achieved by targeting the Orai–VE-cadherin signaling complexes.
Our results also strongly suggest that the Ca2+ signal mediated by Orai proteins may have an important role in regulating the distribution, function and cell barrier function of p-VE-cadherin on the cell membrane. It has been reported that protein kinase Cɑ (PKCɑ) can phosphorylate VE-cadherin and cause VE-cadherin link breakage and internalization.33 Combining our experimental findings and those of previous studies, we speculate that HG exposure induced an elevated cytosolic Ca2+ concentration via enhanced Orai proteins expression, SOCE activity and interactions between Orai proteins and VE-cadherin, inducing PKC activation. Activated PKCɑ can phosphorylate tyrosine residues in the cytosolic C-731 terminal region of VE-cadherin to promote endothelial barrier dysfunction.
Conclusion
Based on our main findings, we propose a model (figure 5) in which PKCɑ is activated by the Orai–VE-cadherin signaling complex under HG exposure. Subsequently, PKCɑ induces VE-cadherin phosphorylation to disassemble adherens junctions and increase endothelial permeability. Therefore, the Orai–VE-cadherin signaling complex leads to endothelial dysfunction by disrupting the barrier function.

Schematic diagram showing the proposed Orai–Ca2+–vascular endothelial (VE)-cadherin signaling complex transduction pathway. The model proposes that Orai proteins and VE-cadherin regulate endothelial cell barrier function patterns. (1) Orai proteins interact with VE-cadherin, and their interaction were enhanced by high-glucose (HG) stimulation; (2) Orai-mediated calcium (Ca2+) influx activates protein kinase C (PKC) alpha. PKCɑ induces phosphorylation (p) of VE-cadherin to lead to its internalization and degradation and causing the loss of its connective and adhesive functions. MAECs, mouseaortic endothelial cells.
Data availability statement
Data are available upon reasonable request.
Ethics statements
Ethics approval
The protocol for the use of mice was approved by the Animal Experimentation Ethics Committee of Anhui Medical University.
Acknowledgments
The authors thank the Central Laboratory of Longgang District People’s Hospital for valuable help with this study.
References
Supplementary materials
Supplementary Data
This web only file has been produced by the BMJ Publishing Group from an electronic file supplied by the author(s) and has not been edited for content.
Footnotes
YW, SB and YY are joint first authors.
YW, SB and YY contributed equally.
Contributors YW, SB, YY and JD planned the study. SB, YW, WHo, YY and JZ performed most of the experiments and analyzed/discussed the data together with SB, JD, HF, YD and WHe. YW and SB drafted the manuscript; all authors provided critical intellectual input. All authors read and approved the final manuscript. JD is the guarantor of this work and, as such, has full access to all the data in the study and takes responsibility for the integrity of the data and the accuracy of the data analysis.
Funding The study was supported by grants from the National Natural Science Foundation of China (grant nos. 81972539, U1732157, 31701162, 81570403 and 81371284), the Natural Science Foundation of Anhui Province Department of Education (grant nos. KJ2018A0974 and KJ2017A178), the Anhui provincial Natural Science Foundation (1908085QC131) and Grants for Scientific Research of BSKY (XJ201726) from Anhui Medical University.
Competing interests None declared.
Provenance and peer review Not commissioned; externally peer reviewed.
Supplemental material This content has been supplied by the author(s). It has not been vetted by BMJ Publishing Group Limited (BMJ) and may not have been peer-reviewed. Any opinions or recommendations discussed are solely those of the author(s) and are not endorsed by BMJ. BMJ disclaims all liability and responsibility arising from any reliance placed on the content. Where the content includes any translated material, BMJ does not warrant the accuracy and reliability of the translations (including but not limited to local regulations, clinical guidelines, terminology, drug names and drug dosages), and is not responsible for any error and/or omissions arising from translation and adaptation or otherwise.