Article Text

Abstract
Introduction Hypoglycemia is the most common serious adverse effect of diabetes treatment and a major cause of medication-related hospitalization. This study aimed to identify trends and predictors of hospital utilization for hypoglycemia among patients with type 2 diabetes using electronic health record data pooled from six academic health systems.
Research design and methods This retrospective open cohort study included 549 041 adults with type 2 diabetes receiving regular care from the included health systems between 2009 and 2019. The primary outcome was the yearly event rate for hypoglycemia hospital utilization: emergency department visits, observation visits, or inpatient admissions for hypoglycemia identified using a validated International Classification of Diseases Ninth Revision (ICD-9) algorithm from 2009 to 2014. After the transition to ICD-10 in 2015, we used two ICD-10 code sets (limited and expanded) for hypoglycemia hospital utilization from prior studies. We identified independent predictors of hypoglycemia hospital utilization using multivariable logistic regression analysis with data from 2014.
Results Yearly rates of hypoglycemia hospital utilization decreased from 2.7 to 1.6 events per 1000 patients from 2009 to 2014 (p-trend=0.023). From 2016 to 2019, yearly event rates were stable ranging from 5.6 to 6.6, or 6.3 to 7.3, using the limited and expanded ICD-10 code sets, respectively. In 2014, the strongest independent risk factors for hypoglycemia hospital utilization were chronic kidney disease (OR 2.86, 95% CI 2.33 to 3.57), ages 18–39 years (OR 2.43 vs age 40–64 years, 95% CI 1.78 to 3.31), and insulin use (OR 2.13 vs no diabetes medications, 95% CI 1.67 to 2.73).
Conclusions Rates of hypoglycemia hospital utilization decreased from 2009 to 2014 and varied considerably by clinical risk factors such that younger adults, insulin users, and those with chronic kidney disease were at especially high risk. There is a need to validate hypoglycemia ascertainment using ICD-10 codes, which detect a substantially higher number of events compared with ICD-9.
- diabetes mellitus
- type 2
- hospitalization
Data availability statement
Data are available in a public, open access repository. A deidentified database will be prepared and submitted to the NIDDK Central Repository. Included will be documentation including protocols, forms, and data dictionaries. Access is guided by the NIDDK Central Repository policy.
This is an open access article distributed in accordance with the Creative Commons Attribution Non Commercial (CC BY-NC 4.0) license, which permits others to distribute, remix, adapt, build upon this work non-commercially, and license their derivative works on different terms, provided the original work is properly cited, appropriate credit is given, any changes made indicated, and the use is non-commercial. See: http://creativecommons.org/licenses/by-nc/4.0/.
Statistics from Altmetric.com
Significance of this study
What is already known about this subject?
Hypoglycemia is a major cause of hospital utilization for patients with diabetes, but there are little recent real-world data regarding its temporal trends and predictors.
What are the new findings?
Yearly rates of hospital utilization for hypoglycemia decreased significantly from 2009 to 2014.
Rates of hospital utilization for hypoglycemia were approximately three times higher using International Classification of Diseases Tenth Revision (ICD-10) compared with ICD-9 diagnosis codes, likely due to differences in coding.
The strongest independent risk factors for hypoglycemia hospitalization were younger age, insulin use, and chronic kidney disease.
How might these results change the focus of research or clinical practice?
Clinical risk factors can help identify populations at high risk for hypoglycemia hospital utilization to target prevention efforts. There is a need to validate hypoglycemia ascertainment using ICD-10 codes.
Introduction
Hypoglycemia is the most common serious adverse effect of diabetes treatment, and a major limiting factor in achieving glycemic control.1 2 Hypoglycemia is predominantly caused by treatment with insulin or insulin secretagogues (sulfonylurea or meglitinide medications).2–4 Hypoglycemia is defined as blood glucose <70 mg/dL and occurs on a spectrum of severity ranging from asymptomatic to causing cognitive symptoms requiring the assistance of another person (severe hypoglycemia).3 Severe hypoglycemia may result in the utilization of emergency medical services including emergency department visits and/or hospital admission. Severe hypoglycemia and resultant hospital utilization are associated with serious adverse health outcomes including vascular events, accidental injury, cognitive impairment, and mortality.5–8
Recent data evaluating the burden of severe hypoglycemia among patients with type 2 diabetes are lacking. Prior studies that examined hospital utilization for hypoglycemia used insurance claims or electronic health record (EHR) data.1 9–12 These studies found varying incidence rates for hypoglycemia hospital utilization ranging from 1 to 16 events per 1000 person-years, likely due to differences in the definition of hypoglycemia used and population included.1 9–12 Notably, prior studies were inconsistent in the inclusion of patients with type 1 diabetes who have different physiology and an absolute requirement for insulin, resulting in higher rates of hypoglycemia than patients with type 2 diabetes.13–16 Further, the transition from diagnosis coding using the International Classification of Diseases, Ninth Revision (ICD-9) to the Tenth Revision (ICD-10) was required by law to occur before 15 October 2015. There is a lack of recent data examining hypoglycemia hospital utilization ascertained by ICD-10 codes.17
It is important to understand the populations who are at high risk for severe hypoglycemia for two key reasons. First, a patient’s risk for hypoglycemia is a key clinical consideration for choosing diabetes medications and treatment targets.2 18 Second, identifying patient populations at higher risk for hypoglycemia is necessary to develop targeted interventions and resources to prevent these outcomes in the most vulnerable patients.19–22
In this study, we aimed to determine temporal trends and predictors of hospital utilization for hypoglycemia within a large cohort of adults with type 2 diabetes from multiple academic health systems spanning the ICD-9 to ICD-10 transition.
Methods
Study design and data source
This retrospective open cohort study of adults with type 2 diabetes was conducted using the PaTH Towards a Learning Health System (PaTH) clinical data research network.23 24 PaTH is one of 11 clinical data research networks that comprise PCORnet, a national network for patient-centered outcomes research funded by the Patient-Centered Outcomes Research Institute. This study contains data from six academic health systems in three US states (Maryland, Pennsylvania, and Utah): Penn State Hershey Medical Center, University of Pittsburgh Medical Center, Temple Health System, Johns Hopkins Health System, the University of Utah, and Geisinger Health System. The data research network includes the patients’ deidentified EHR data, insurance claims data, biospecimen results, and patient-reported outcome data. Included health systems use either the Cerner (Penn State and University of Pittsburgh inpatient) or Epic EHRs (all others). EHR data were encoded using standard healthcare terminologies and combined using the Common Data Model.25 This study used PaTH data from 1 January 2009 through 31 December 2019.
Study population
The population for this analysis was included on a yearly basis by applying eligibility criteria for each calendar year from 2009 through 2019. Individuals were included if they were aged 18 years or older, had at least two ambulatory primary care visits or endocrinology visits in a PaTH health system during three consecutive years, and had type 2 diabetes. To identify patients with type 2 diabetes, we first identified those with diabetes mellitus of any subtype using the SUrveillance, PREvention, and ManagEment of Diabetes Mellitus (SUPREME-DM) criteria, adapted to our data source.11 26 Patients with diabetes met the following criteria: one or more inpatient diagnosis codes for diabetes mellitus, or two or more of any of the following occurring on separate days, no more than 2 years apart: (1) a diagnosis code for diabetes mellitus in an ambulatory office visit; (2) dispensing of a diabetes medication (unless the medication was metformin, a thiazolidinedione, or exenatide and no other criteria were met); (3) hemoglobin A1c (HbA1c) ≥6.5%; (4) random plasma glucose ≥200 mg/dL. We did not use the SUPREME-DM criteria for fasting plasma glucose and 2-hour oral glucose tolerance test (OGTT) because we could not reliably ascertain fasting status and OGTT data. For diabetes diagnoses, we used ICD-9 code 250.xx, or ICD-10 codes E10.x and E11.x. After other inclusion criteria were applied, we then excluded patients with type 1 diabetes using the algorithm by Klompas et al27 in which patients with type 1 diabetes are identified as having >50% of their diabetes diagnosis codes related to type 1 diabetes (ICD-9 250.x1 or 250.x3; ICD-10 E10.x) and either having no dispenses of a diabetes medication other than metformin or insulin, or having a dispense of glucagon.
Study outcome
The outcome for this study was hospital utilization for hypoglycemia, which included emergency department visits, observation visits, or inpatient admissions. Emergency department visits resulting in inpatient admission were counted as single events. Visits due to hypoglycemia were identified using the validated algorithm by Ginde et al,28 which included emergency department or observation visits with an ICD-9 code for hypoglycemia, or inpatient admissions with an ICD-9 code for hypoglycemia as the primary diagnosis. The hospital systems in this study transitioned from ICD-9 to ICD-10 in the 2015 calendar year. As Ginde et al’s28 algorithm has not been validated using ICD-10 codes, from 2015 onward we applied two ICD-10 conversions that have been used in prior studies (online supplemental table 1).10 29 The ‘limited ICD-10 algorithm’ included codes specific to hypoglycemia with or without the context of type 2 diabetes or other specified diabetes types.10 29 The ‘expanded ICD-10 algorithm’ adds codes for hypoglycemia in the context of type 1 diabetes and diabetes due to medications or other conditions, and codes for adverse effects or poisoning by diabetes medications.10 29
Supplemental material
Patient characteristics
The characteristics of included patients were identified for each year of the cohort; if there were multiple values in a given year, the first value in that year was used. Baseline characteristics were defined as the first value within 1 year of cohort entry. Demographic data included age, sex, and race/ethnicity. Age was analyzed in four categories: 18–39, 40–64, 65–74, and ≥75 years. Diabetes medications were captured using the patients’ prescribed medications in the EHR and were described in terms of number and therapeutic class. High hypoglycemia risk medications were defined as sulfonylureas, meglitinides, or insulin; other diabetes medications were defined as low hypoglycemia risk. Chronic kidney disease, cardiovascular disease, and cognitive impairment (including mild cognitive impairment and dementia) were defined by diagnosis codes based on validated algorithms used in prior studies (online supplemental table 2).30–37 HbA1c value was analyzed in five categories based on clinical relevance: <6.0%, 6.0%–6.9%, 7.0%–7.9%, 8.0%–8.9%, ≥9.0%, and missing (no value available in the given year). US Department of Agriculture rural-urban commuting area codes were used to define urban (codes 1–6) or rural (codes 7–10) status.38 All variables were analyzed as multicategorical (not ordered) with the most prevalent category chosen as the reference category.
Statistical analysis
The baseline characteristics of the study population at their time of cohort entry were described using means and proportions. Hospital utilization for hypoglycemia was described for each calendar year in terms of number of events and the yearly event rate (total events per patient at risk). We also described the yearly event rate stratifying the outcome into two groups: (1) emergency department or observation visits without inpatient admission; or (2) inpatient admissions with or without an associated emergency department visit. Longitudinal trends in hypoglycemia hospital utilization were evaluated using linear regression for the yearly event rate, with study year as the univariable predictor. As algorithms to identify hypoglycemia hospital utilization based on ICD-10 have not been validated, analyses of predictors of hypoglycemia hospital utilization were performed using ICD-9 data prior to 2015. The yearly hypoglycemia event rate from 2009 to 2014 was presented stratified by subgroups of patient demographics and major clinical factors associated with hypoglycemia (diabetes medication use, chronic kidney disease, cognitive impairment). Kruskal-Wallis one-way analysis of variance was used to determine whether hypoglycemia rates differed across subgroups.39 We used logistic regression analysis to examine independent predictors of having at least one episode of hospital utilization for hypoglycemia in 2014. Model 1 included adjustment for patient demographics (age, sex, race/ethnicity) and study site, with other predictors of interest added to this base model one at a time. Model 2 added adjustment for all major clinical risk factors for hypoglycemia listed above and HbA1c level. To evaluate the potential effects of missing medication data given that patients could have received prescriptions outside the health systems, we performed a sensitivity analysis after excluding participants with no diabetes medications. Data analysis was performed using SAS software V.9.4 (SAS Institute); p<0.05 was considered statistically significant.
Results
Participant characteristics
There were 549 041 adults with type 2 diabetes included in this study, with the yearly analytic population ranging from 97 783 in 2009 to 374 945 in 2019 (figure 1). At the time of cohort entry, the mean participant age was 61.0 years, 50.8% were female, and 75.8%, 14.1%, and 5.1% were non-Hispanic white, non-Hispanic black, and Hispanic race/ethnicity, respectively (table 1). The mean HbA1c was 7.5%, and 28.1% of participants had an HbA1c <7.0%. Approximately half of participants used one or more diabetes medications, with the most common diabetes medication classes being metformin, sulfonylureas, or insulin. A high hypoglycemia risk medication (sulfonylurea, meglitinide, or insulin) was used by 27.2% of patients.
Patient characteristics at time of cohort entry
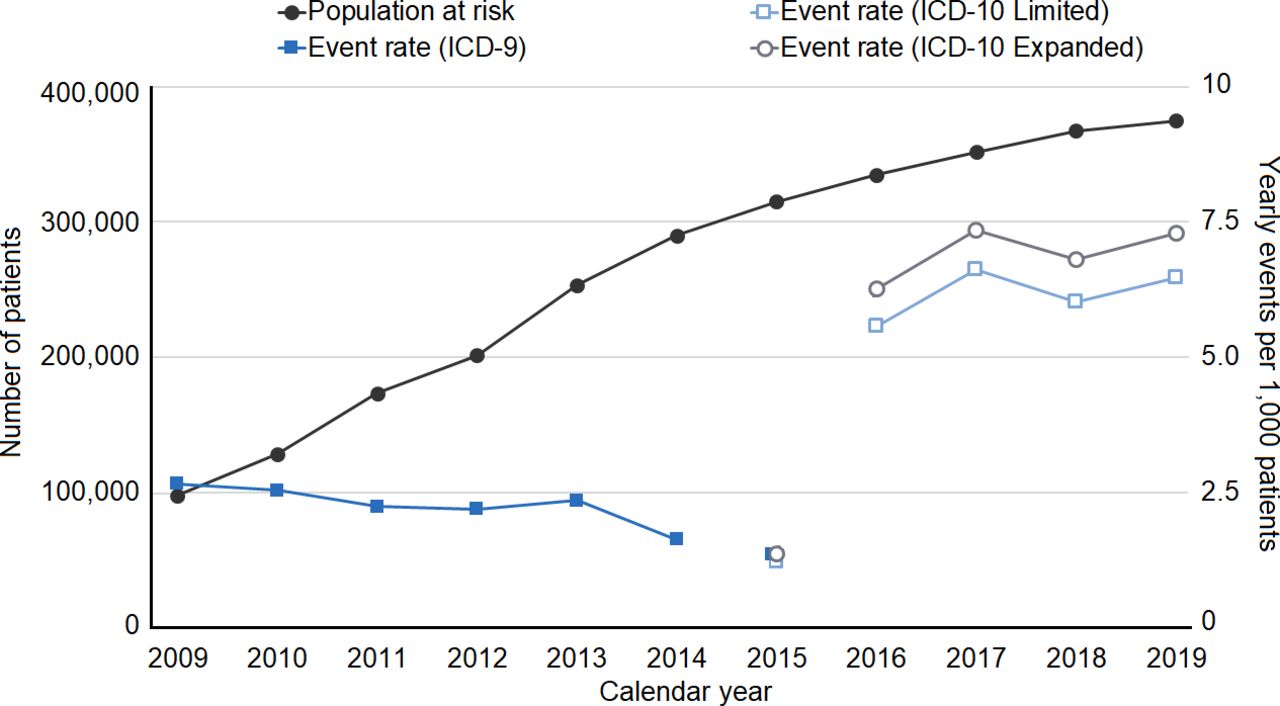
Sample size and yearly event rate for hypoglycemia hospital utilization using International Classification of Diseases (ICD)-9 and ICD-10 algorithms, 2009–2019. The sample size of the population at risk included is shown on the left axis. The yearly event rate (events per 1000 patients) is shown on the right axis. The event rate ascertained by ICD-10 codes is shown using a limited algorithm (codes for hypoglycemia with or without the context of type 2 diabetes or other specified diabetes) and an expanded algorithm (adds codes for hypoglycemia in the context of type 1 diabetes and diabetes due to medications or other conditions, and codes for adverse effects or poisoning by diabetes medications).
Trends in hypoglycemia hospital utilization
The yearly event rate for hypoglycemia hospital utilization ascertained using ICD-9 codes decreasing significantly between 2009 and 2014 (p-trend=0.023) from 2.7 to 1.6 events per 1000 patients (figure 1, table 2). Using the limited ICD-10 algorithm, the yearly event rate from 2016 to 2019 was substantially higher than that using ICD-9 codes. The yearly event rate was stable (p-trend=0.42) from 5.6 to 6.6 events per 1000 patients per year. The yearly event rate using the expanded ICD-10 algorithm was stable (p-trend=0.25) ranging from 6.3 to 7.3 events per 1000 patients. Each year, the majority of events were the patient’s first event since entering the cohort, although in most study years, one-fifth to one-third of events were repeat events (table 2). The majority of events were emergency department or observation visits without inpatient admission while relatively few events were inpatient stays with or without an associated emergency department visit (online supplemental table 3). Despite changing cohort size, the demographic and clinical characteristics of the study population remained generally stable over time, especially between 2009 and 2014 (online supplemental table 4). There was a notable increase in the use of insulin, metformin, and newer diabetes medications between 2009 and 2019.
Yearly event rate of hospital utilization for hypoglycemia, and repeated events
Hypoglycemia hospital utilization in patient subgroups
Examining rates of hospital utilization for hypoglycemia between 2009 and 2014, there were significant and substantial differences in all years across categories of age, race/ethnicity, diabetes medication use, chronic kidney disease, and cognitive impairment (figure 2). The majority of events were experienced by insulin users who had between 3.5 and 8.0 events per 1000 patients yearly. Users of low hypoglycemia risk medications had the lowest event rates, followed by high hypoglycemia risk oral medication users and those using no diabetes medications. Patients aged 18–39 years had substantially higher event rates (3.3–7.0 events per 1000 patients) compared with those in other age groups (1.1–3.0 events per 1000 patients). Non-Hispanic black patients had higher event rates than other race/ethnicities. There were also substantially higher event rates for patients with chronic kidney disease versus those without (3.5–6.2 vs 1.1–1.8) and with versus without cognitive impairment (3.3–9.9 vs 1.5–2.3).

Yearly event rate for hypoglycemia hospital utilization by patient subgroups, 2009–2014. For race/ethnicity, other race/ethnicities are not shown because of low sample size. For diabetes medication categories, high hypoglycemia risk oral diabetes medication classes are sulfonylureas and meglitinides; low hypoglycemia risk diabetes medications are all other classes except insulin.
Predictors of hypoglycemia hospital utilization
There were 290 075 patients included in the logistic regression analysis in 2014 and their characteristics were similar to that of the entire cohort (table 3). Results from the basic and fully adjusted models were similar, and closely reflected the findings in unadjusted subgroup analyses. In the fully adjusted model (model 2), patients aged 18–39 years had significantly higher odds of hypoglycemia hospital utilization (OR 2.43 compared with ages 40–64 years, 95% CI 1.78 to 3.31), as did women (OR 1.43, 95% CI 1.16 to 1.75) and non-Hispanic black patients (OR 1.84 compared with white patients, 95% CI 1.43 to 2.38). Relative to patients using no diabetes medications, insulin users had the highest odds of hypoglycemia hospitalization (OR 2.13, 95% CI 1.67 to 2.73), and patients using low-risk diabetes medications had the lowest odds (OR 0.44, 95% CI 0.29 to 0.67). Patients with chronic kidney disease and cognitive impairment had higher odds of hypoglycemia hospitalization compared with those without: OR 2.86 (95% CI 2.33 to 3.57) and 1.92 (95% CI 1.39 to 2.70), respectively. There was a U-shaped relationship between HbA1c and hypoglycemia hospital utilization such that patients with the lowest and highest HbA1c values had the highest odds of hypoglycemia hospitalization.
Logistic regression analysis for predictors of hospital utilization for hypoglycemia in 2014
In the sensitivity analysis excluding participants without diabetes medications (online supplemental table 5), the OR for hypoglycemia hospitalization for high-risk oral diabetes medication use relative to low-risk medications was 1.85 (94% CI 1.10 to 3.31), and the OR for insulin use was 5.00 (3.23–7.69). The association between HbA1c and hypoglycemia hospitalization was attenuated; there was no other substantial difference from the primary analysis.
Discussion
In this retrospective open cohort study of adults with type 2 diabetes receiving care from six academic health systems, we found that hospital utilization for hypoglycemia ascertained using a validated ICD-9 algorithm decreased significantly from 2009 to 2014. We found much higher rates of hypoglycemia hospital utilization from 2016 onward using two ICD-10 conversions; the validity of ascertaining hypoglycemia using ICD-10 codes needs to be further studied. In addition, we identified independent predictors of hypoglycemia hospital utilization using ICD-9 data including younger age, female sex, non-Hispanic black race, insulin use, the presence of chronic kidney disease or cognitive impairment, and having an HbA1c less than 6.0% or greater than 9.0%. These findings highlight the large contribution of sociodemographic and clinical factors to a patient’s risk of hypoglycemia hospital utilization, and the need to validate and standardize criteria for identifying this outcome using current EHR data.
A novel finding of this study, which spanned the ICD-9 to ICD-10 transition, is the identification of differences in rates of hypoglycemia hospital utilization depending on the coding algorithm, as prior relevant studies occurred largely before the transition to ICD-10.1 9–12 We used Ginde et al’s28 algorithm, which was validated against chart review of emergency department records in 2005–2006 that included diagnoses for candidate ICD-9 codes related to hypoglycemia. In this population, the algorithm attained a positive predictive value of 89%; sensitivity and specificity were high, but were calculated assuming no cases of hypoglycemia were missed which likely inflated these statistics. Compared with Ginde et al’s28 algorithm, we found that a limited and expanded ICD-10 conversion detected approximately three times the rates of hypoglycemic events, respectively. There are several possible explanations for this finding. First, ICD-10 codes may be more sensitive for ascertaining hypoglycemia hospital utilization in a general population of patients with type 2 diabetes, or in more recent years. Second, ICD-10 codes may be identifying more false-positive events, which could occur due to some codes being less specific for hypoglycemia. It is unlikely that the differences between algorithms were due to temporal trends as the event rates using each individual algorithm were generally stable over time. Ultimately, there is a need for further validation studies to determine the accuracy of ascertaining hypoglycemia hospital utilization using ICD-10 codes, which will be necessary to ensure the validity of future research in this area.
The yearly rates of hypoglycemia hospital utilization found in this study using ICD-9 codes of approximately two to three events per 1000 patients were similar to rates found in prior studies. A report from a single health system found a yearly event rate for hypoglycemia hospital utilization of one to three events per 1000 patients from 2006 to 2015.10 A study using data from multiple health systems from 2005 to 2011 found the yearly event rate for hypoglycemia hospital utilization was 14–16 events per 1000 patients, although patients with type 1 diabetes were not excluded.11 A more recent study using claims data from Medicare Advantage beneficiaries including those with type 1 and type 2 diabetes found nine hypoglycemia hospital utilization events per 1000 patients per year using ICD-10 codes.40 While the majority of hypoglycemic events in this study were the patient’s first event since cohort entry, a substantial proportion of patients had multiple events during the study period, highlighting the need to identify high-risk patients to prevent recurrent hypoglycemic events.
Despite temporal changes in the landscape of diabetes treatment, we found that rates of hospital utilization for hypoglycemia decreased slightly from 2009 to 2014, and were stable from 2016 to 2019.41–43 It is possible that temporal trends in hypoglycemia were driven by differences in the study population, however the stability of the demographic and clinical characteristics of the cohort makes this unlikely. Consistent with other studies, we found that insulin use substantially increased over time suggesting that there may be protective factors countering this such as more effective diabetes treatment and hypoglycemia prevention strategies; further study is needed to clarify this.41–43
We found substantially different rates of hypoglycemia hospital utilization among patient subgroups with known clinical hypoglycemia risk factors. Notably, insulin users had approximately 10-fold higher rates than those using diabetes medications with a low risk for hypoglycemia, and approximately fivefold higher rates than users of insulin secretagogues. Likewise, we found threefold to fourfold higher rates among patients with chronic kidney disease or cognitive impairment (vs those without).11 These findings indicate that clinicians should be aware of the high risk for hypoglycemia in these populations when selecting diabetes medications and glycemic targets, and that it will be important to direct hypoglycemia prevention efforts to these populations.
The independent risk factors for hypoglycemia hospital utilization identified using logistic regression largely recapitulated findings in subgroup analyses. Among demographic risk factors, it was notable that patients aged 18–39 had substantially higher odds than other age groups. While it is possible that this finding is due to incomplete exclusion of patients with type 1 diabetes who are more often younger, this is unlikely as type 1 diabetes comprises a small minority of the diabetes population and we excluded these patients using a validated algorithm with high sensitivity.27 Over the past decade, there has been an increasing prevalence of type 2 diabetes among younger adults who have higher rates of diabetes complications.44 Given that younger adults with type 2 diabetes have lower insulin use than other age groups, it is possible that younger adults face unique challenges related to their diabetes treatment that cause them to be at a higher risk for hypoglycemia, such as inconsistent access to care or adherence to diabetes medications.41 More research is needed to understand hypoglycemia risk in younger adults and develop prevention strategies targeted to this age group. We found that patients in other age categories had lower odds of hypoglycemia hospital utilization, which is in contrast to prior studies which have found the highest rates of hypoglycemia among those aged 75 years and older.11 12 40 45 We found that females had significantly higher odds of hypoglycemia hospital utilization compared with males which has been found in one prior study; the reasons for this are unclear.10 We also found higher odds of hypoglycemia hospital utilization among non-Hispanic black patients compared with other race/ethnicities, which has been seen in prior studies.10 12 40 46 While the exact reasons for this are not understood, this finding is likely related to the substantial racial/ethnic disparities in diabetes such that minorities have inequitable healthcare access, suboptimal clinical management, and worse diabetes outcomes.47–52 Further, we found a U-shaped relationship with HbA1c such that patients with an HbA1c of less than 6.0% and greater than 9.0% had the highest odds of hypoglycemia hospital utilization. This finding is of clinical importance because it indicates that high rates of hypoglycemia hospital utilization are not limited to patients with tight glycemic control; those with poor glycemic control are also a high-risk group. In randomized trials of tight glycemic control, targeting an HbA1c of <6.0% to <6.5% increased rates of severe hypoglycemia by approximately threefold compared with standard control.53–56 These findings support that glycemic control below guideline-recommended targets contributes to hypoglycemia hospital utilization. However, these findings should be interpreted cautiously given that approximately half of participants did not have an HbA1c value available in 2014 for this analysis.
In multivariable analyses, insulin users had the highest odds of hypoglycemia hospital utilization, which is consistent with prior studies demonstrating that insulin is the primary medication contributing to hypoglycemia risk among patients with type 2 diabetes.2–4 40 Unexpectedly, we found that patients using no diabetes medications had higher odds of hypoglycemia hospital utilization than patients using diabetes medications other than insulin. This pattern has been seen in other studies, but without a clear explanation.1 It is likely that some diabetes medications were missed as this study used yearly EHR prescription data, which cannot capture medications prescribed outside the included health systems or if patients did not receive a prescription for the medication in a given year. It is also possible that this finding is due to medication use being ascertained at the start of each calendar year: some patients taking no diabetes medications at that time may have subsequently initiated diabetes medications later in the year.
The major strength of this study is that it used standardized EHR data from an established clinical research data network representing a large, diverse cohort of patients with type 2 diabetes from six health systems. This allowed for analysis of rates of hypoglycemia hospital utilization longitudinally over an 11-year period, providing sufficient data to explore predictors of hypoglycemia and variation among important clinical subgroups. This study has several limitations. Although we restricted our population to patients who had multiple visits in one health system in successive years, some patients may have had hypoglycemia hospital utilization events at outside health systems, which would make our observed hypoglycemia event rates appear lower than the true event rate. Analysis of HbA1c values was limited to patients with available HbA1c data which excluded a substantial proportion of participants who were analyzed as missing. However, the relationship between HbA1c and hypoglycemia hospital utilization was not a major focus of this study and missing data in this area do not have implications for our primary findings. Finally, this study focused on only those hypoglycemic episodes resulting in hospital utilization, which occurs in less than 1 in 10 severe hypoglycemic episodes.57 Both severe and non-severe hypoglycemic episodes have important clinical consequences and contribute to health-related anxiety among patients with diabetes and a lower quality of life.1–4 58 Therefore, with respect to hypoglycemia, the outcome of this study was only the tip of the iceberg.
In conclusion, this study identified hypoglycemia hospital utilization among patients with type 2 diabetes in six large academic health systems, with notably higher event rates ascertained using ICD-10 compared with ICD-9 codes. A critical next step will be to perform validation studies of ascertaining hypoglycemia using ICD-10 codes. Further, a number of patient demographic and clinical characteristics are independent risk factors for hypoglycemia hospital utilization, with especially high rates found among insulin users and patients with chronic kidney disease and cognitive impairment, which may be important populations to target hypoglycemia prevention efforts. Further research in this area is needed in order to use health systems data as a platform for reducing the risk of hypoglycemia hospital utilization among high-risk populations and promoting individualized approaches to diabetes treatment.
Data availability statement
Data are available in a public, open access repository. A deidentified database will be prepared and submitted to the NIDDK Central Repository. Included will be documentation including protocols, forms, and data dictionaries. Access is guided by the NIDDK Central Repository policy.
Ethics statements
Patient consent for publication
Ethics approval
PaTH obtained ethics approval from the Institutional Review Board (IRB) of Johns Hopkins School of Medicine, the central IRB for all participating institutions (IRB00107126). As this was an observational study using data collected from electronic health records and posed minimal risk to subjects, this research met the standards for waiver of informed consent.
Acknowledgments
The authors acknowledge the participation of their partnering health systems.
References
Footnotes
Contributors SJP developed the study protocol and prepared the manuscript. EBL performed the data analysis and contributed to the study design and interpretation and reviewed/edited the manuscript. JLK, LK, EF, JMP, CLB, NMM, and HCY contributed to the study design and interpretation and reviewed/edited the manuscript.
Funding Research reported in this publication was partially funded through a Patient-Centered Outcomes Research Institute (PCORI) Award (PCORI CDRN 1306-04912). SJP was supported by the Johns Hopkins KL2 Clinical Research Scholars Program (KL2TR003099).
Disclaimer PCORI had no role in the study design, data collection, interpretation, or writing or approving the manuscript.
Competing interests None declared.
Provenance and peer review Not commissioned; externally peer reviewed.
Supplemental material This content has been supplied by the author(s). It has not been vetted by BMJ Publishing Group Limited (BMJ) and may not have been peer-reviewed. Any opinions or recommendations discussed are solely those of the author(s) and are not endorsed by BMJ. BMJ disclaims all liability and responsibility arising from any reliance placed on the content. Where the content includes any translated material, BMJ does not warrant the accuracy and reliability of the translations (including but not limited to local regulations, clinical guidelines, terminology, drug names and drug dosages), and is not responsible for any error and/or omissions arising from translation and adaptation or otherwise.