Article Text

Abstract
Objective The objective of this study is to investigate the relationship between cotinine level-confirmed secondhand smoke (SHS) exposure and glycemic parameters and obesity.
Research design and methods We examined a cohort of 6472 adults from the National Health and Nutrition Examination Surveys, 1999–2010. Serum cotinine levels and self-reported data on smoking were used to determine smoking status. The outcome variables were body mass index (BMI) and glycemic status (HbA1c), Homeostasis Model Assessment of Insulin Resistance (HOMA-IR), and fasting plasma glucose (FPG). Descriptive, bivariate, and multivariate analyses were conducted.
Results Using cotinine level-confirmed smoking status, 1794 (27.4%) of the sample were current smokers, 1681 (25.0%) were former smokers, 1158 (17.8%) were secondhand smokers, and 1839 (29.8%) were non-smokers. In a generalized linear model after controlling for potential confounding variables, secondhand smokers had higher adjusted levels of HOMA-IR, FPG, and BMI compared with non-smokers (p<0.05). Adjustment for BMI demonstrated that some, but not all, of the detrimental effects of SHS on glycemic parameters are mediated by the increased body weight of secondhand smokers.
Conclusions We conclude that SHS is associated with obesity and worsening glycemic parameters. More studies are needed to show a causal relationship between SHS and glycemic parameters and to understand the mechanisms involved in the association.
- Nicotine
- Smoking
- Epidemiology
- Obesity
This is an Open Access article distributed in accordance with the Creative Commons Attribution Non Commercial (CC BY-NC 4.0) license, which permits others to distribute, remix, adapt, build upon this work non-commercially, and license their derivative works on different terms, provided the original work is properly cited and the use is non-commercial. See: http://creativecommons.org/licenses/by-nc/4.0/
Statistics from Altmetric.com
Significance of this study
What is already known about this subject?
Studies have shown a positive association between cigarette smoking and the incidence of diabetes mellitus (DM).
A recent meta-analysis examining prospective cohort studies on passive smoking (by history) showed a significant relative risk of developing DM.
What are the new findings?
Cotinine level-confirmed secondhand smoke (SHS) is associated with a higher rate of Homeostasis Model Assessment of Insulin Resistance (HOMA-IR), hemoglobin A1c, fasting plasma glucose as well as obesity after correcting for confounders.
Adjustment for body mass index demonstrated that some, but not all of the detrimental effects of SHS on glycemia are mediated by the increased body weight of secondhand smokers.
The percentage of participants who were classified as secondhand smokers using our definition decreased between 1999–2000 and 2009–2010, which demonstrates that smoke-free laws are effective and may help decrease the number of Americans who develop obesity and DM as a result of being exposed to SHS.
How might these results change the focus of research or clinical practice?
Our study showing the association between cotinine-verified secondhand smokers and worsening of glycemic parameters as well as obesity prompts the need for reliable and cost-effective methods for interventions to prevent secondhand smoking including stronger smoke-free laws.
Future research studies are needed to show a causal relationship between SHS and glycemic parameters and to understand the mechanisms involved in the association.
Introduction
In 2011, 43.8 million people or 19.0% of all adults (aged 18 years and older) in the USA smoked cigarettes.1 During 2000–2004, an estimated 443 000 persons in the USA died prematurely each year as a result of the health consequences of smoking or exposure to secondhand smoke (SHS),2 making it the single most preventable cause of death. SHS is classified by the US Environmental Protection Agency (EPA) as a ‘known human carcinogen’.3 Cigarette smoking and type 2 diabetes mellitus (DM) are major public health concerns and both are risk factors for cardiovascular disease, with an increased mortality rate among female smokers who have DM.4 Studies have shown the association between cigarette smoking and an increased risk of developing type 2 DM,5 an association that is surprising as smokers are leaner than non-smokers and obesity is positively associated with DM.6
SHS is responsible for about 46 000 deaths per year from heart disease in current non-smokers.7 According to the US Department of Health Services, exposure to SHS causes lung cancer in non-smoking adults.8 Exposure to SHS can be tested by measuring the amount of cotinine (a breakdown product of nicotine) in a non-smoker's blood, saliva, or urine.9 Studies have shown the association of cotinine with an increased level of hemoglobin A1c (HbA1c) (a measurement of glycemic exposure) in subjects without DM.10 Multiple studies have shown a positive association between cigarette smoking and the incidence of DM,5 and a recent meta-analysis examining prospective cohort studies on passive smoking (by history) showed a significant relative risk of developing DM;11 the relationship between cotinine-verified SHS and DM is less established. As the development of DM is clearly related to obesity,6 we also wanted to examine the relationship between SHS and obesity and if obesity influences the relationship between SHS and glycemic parameters. In our study, we tested the association between SHS, confirmed by serum cotinine levels, and glycemic parameters and obesity.
Research design and methods
Study design
We used data from the National Health and Nutrition Examination Survey (NHANES), a cross-sectional survey conducted by the National Center for Health Statistics, using a stratified multistage probability sample to obtain a representative sample of the total civilian, non-institutionalized US population.12 Since 1999, the NHANES has released data at 2-year intervals. NHANES collected questionnaire data during a face-to-face home interview followed by a physical examination and additional interviews administered in a specially equipped mobile examination center where blood samples were drawn, from which serum cotinine and glycemic levels were determined. We combined data using six successive waves of NHANES data (1999–2010) for our analyses. Our analytical sample was 6472 adults 20 years and older (figure 1) who had complete data on recent self-reported cigarette smoking status and had serum cotinine levels measured. Participants with missing data on any of the study variables were excluded from the analysis. We excluded 627 subjects who were taking insulin or other antiglycemic medications, as these medications would not allow us to determine the true effect of primary or SHS on glycemic outcomes. Participants who used other nicotine products such as pipes, snuff, patch, gum, cigars, or chewed tobacco, either alone or with cigarettes were also excluded from the analysis, as we were concerned about confounding effects of these products (figure 1).
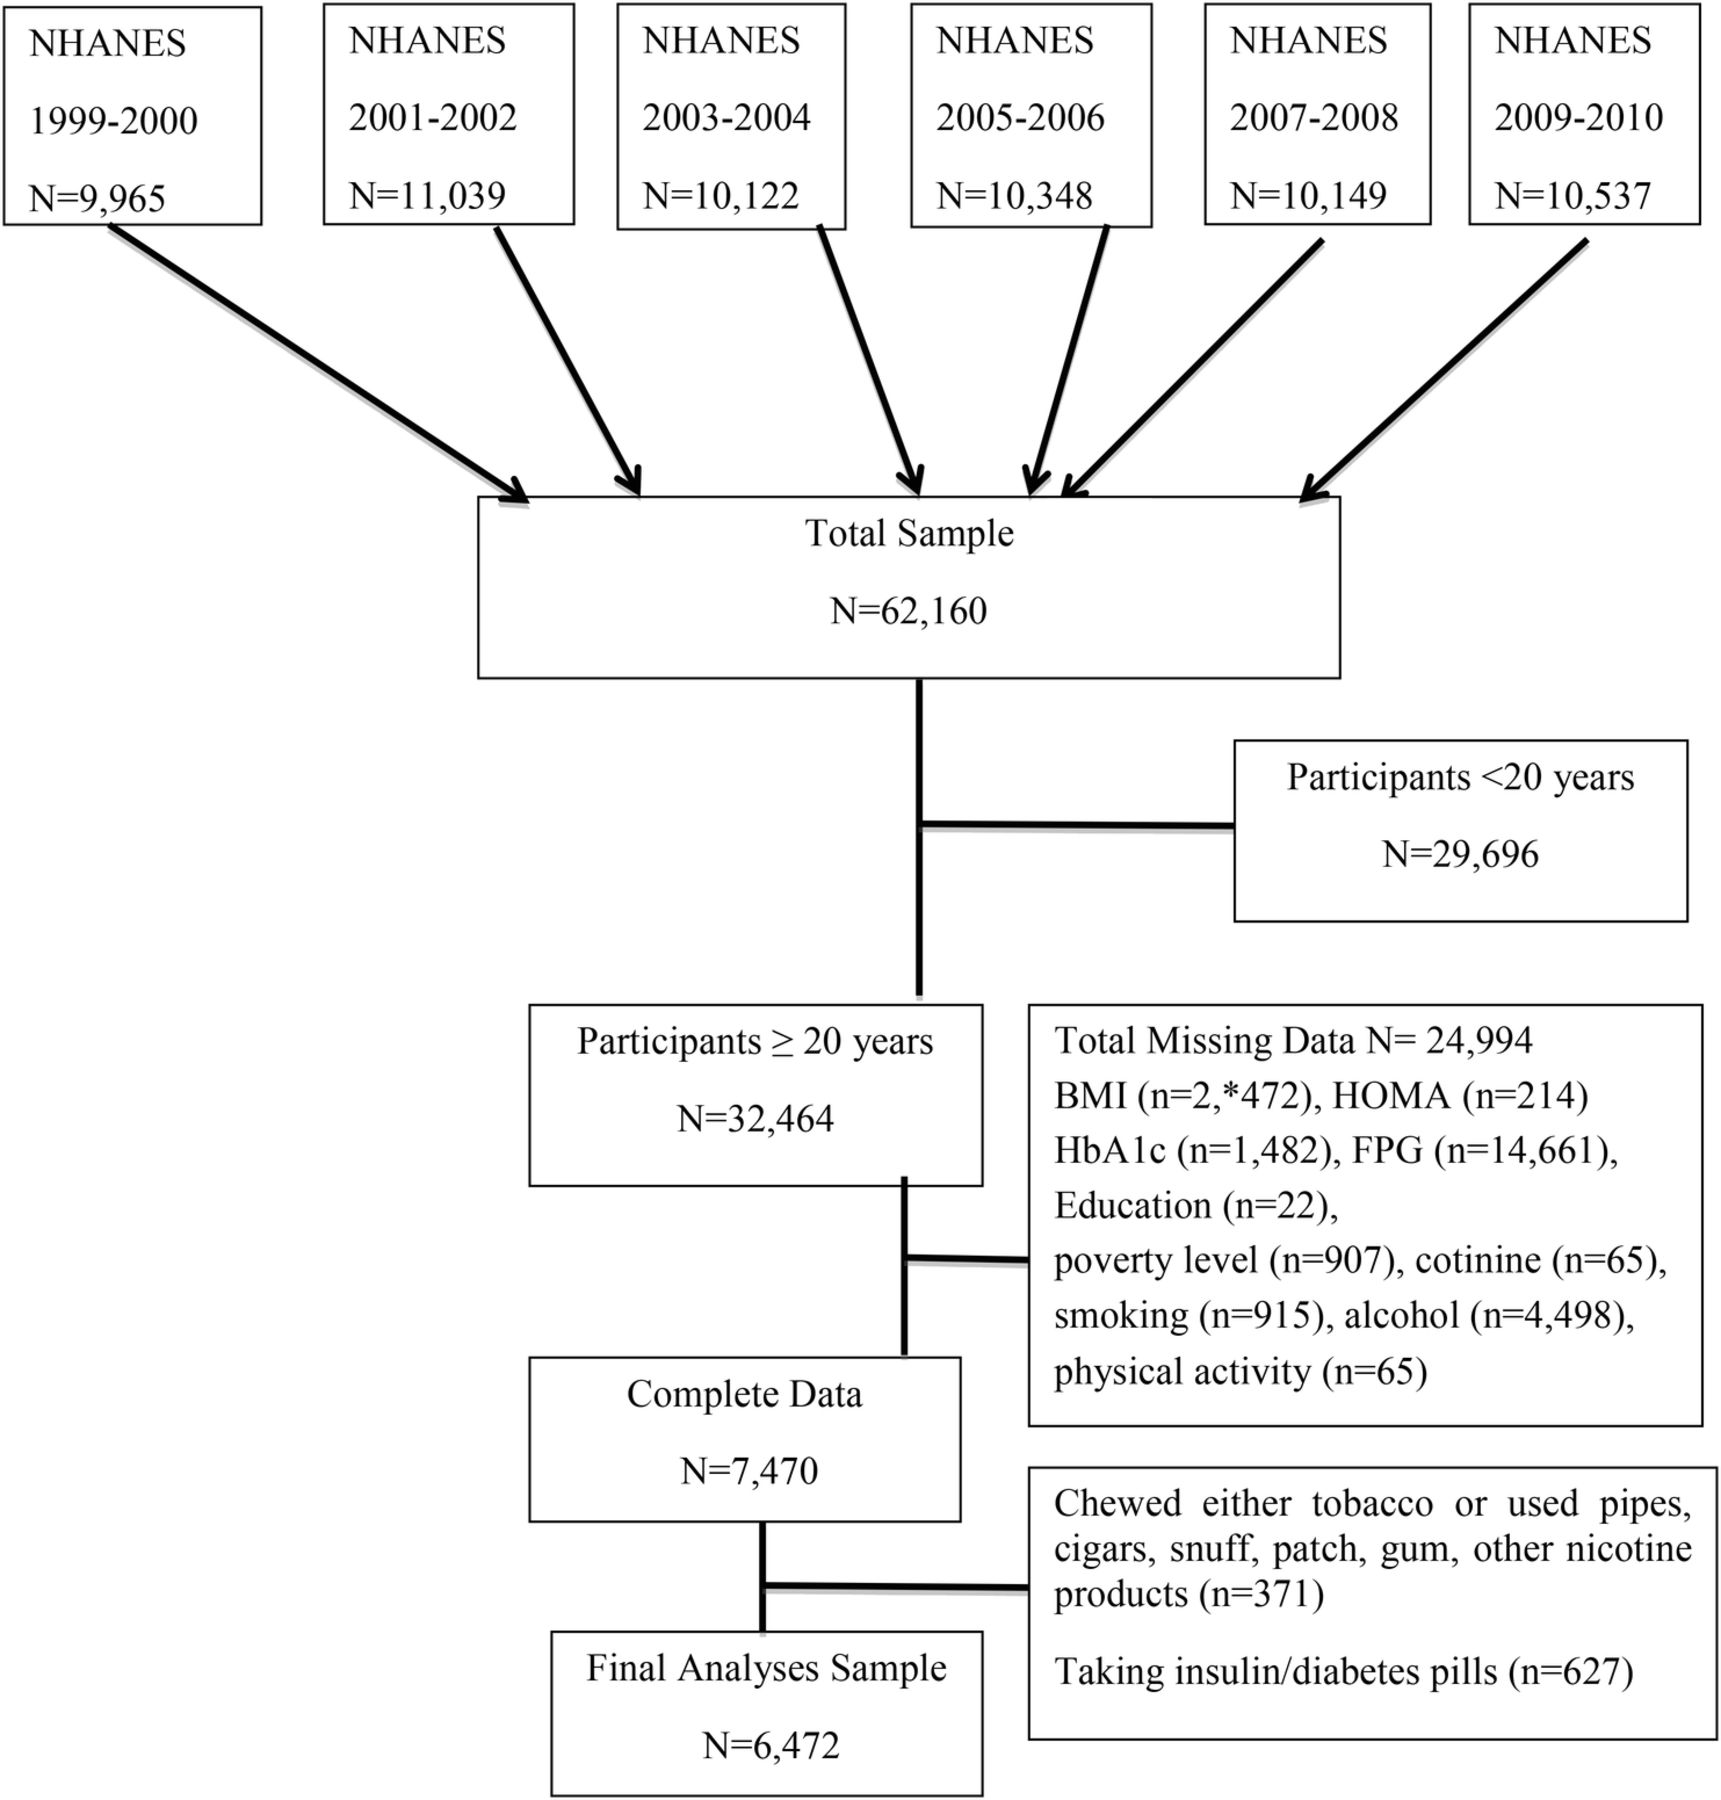
Flow chart depicting six successive waves of NHANES cycle (1999–2010). NHANES, National Health and Nutrition Examination Survey.
Definition of variables and laboratory measurements
Obesity
Body weight and height were measured according to standard techniques during the examinations and body mass index (BMI) was calculated as weight in kilograms divided by the square of height in meters.13 Participants with BMI 25–29.9 kg/m2 were classified as overweight and those with BMI≥30 kg/m2 were classified as obese.14
Glycemic status
Glycemic status was assessed by measures based on Homeostasis Model Assessment of Insulin Resistance (HOMA-IR),15 fasting plasma glucose (FPG, mg/dL), and HbA1c (%). FPG was measured in participants who were examined in the morning session after an 8–24-hour fast using the hexokinase enzymatic reference method (Roche Diagnostics, Indianapolis, IN). Serum insulin was measured by means of a radioimmunoassay (Pharmacia Diagnostics, Uppsala, Sweden). All measurements were performed at the University of Missouri—Columbia School of Medicine Department of Child Health, Diabetes Reference Laboratory, Columbia, Missouri (David Goldstein, MD, Director). HOMA-IR was determined according to the following equation: fasting plasma glucose (mmol/L) × fasting plasma insulin (µU/mL)/22.5).15 HbA1c was measured on all participants using the boronate affinity high performance liquid chromatography (HPLC) system. We categorized normal values for HOMA-IR as <2.2, for HbA1c as <6.5%, and for FPG as <126 mg/dL.16 ,17
Cotinine level-confirmed smoking status
Cotinine is a metabolite of nicotine that is used as a marker for active and passive smoking. Serum cotinine was measured by an isotope dilution-high performance liquid chromatography/atmospheric pressure chemical ionization tandem mass spectrometry (ID HPLC-APCI MS/MS). The racial/ethnic cut-offs for cotinine categorization by Benowitz et al18 were used to categorize individuals as non-smokers (NS) (cotinine <0.05 ng/mL, all races/ethnicities), secondhand smokers (SHSers) (cotinine 0.05–5.91 ng/mL for non-Hispanic blacks; 0.05–4.84 ng/mL for non-Hispanic whites, and 0.05–0.83 ng/mL for Hispanics), and current smokers (CS) (cotinine ≥5.92 ng/mL, 4.85 ng/mL, and 0.84 ng/mL for non-Hispanic blacks, non-Hispanic whites, and Hispanics, respectively). As Benowitz et al18 did not define a cut-off for Hispanics, we used the Mexican-American cut-off for Hispanics.
We categorized smoking status according to two methods, that is, one based on the objective cotinine levels as defined above and a second method based on a combination of cotinine status and response to specific questions. In the second method, CS were defined as those who smoked at least a 100 cigarettes in lifetime AND responded ‘Everyday’ or ‘Some days’ to ‘Do you now smoke’. Former smokers (FS) were defined as those who smoked at least a 100 cigarettes in lifetime AND responded ‘Not at all’ to Do you now smoke” AND also responded ‘No’ to smoking cigarettes in last 5 days. SHSers were defined as (1) those who responded ‘no’ to ‘Smoking at least 100 cigarettes in lifetime’ AND ‘No’ to smoking cigarettes in last 5 days AND had cotinine <0.05 ng/mL AND answered ‘Yes’ to the question ‘Were you exposed to cigarettes at home/work?’ OR (2) those who responded ‘No’ to ‘Smoking at least 100 cigarettes in lifetime’ AND ‘No’ to smoking cigarettes in last 5 days AND had cotinine ≥0.05 ng/mL. NS were defined as those who responded ‘No’ to ‘Smoking at least 100 cigarettes in lifetime’ AND ‘No’ to smoking cigarettes in last 5 days AND had cotinine <0.05 ng/mL.
Confounding variables
Age at interview in years was used as a continuous variable. Gender was categorized as males and females. Self-reported race/ethnicity was categorized as non-Hispanic white, non-Hispanic black, Hispanic, and other race. Physical activity was categorized as being active if respondent answered ‘Yes’ to either the question ‘Over the past 30 days, did you do moderate activities for at least 10 minutes that cause only light sweating or a slight to moderate increase in breathing or heart rate? Some examples are brisk walking, bicycling for pleasure, golf, and dancing’ OR the question ‘Over the past 30 days, did you do any vigorous activities for at least 10 minutes that caused heavy sweating, or large increases in breathing or heart rate? Some examples are running, lap swimming, aerobics classes or fast bicycling’. Participants were considered non-active if they answered ‘No’ to both questions mentioned above. Alcohol consumption was surveyed and categorized as ≤1, 2–3, 4–5, and ≥6 drinks per week.10 Education level was reported as number of years of school attended and was categorized into less than high school (less than 9th grade, 9–11 grade, 12th grade with no diploma), high school (high school graduate/general education degree or equivalent) and greater than high school (some college or associate arts degree, college graduate or above). Poverty income ratio (PIR) is an income-to-needs variable measuring the ratio of household income to the US poverty threshold for each respondent's family size and composition. PIR was used to determine whether the participant's household income was < or ≥200% of the federal poverty level (FPL).19 The year of the survey cycle used in the analyses was every 2 years from 1999 to 2010. There were six cycles.
Statistical analyses
Descriptive statistics was used to characterize the subjects (mean±SE) for continuous variables, and unweighted number and weighted percent for categorical variables in table 1. We used the log base (e) of BMI, HOMA-IR, FPG, and HbA1c for the analyses as the original variables were not normally distributed. To test the statistical differences between the smoking status-related groups in the categorical variables of the sample characteristics, χ2 test for categorical variables was used. For the normally distributed log-transformed continuous variables, we used generalized linear model (GLM) and present the unadjusted values in table 1. p<0.05 was considered statistically significant.
NHANES 1999–2010 sample characteristics (N=6472)
A GLM was used to examine the association between the outcome variables (log-transformed BMI, HOMA-IR, FPG, and HbA1c) and smoking status, controlling for age, gender, race/ethnicity, physical activity, education, FPL, year of survey cycle, and alcohol consumption. We estimated the adjusted mean and 95% CIs of log BMI, HbA1c, HOMA-IR, and FPG among the three smoking groups with non-smokers as the reference group. We adjusted for physical activity and alcohol consumption because it has been shown that smokers are less physically active20 and consume more alcohol than never smokers.21 We also examined the association between the outcome variables (log-transformed BMI, HOMA-IR, FPG, and HbA1c) and cotinine groups, controlling for age, gender, race/ethnicity, physical activity, education, FPL, year of survey cycle, and alcohol consumption. We estimated the adjusted mean and 95% CIs of log BMI, HbA1c, HOMA-IR, and FPG among the cotinine groups with low cotinine as the reference group. The above analyses were repeated in table 3 with BMI added as an additional covariate in the model. We performed the Sobel-Goodman mediation tests22 in STATA V.14.2 to test the extent of how BMI influences the effect of SHS on glycemic parameters.
Adjusted mean (95% CI) of HOMA-IR, HbA1c, and FPG according to cotinine levels, and cotinine level-confirmed smoking status for participants ≥20 years old (N=6472) with adjustment for BMI
We used multiple logistic regression models to obtain the adjusted OR and SEs for the categorized outcome variables (BMI 25–29.9 kg/m2, BMI≥30 kg/m2, HOMA-IR≥2.2, FPG≥126 mg/dL, and HbA1c≥6.5%) after controlling for age, gender, race/ethnicity, physical activity, education, FPL, year of survey cycle, and alcohol consumption. Data were presented as adjusted OR and SE and p<0.05 was considered statistically significant. All analyses were performed using SAS software V.9.4 (SAS Institute, Cary, North Carolina, USA) and the survey module of STATA software V.14.2 taking into consideration the complex sampling design and the sampling weights. Sample weights provided by the National Center for Health Statistics (NCHS) were used to correct for differential selection probabilities and to adjust for non-coverage and non-response.
Adjusted mean (95% CI) of BMI, HOMA-IR, HbA1c, and FPG according to cotinine levels, and cotinine level-confirmed smoking status for participants ≥20 years old (N=6472) without adjusting for BMI
Results
Of the 6472 participants with complete data used in the study, using cotinine level-confirmed smoking status as defined by the cotinine method above, 2835 (43.8%) had low cotinine and were considered NS, 1759 (27.2%) had medium cotinine and were considered SHSers, and 1878 (29.0%) had high cotinine and were considered were CS (table 1). We could not define FS using this method. Using the second method of survey results combined with cotinine levels, 1839 (29.8%) were NS, 1158 (17.8%) were SHSers, 1681 (25.0%) were FS, and 1794 (27.4%) were CS. Table 1 shows the sample characteristics and the outcome variables by the two methods of cotinine level-confirmed smoking status. In general, the percentage of current smokers was similar for the cotinine group defined by cotinine level and by survey/cotinine definition. Gender, race/ethnicity, alcohol consumption, physical activity, FPL, education, study cycle, age, BMI, and HOMA-IR and FPG varied significantly by cotinine level-confirmed smoking status (p<0.05) (table 1). Among the male subjects, 30% were SHSers by cotinine level and 19.2% by survey/cotinine definition, while among female subjects, 24.5% were SHSers by cotinine level and 16.3% by survey/cotinine definition. Blacks had the highest percentage of being SHSers; 35% by cotinine level and 30.5% by survey/cotinine definition compared with all other race/ethnic groups. Among participants with higher consumption of alcohol (six or more drinks per day), 25.9% were SHSers by cotinine level and 16.3% by survey/cotinine definition, whereas 56.7% were CS by cotinine level and 56.6% by survey/cotinine definition. Among participants with low income (FPL<200%), 28.4% were SHSers by cotinine level and 20.2% by survey/cotinine definition and among those with FPL≥200%, 26.8% were SHSers by cotinine level and 16.9% by survey/cotinine definition. The percentage of participants who were classified as SHSers defined by cotinine level decreased from 29.9% in 1999–2000 to 22.3% in 2009–2010 (F(5,87)=3.77, p=0.004) and by survey/cotinine definition decreased from 22.3% in 1999–2000 to 13.5% in 2009–2010 (F(5,83)=8.54, p=0.0001). The percentage of participants who were classified as NS defined by cotinine level increased from 33.5% in 1999–2000 to 56.4% in 2009–2010 (F(5,87)=8.96, p=0.0001) and by survey/cotinine definition increased from 19.9% in 1999–2000 to 38.4% in 2009–2010 (F(5,87)=8.95, p=0.0001).
Using the survey/cotinine definition and unadjusted means (to describe the sample), SHSers and CS were younger and FS were older than NS and using cotinine levels, CS and SHSers were younger than NS. Using both definitions, SHSers had a higher BMI and HOMA-IR than NS (table 1). By the survey/cotinine definition, SHSers had a higher FPG than NS. By both definitions, CS had a lower BMI than NS, but similar HOMA-IR, HbA1c, and FPG as NS. By the survey/cotinine definition, FS had higher HOMA-IR, HbA1c, and FPG compared with NS.
Table 2 shows the adjusted mean and 95% CI of BMI, HOMA-IR, HbA1c, and FPG by the GLM using the cotinine levels, and survey/cotinine definitions of smoking groups after controlling for age, gender, race/ethnicity, physical activity, education, FPL, year of survey cycle, and alcohol consumption. Using cotinine levels, the adjusted mean BMI in the medium cotinine group (SHS) (28.2 kg/m2, 95% CI 27.9 to 28.5) was higher compared with the low cotinine group (NS) (27.6 kg/m2, 95% CI 27.3 to 27.9 kg/m2; p=0.02). The adjusted mean HOMA-IR was found to be higher in the group with medium cotinine levels (SHSers) (2.31, 95% CI 2.20 to 2.42; p=0.004) and lower in the group with high cotinine levels (CS) (1.85, 95% CI 1.75 to 1.94; p=0.002) compared with the group with low cotinine levels (NS) (2.09, 95% CI 2.0 to 2.18). The group with high cotinine levels (CS) had higher levels of HbA1c (5.38%, 95% CI 5.35% to 5.40%; p<0.001) as did the medium cotinine group (SHSers) (5.37%, 95% CI 5.34% to 5.39%; p<0.001) than the group with low cotinine levels (NS) (5.32%, 95% CI 5.30% to 5.34%). Higher levels of FPG were found in the group with medium cotinine levels (SHSers) (99.0 mg/dL, 95% CI 98.1 to 99.9; p=0.04), but not in the group with high cotinine levels (CS) (97.6 mg/dL, 95% CI 96.9 to 98.4; p=NS), compared with the group with low cotinine levels (NS) (97.8 mg/dL, 95% CI 97.1 to 98.6 mg/dL).
Using the survey/cotinine definition, the CS group had lower adjusted BMI (26.2 kg/m2, 95% CI 25.9 to 26.6 kg/m2; p<0.0001) and the SHSers group had a higher adjusted BMI (28.29 kg/m2, 95% CI 27.9 to 28.7 kg/m2; p=0.008) than the NS (27.5 kg/m2, 95% CI 27.1 to 27.89 kg/m2). Adjusted HOMA-IR was higher in the SHSers group (2.31 mg/iU, 95% CI 2.16–2.47 mg/iU; p=0.004) and the FS group (2.24 mg/iU, 95% CI 2.13 to 2.35 mg/iU; p=0.004) and lower in the CS group (1.82 mg/iU, 95% CI 1.73 to 1.92 mg/iU; p=0.004) compared with the NS group (2.04 mg/iU, 95% CI 1.94 to 2.15 mg/iU). The adjusted mean HbA1c was similar among the SHSers group (5.38%, 95% CI 5.35% to 5.41%, p=0.001) and CS group (5.38%, 95% CI 5.35% to 5.40%, p=0.001) but higher compared with the NS group (5.31%, 95% CI 5.29% to 5.34%). FPG in the SHSers group (99.5 mg/dL, 95% CI 98.5 to 100.5 mg/dL; p=0.002) was higher compared with the NS (97.5 mg/dL, 95% CI 96.6 to 98.3 mg/dL).
Table 3 shows the effect of adjusting for BMI, in addition to the above variables, on relationship between smoking status and glycemic indices. After controlling for BMI, HOMA-IR in the high cotinine group and CS and SHSer group, and FPG in the medium cotinine group were no longer statistically significant. We tested the extent of how BMI influences the effect of medium cotinine (table 3, third column) on glycemic parameters and found that the proportion of total effect that is mediated by BMI is 0.62 on HOMA-IR, 0.73 on FPG, and 0.53 on HbA1c. The effect of SHS (table 3, seventh column) that is mediated by BMI is 0.69 on HOMA-IR, 0.41 on FPG, and 0.42 on HbA1c.
Figure 2 shows the use of a multivariate logistic regression to examine the association between the outcomes and the smoking status determined by the survey/cotinine definition controlling for the confounding variables (age, gender, race/ethnicity, physical activity, education, FPL, year of survey cycle, and alcohol consumption). SHSers had higher adjusted odds of FPG≥126 mg/dL (OR=2.2, SE=0.6; p=0.01) and HOMA-IR≥2.2 (OR=1.4, SE=0.1; p=0.001) relative to NS. CS had lower odds of BMI≥30 kg/m2 (OR=0.60, SE=0.1; p<0.01) and BMI 25–29.9 kg/m2 (OR=0.66, SE=0.1; p< 0.01) compared with NS. SH had greater odds of BMI≥30 kg/m2 (OR=1.5, SE=0.2; p=0.01) and BMI 25–29.9 kg/m2 (OR=1.3, SE=0.1; p=0.01) compared with NS. FS also had higher adjusted odds of BMI≥30 kg/m2 (OR=1.4, SE=0.2; p=0.01), but was not significant for BMI 25–29.9 kg/m2 (OR=1.2, SE=0.1; p=0.1). FS also had higher adjusted odds of HOMA-IR≥2.2 (OR=1.3, SE=0.1; p=0.01). The adjusted odds of HbA1c≥6.5% was not statistically different for all groups compared with NS.

Adjusted OR and SE for BMI≥30 kg/m2, BMI 25–29.9 kg/m2, HbA1c≥6.5%, HOMA-IR≥2.2, and FPG≥126 mg/dL in CS, FS, and SHS using the survey/cotinine definition compared with the reference group of NS after adjusting for age, sex, races, alcohol, physical activity, education, FPL, year of survey cycle using multiple logistic regression. *p<0.05. BMI, body mass index; CS, current smokers; FPG, fasting plasma glucose; FS, former smokers; HbA1c, hemoglobin A1c; HOMA-IR, Homeostasis Model Assessment of Insulin Resistance; SHS, secondhand smokers.
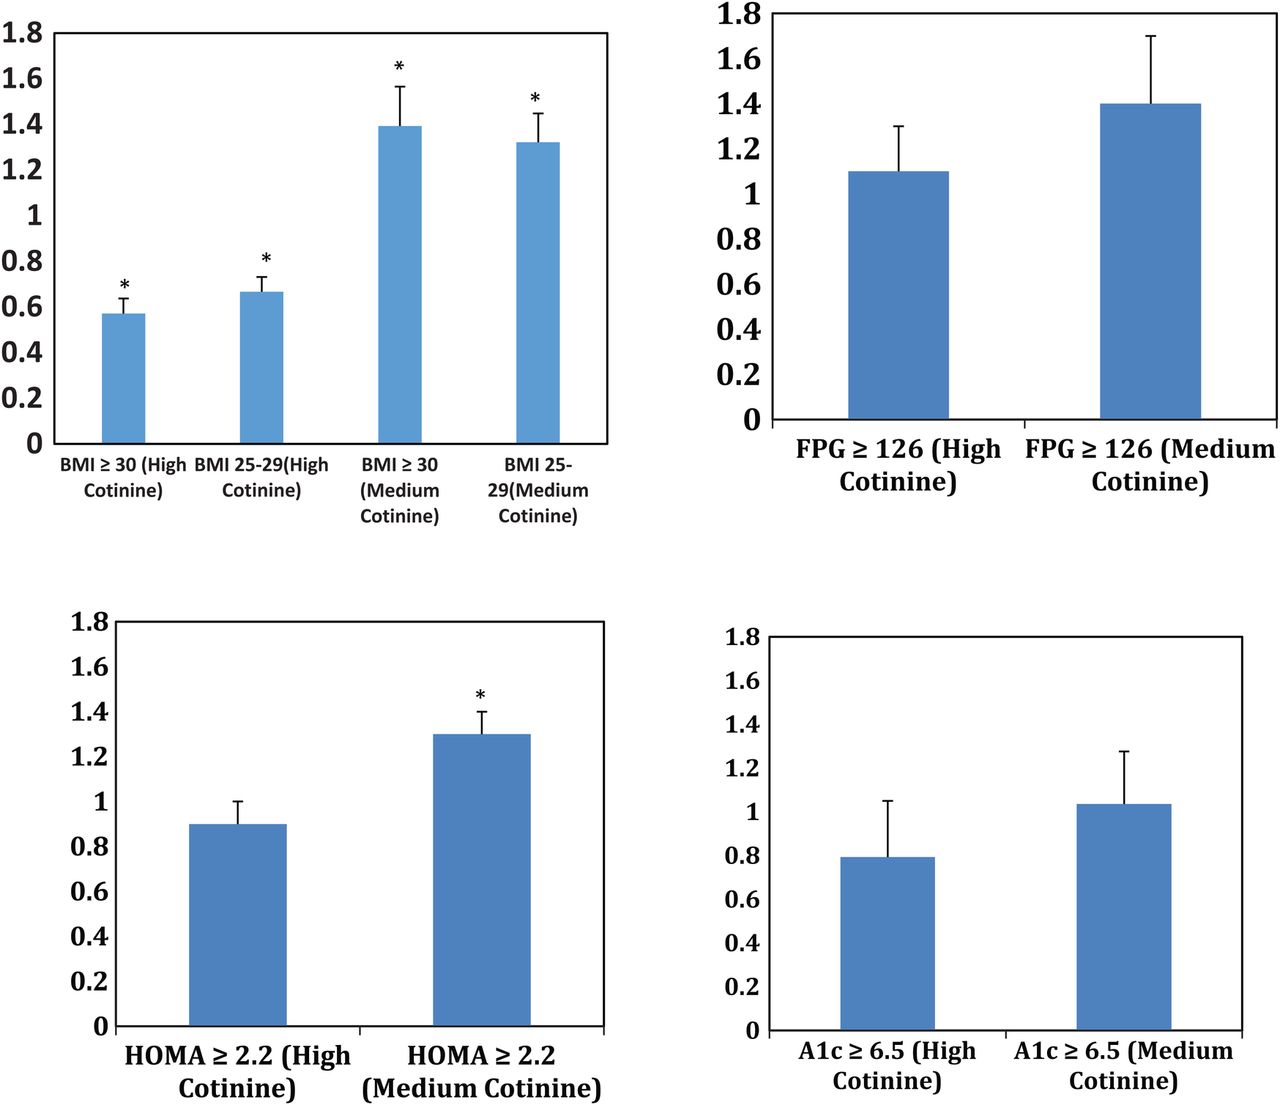
Figure 3 shows the use of a multivariate logistic regression to examine the association between the outcomes (BMI, HOMA, HbA1c, and FPG) and the smoking status determined by cotinine levels controlling for the same confounding variables. CS (high cotinine level) had a lower adjusted OR of having a BMI≥30 kg/m2 (OR=0.57, SE=0.1; p<0.001) and BMI 25–29.9 kg/m2 (OR=0.67, SE=0.1; p< 0.001) relative to NS (with a low cotinine level). SHS (medium cotinine level) had a higher adjusted OR of having a BMI≥30 kg/m2 (OR=1.4, SE=0.2; p=0.009) and BMI 25–29.9 kg/m2 (OR=1.3, SE=0.1; p=0.004) relative to NS (with a low cotinine level). SHS (medium cotinine level) had a higher adjusted OR of having a HOMA-IR≥2.2 (OR=1.3, SE=0.1; p<0.0001) relative to NS (with a low cotinine level). The adjusted ORs of having an HbA1c≥6.5% or FPG≥126 mg/dL were not statistically different for all groups compared with the NS (low cotinine level).
Adjusted OR and SE for BMI≥30 kg/m2, BMI 25–29.9 kg/m2, HbA1c≥6.5%, HOMA-IR≥2.2, and FPG≥126 mg/dL in those with high cotinine levels (CS) and medium cotinine levels (SHS) compared with the reference group of low cotinine levels (NS) after adjusting for age, sex, races, alcohol, physical activity, education, FPL, year of survey cycle using multiple logistic regression. *p<0.05. BMI, body mass index; FPG, fasting plasma glucose; HbA1c, hemoglobin A1c; HOMA-IR, Homeostasis Model Assessment of Insulin Resistance.
Discussion
This is the first study, to the best of our knowledge, that has examined the relationship between secondhand smoking and glycemic parameters and obesity using both recent self-reported cigarette smoking status and race/ethnicity-corrected cotinine values to define secondhand smoking. Our most significant finding is that using both methods of defining SHSers, we found that SHS exposure was associated with higher adjusted levels of HOMA-IR, FPG, and HbA1c as well as higher BMI, while CS is associated with a lower BMI compared with non-smokers. Adjustment for BMI demonstrated that some, but not all of the detrimental effects of SHS on glycemia are mediated by the increased weight of SHSer. The effects of SHS on HOMA-IR, a glycemic parameter, especially related to obesity, was especially reduced when adjusting for BMI.
The present findings are consistent with the results of a recent meta-analysis examining prospective cohort studies on passive smoking that showed a significant relative risk of developing DM.11 This meta-analysis assessed four publications that all defined passive smoking by history and found a pooled relative risk (RR) of 1.28 (95% CI 1.14 to 1.44). The CARDIA study,23 a prospective cohort study, is noteworthy in that they did confirm SHS exposure by measuring serum cotinine levels and found that those with passive exposure to tobacco smoke verified by cotinine levels had an intermediate risk for developing glucose intolerance between current smokers and never smokers without passive smoke exposure. This study did not examine the incidence of obesity. Also, the CARDIA study was done among black and white young adults aged 18–30 years, whereas our study looked at all race/ethnicity and adults over 20 years.
Several cross-sectional studies have shown an association between passive smoking with the development of type 2 DM.23–26 Lajous et al showed an association between SHS and DM in a prospective setting, but the study was done only in female Caucasians, thus the results cannot be generalized to men or non-Caucasian populations.25 Furthermore, this study used self-report SHS exposure that was not verified by cotinine levels. Zhang et al26 found that there was a positive relationship between exposure to passive smoke and active smoking and the risk of developing type 2 DM. This study, which confirms our findings of the association between secondhand smoking and DM, was a prospective study with high follow-up rates, although DM was only by self-report. In our study, we used biochemical parameters to define DM and other glycemic parameters. The study by Zhang et al26 included mainly white females, thus the results and conclusions cannot be generalized to the entire population since the study was not on a national representative sample. Our study used the NHANES database and thus our results can be generalized to the non-institutionalized population. In addition, passive smokers in study by Zhang et al26 were based on self-report. A prospective study by Hayashino et al27 showed that self-reported exposure to SHS in the workplace and current active smoking at baseline were positively associated with an increased risk of developing DM, even after controlling for possible confounders consistent with the findings of our study.
Studies of users of nicotine gum have higher rates of insulin resistance28 and therefore, it is believed that the nicotine in cigarettes is the component that is associated with a higher rate of DM. We found that SHSers who are involuntarily exposed to cigarette smoking, had higher rates of two conditions, DM and obesity, that are associated with high mortality and morbidity. It is possible that the hand-to-mouth action of cigarettes, or the effect of cigarettes on taste buds, conditions that are not present for SHSers, may lead to CS being leaner than SHSers. Although one can argue that CS are also exposed to SHS, we are not surprised that CS are leaner than SHSers for several reasons. While SHSers are exposed to less smoke than CS, we do not know the dose relationship between amount of smoke and its effects on DM. SHS is produced at different temperatures and different reducing conditions, so some toxic substances may occur in different concentrations in SHS compared to primary smoke. Finally, the filter of cigarettes may decrease some of the negative effects of smoke in CS, but not SHSers.3 ,29 ,30
We found a statistical difference in genders between SHSers and NS that could be due to exposure of male subjects to more environmental smoke compared with female subjects. Males may be working in industries or in bars where more people smoke. There was a higher percentage of SHSers among blacks compared to whites that could be due to the disparities in occupations, with blacks being disproportionately employed in laborer and factory jobs. Although the national average of those in the laborer and factory jobs is 27%, the percent of blacks in those jobs is 41%.31 According to the Praxis Project, an analysis of municipal tobacco control ordinances in the USA found that communities with significant numbers of people of color are less likely to have any municipal tobacco control ordinances in place when compared with communities with fewer people of color.32 Non-Hispanic blacks metabolize cotinine slower than other racial/ethnic groups resulting in a higher cotinine level for the same amount of tobacco used.33
We found that there was a higher percentage of SHSers among those who had four or more alcohol drinks per day compared with NS. Those who drink more and thus visit bars and pubs are more exposed to SHS compared to those who have fewer drinks per day. According to the US Department of Health and Human Services, levels of SHS in restaurants and bars were found to be two to five times higher than in residences with smokers and two to six times higher than in office workplaces.34
Most interestingly, using both our definitions of smoking status, there was a decline in the rates of SHS in each 2-year iteration of the NHANES survey. This confirms a recent report using higher cut-offs of cotinine than we did to define SHSers and found that SHS smoke exposure in non-smokers declined from 52.5% during 1999–2000 to 25.3% during 2011–2012.35 Our data showed that SHS exposure declined from 22.3% during 1999–2000 to 13.5% during 2009–2010. We, as well as Homa et al,35 posit that this decline is related to introduction of statewide indoor smoking restriction laws during this time. According to the American Nonsmokers' Rights Foundation (http://www.no-smoke.org), in 2016, across the USA, 22 590 municipalities, representing 82.1% of the US population, are covered by a 100% smoke-free provision in non-hospitality workplaces, and/or restaurants, and/or bars, by either a state, commonwealth, territorial, or local law. Forty-one states and the District of Columbia have local laws in effect that require non-hospitality workplaces and/or restaurants and/or bars to be 100% smoke-free. The decline in rates of SHSers between 1999–2000 and 2009–2010 demonstrate that smoke-free laws are effective and may help decrease the number of Americans who develop obesity and DM as a result of being exposed to SHS. However, with several states without smoke-free laws, our data support the need for more states to pass smoke-free legislation. Laws prohibiting smoking in multiunit housing, including public housing, would further decrease the consequences of SHS. Although it is unknown if there will be lag time between the decline in SHS exposure and the potential decline in detrimental glycemic parameters and obesity, the effect of smoke-free laws on other health parameters is rapid, with immediate improvements in heart disease and improvements in lung cancer in about 2 years.36 Thus, we are optimistic that there will be a decline in SHS-associated DM and obesity in the near future that will continue with further reduction in SHS.
Strengths and limitations
Our study had several limitations. Since the NHANES data are a cross-sectional study, we cannot assess a causal relationship, although our results are consistent with several prospective cohort studies,23 ,24 ,26 ,37 which did show that SHS exposure led to the development of glucose intolerance and DM. Also, although we controlled for major confounders and found a robust association, it is possible that other unknown confounders could account for the association between secondhand smoking and DM and obesity. Cotinine levels decrease with time following the last exposure, so measurement of cotinine only reflects recent exposure.
We defined CS, SHSers, and NS in two manners as discussed in the Research design and methods section using survey/cotinine definition and the objective race-ethnicity-adjusted measurement of serum cotinine levels. For the most part, the characterization by survey/cotinine definition was consistent with that by cotinine levels. However, it is possible that participants did not answer the surveys correctly (recall bias) as studies have shown that self-report underestimates smoking status.38 Those defined as SHSers by cotinine could be CS who did not smoke in the few days before the sample was collected, never smokers exposed to SHS, or FS exposed to SHS. Glycemic abnormalities and obesity develop over time, so using current cotinine levels may not reflect what happened decades ago when the pathogenesis of these diseases began. We attempted to overcome this difficulty by examining FS using survey/cotinine definition and found that these individuals had glycemic and obesity outcomes that were intermediate between CS and SHSers. FS can be currently exposed to SHS.
We only examined the association between smoking status and body weight; in future studies, we may examine the association between smoking status and fat distribution, as visceral obesity is the key determinant of the predilection to develop DM.
Conclusion
In summary, because the USA has witnessed widespread increases in the prevalence of obesity and DM over the past few decades leading to high health costs, our study showing the association between cotinine-verified SHSers and worsening of glycemic parameters as well as obesity prompts the need for reliable and cost-effective methods for interventions to prevent secondhand smoking including stronger smoke-free laws. However, the only true solution for the health consequences of SHS exposure is a complete smoking ban.
Acknowledgments
The authors acknowledge Thomas Yoshikawa, MD, of the professional development core of the Charles R. Drew University Accelerating Excellence in Translational Science (AXIS) for help with editing the manuscript.
References
Footnotes
Contributors TCF, MS, and DK had full access to all of the data in the study and take responsibility for the integrity of the data and the accuracy of the data analysis. DK, MS, DP, and TCF were involved in study concept and design, interpretation of data, drafting of the manuscript and statistical analysis. DK, MS, and TCF were involved in the critical revision of the manuscript for important intellectual content. TCF obtained funding.
Funding Funding for this project came from NIH-NIMHD grant number U54MD007598 (formerly U54RR026138), MIDARP/DIDARP grant number R24DA017298, NIMHD grant number S21 MD000103 and NIH/NCATS grant number UL1TR000124.
Disclaimer The funding sources had no role in the writing of the manuscript or the decision to submit it for publication as the corresponding author, TCF, had full access to all the data in the study and had the final responsibility for the decision to submit for publication.
Competing interests All authors have completed the ICMJE uniform disclosure form at http://www.icmje.org/coi_disclosure.pdf and declare: no support from any organization for the submitted work; no financial relationships with any organizations that might have an interest in the submitted work in the previous 3 years; no other relationships or activities that could appear to have influenced the submitted work.
Provenance and peer review Not commissioned; externally peer reviewed.
Data sharing statement Original data sets are available on request.