Article Text

Abstract
Objective Among adults with type 2 diabetes (T2D), several (but not all) studies show that being overweight (body mass index (BMI): 25.0–29.9 kg/m2) or obese I (BMI: 30.0–34.9 kg/m2) near the time of diagnosis, is unexpectedly associated with reduced all-cause mortality compared with normal weight—the obesity paradox. We addressed whether this observation is causal (eg, a true protective effect); due to confounding (including effect modification); or due to selection (‘collider’) bias.
Research design and methods We performed a matched population-level cohort study using primary care records from Salford, UK (1995–2012) in 10 464 patients with incident T2D paired (1:3) with 31 020 individuals who never developed T2D. We estimated HRs for associations of BMI with all-cause mortality using Cox models, stratified by smoking status.
Results Median follow-up was 8.7 years. For never smokers, the hazard of all-cause mortality increased from 25 kg/m2, in a linear manner, with increasing BMI in the T2D cohort (HR per 5 kg/m2: 1.23, ptrend<0.001) and in the non-diabetes cohort (HR per 5 kg/m2: 1.34, ptrend<0.001). In contrast, among ever smokers, BMI-mortality relationships were U-shaped in the T2D and non-diabetes cohorts. Evidence of the obesity paradox in ever smokers, with and without T2D, argued against a selection bias, but supported a contribution of effect modification by smoking (pinteraction=0.009). Results were stable to various sensitivity analyses.
Conclusions In this cohort, the obesity paradox is mainly explained by smoking as an effect modifier. These findings indicate that the obesity paradox does not challenge standard weight management recommendations among T2D patients.
- Body Mass Index
- Mortality
- Methodological Issues
- Smoking
This is an Open Access article distributed in accordance with the Creative Commons Attribution Non Commercial (CC BY-NC 4.0) license, which permits others to distribute, remix, adapt, build upon this work non-commercially, and license their derivative works on different terms, provided the original work is properly cited and the use is non-commercial. See: http://creativecommons.org/licenses/by-nc/4.0/
Statistics from Altmetric.com
Significance of this study
What is already known about this subject?
Cohort studies, limited to type 2 diabetes (T2D) populations, have observed the obesity paradox (an unexpected reduced all-cause mortality among overweight and obese I compared with normal weight) and speculated that explanations range from causal, for example, a true protective effect, to methodological, for example, confounding (including effect modification), and a selection (‘collider’) bias.
What are the new findings?
By capturing the relationship between body mass index (BMI) and all-cause mortality in diabetes and non-diabetes populations, this matched cohort analysis demonstrates that the obesity paradox is observed in T2D and non-diabetes ever smokers, but not in never smokers, arguing against selection bias but favoring an explanation by effect modification.
How might these results change the focus of research or clinical practice?
This is the first large-scale matched analysis in populations with and without T2D directly addressing the methodological explanations of the obesity paradox, and reassuringly demonstrates that while the obesity paradox exists, it does not challenge weight reduction recommendations among overweight/obese T2D patients.
Introduction
Across many populations, body mass index (BMI) is associated with increased all-cause mortality of ∼30–40% per 5 kg/m2 increase.1 BMI is also a risk factor for incident type 2 diabetes (T2D), with an ∼90% increase per SD increase (equivalent to 5 kg/m2 in many populations).2 However, the relationship between BMI and mortality in individuals with T2D requires clarification. Early studies3 ,4 reported that, similar to the general population, elevated BMI was associated with increased risk of mortality. These observations support recommendations in clinical guidelines (eg, American Diabetes Association;5 UK National Institute for Care and Health Excellence6) to encourage weight loss in overweight and obese T2D patients. Subsequently, eight cohort studies (see online supplementary table S1) evaluated BMI–mortality relationships, across at least five BMI categories. Seven of these studies7–13 concluded that being overweight (BMI: 25.0–29.9 kg/m2) or obese I (BMI: 30.0–34.9 kg/m2), near the time of diagnosis, is associated with an unexpected reduced all-cause mortality compared with normal weight with T2D—termed the ‘obesity paradox’. One notably analysis,14 combining data from the Nurses' Health Study and Health Professionals Follow-up Study, failed to demonstrate the obesity paradox among its T2D subpopulation. There have been several criticisms of this interpretation,15–18 such that the literature is now confused.
supplementary data
The obesity paradox is well recognized in the literature on chronic diseases.19 Some clinical studies have concluded that this relationship is causal, arguing the state of overweight/obese I is ‘protective’,20 ,21 thus challenging standard guidelines on weight management in many chronic illnesses. However, at least two sources of potential bias are likely to be important. First, there may be residual confounding, notably with cigarette smoking, as smoking is inversely related to BMI and a key risk factor for mortality. For example, in the relationship of BMI and all-cause mortality in general population, the obesity paradox is observed in current and former smokers, but not in never smokers,22 making smoking an effect modifier. Second is a specific selection bias known as collider stratification, which occurs when common causes (here, elevated BMI and smoking) of a disease and an outcome affect inclusion into the analysis.23 As smoking and BMI are both risk factors for diabetes, T2D may be a ‘collider’.24 These mechanisms may not be mutually exclusive but our published mathematical modeling indicates that they may have relatively different impacts in different settings.25
To clarify the relationship between BMI and all-cause mortality among individuals with T2D, a methodological framework is required. First, statistical adjustment for smoking status may be insufficient to control for the complexities of lifetime smoking exposure, and stratification by smoking status is preferred.1 ,14 Second, to disentangle the contribution of selection bias, we argue that it is necessary to evaluate the exposure and outcome of interest in diabetes and non-diabetes populations, and demonstrate its presence in the former and absence in the latter. Restricting analyses to T2D populations only has been a major limitation of studies7–9 ,11–13 to date. Only one study10 tested BMI–mortality relationships in subpopulations with and without T2D, but sample sizes were modest.
Research design and methods
We performed a matched population-level cohort study to address the relative contributions of the three aforementioned mechanisms, namely (1) causal effect; (2) confounding; and (3) selection bias (schematically illustrated by the causal diagrams in see online supplementary figure S1), for the BMI–mortality obesity paradox in patients with and without T2D.
Study population
The Salford Integrated Record (SIR) is a National Health Service (NHS) database, incorporating primary and secondary care records of structured data (mostly clinical codes entered by clinicians or generated by laboratory systems). Salford is a geographic urban area with a population of ∼0.3 million (96% Caucasian) within Greater Manchester, UK. Data were extracted from general practices, varying from 45 to 49 practices over the study period (total population: 248 913 aged >18 years), and linked with data from outpatient services and hospital records. The SIR has been extensively evaluated and its data are of high quality—for example, this setting has been used for the world's first ‘real-world randomized controlled trial of a prelicensed medication in chronic obstructive pulmonary disease’.26
Under ethical approval (11/EM/0337), anonymized data were provided, and measures of interest identified or derived using clinical codes (International Statistical Classification of Diseases and Related Health Problems (ICD); Read; Office of Population Censuses and Surveys (OPCS)) covering diagnoses, clinical observations, referrals, test results, and procedures.
Identification of matched cohorts
We initially identified 16 272 individuals with a diagnosis of any diabetes, using Read codes (V.2) beginning with ‘C10’; prescribed insulin; or having ‘diabet’ in the medical definition (see online supplementary material Excel file). We established a cohort of patients with incident T2D between 01 January 1995 and 30 June 2012, all with a BMI value. For comparability with other studies, we only included BMI values determined within 365 days before or after date of T2D diagnosis. We excluded as follows (flow diagram, figure 1): (1) In total, 1288 individuals or 7.9% with missing BMI or BMI values >1 year before or after date of T2D diagnosis; (2) In total, 795 patients with first diabetes diagnosis prior to 1995; (3) In total, 1470 patients with type 1 diabetes (defined by text search for type 1 alongside a diabetic diagnosis code; a ‘C10F’ read code; or any insulin prescribed within 30 days of diabetes diagnosis); (4) In total, 65 patients with gestational diabetes; and (5) In total, 2190 patients with diagnosis of diabetes before age 35 years and after 85 years; missing age, sex, or follow-up data; and BMI outlier values defined as <18.5 kg/m2 and ≥60 kg/m2.

Flow diagram to matched cohort analysis. *There were 372 occurrences with less than three matches. BMI, body mass index. FU, follow-up.
supplementary data
We identified 232 641 individuals who never had a diagnosis of diabetes and derived a comparator non-diabetes cohort. We excluded as follows: (1) In total, 60 168 individuals or 25.9% with missing BMI; (2) In total, 73 317 individuals aged <35 years and aged >85 years; missing age, sex, or follow-up data; and BMI outlier values, leaving a cohort of 99 156 non-diabetes individuals.
We then matched the diabetes cohort 1:3 to the non-diabetes cohort on year of birth, sex, and smoking status using the dmatch command in R (V.2.7.1, R Foundation, Vienna, Austria) (statistical details of matching on see online supplementary material p6). This uses a nearest neighbor approach without replacement. Individuals in the non-diabetes cohort were allocated an index date equivalent to the matched date of the diagnosis of incident T2D. As this is a ‘virtual’ date, it was impractical to use the restriction of including only BMI values within 1 year of index date. We included smoking in the matching as it is a key determinant of mortality, and hence, it was appropriate to match on this (principles set out by Rosenbaum and Rubin27 and Rubin and Thomas28).
BMI measurements and other variables
BMI (weight and height) was extracted from the medical record (see online supplementary material Excel file) and categorized as follows: low-normal weight (18.5–22.49 kg/m2), high-normal weight (22.5–24.9 kg/m2), overweight (25.0–29.9 kg/m2), obese I (30.0–34.9 kg/m2), II (35–39.9 kg/m2), and III (≥40.0 kg/m2).
Individuals were classed as never or ever (combining current and former) smokers. Among ever smokers, 85% of participants contributed 10 or more smoking record entries. Consistency of ever/ never smoking categorization was high—only 11% were inconsistently recorded as current or former smokers with one or more ‘never’ smoker entries. These latter were classified as ever smokers.
In the matched cohorts, we additionally captured diagnosis of cardiovascular disease (CVD, classed as any cerebrovascular event or stroke, transient ischemic attack, heart failure, myocardial infarction, or angina) and any cancer diagnosis obtained from linkage with the National Cancer Intelligence Service, as comorbidities. For individuals with T2D, we captured data on systolic and diastolic blood pressures, serum total cholesterol, glycosylated hemoglobin (HbA1c), and metformin and insulin (ever/ never) use.
Statistical analyses
We compared matched characteristics using standard tests for continuous variables (Wilcoxon signed-rank) and categorical variables (McNamara). We tested for trends in baseline characteristics across the BMI categories using Cuzick's tests for continuous and Cochrane-Armitage tests for categorical ordered data.
The primary outcome measure was all-cause mortality, coded directly from general practice records. For time-to-event analyses, we used Cox regression models defining start of follow-up as date of diagnosis in the T2D cohort and matched index date in the non-diabetes cohort; and end of follow-up in both cohorts as death or date of data extraction from the database (30 June 2012), whichever came first. We expressed estimates of all-cause mortality as HRs and their 95% CIs.
Based on our methodological framework, we initially tested the effect of adjustment for smoking status (without stratification), using Cox models for T2D and non-diabetes cohorts with and without adjustment for smoking. Thereafter, a priori, we fitted separate Cox models by smoking status for each cohort. BMI category 22.5–24.9 kg/m2 was used as the referent category. Associations were expressed by BMI categories. For illustrative purposes, we presented these results graphically using floating absolute risk, which allows derivation of floating absolute risk CIs for all BMI categories including the referent category.29 Among never smokers, as associations of BMI with mortality were log-linear above BMI of 25 kg/m2, we expressed associations as HRs per 5 kg/m2 increase.
We adjusted all Cox models for age and sex. In the baseline T2D cohort, we fitted an additional Cox model that adjusted for systolic and diastolic blood pressures, serum total cholesterol, HbA1c, and metformin and insulin use (as ever/never terms). These adjustments made no material differences to the effect estimates (see online supplementary table S2), indicating that these did not contribute substantially to confounding, and were not reported in the main paper. The validity of the proportional hazards assumption was tested using Schoenfeld residuals (see online supplementary material p9). We used a likelihood ratio test to calculate p values for interactions in global models (combined diabetes and non-diabetes cohorts) including age, sex, BMI, diabetes status, and smoking status.
We performed sensitivity analyses testing assumptions of our models, as follows: (1) to test for the potential effects of reverse causality,30 we excluded individuals with <2-year follow-up; (2) to test the effect of age,15 we performed the main models stratified by above and below age 65 years (approximating the cohort median age); (3) to test the potential effect of follow-up duration,16 ,22 we performed the main models stratified by follow-up >5 years; and (4) to test for the potential effect of chronic diseases,1 ,22 we ran the main models excluding individuals with CVD and cancer. For all analyses, we used STATA (V.13, Stata Corp., Texas, USA).
Results
Baseline characteristics
After matching, there were 10 464 individuals with incident T2D, and 31 020 individuals who never developed T2D. The groups were well matched for gender, age, follow-up, and smoking status (table 1). Not unexpectedly, mean BMI was higher in the T2D cohort compared with the never diabetes cohort (p<0.001). Compared with never diabetes, the proportions with history of coronary heart disease was higher.
Characteristics of matched individuals with incident type 2 diabetes and never (non) diabetes cohorts, Salford Integrated Database (1995–2012)
Among individuals with T2D, 33.6% and 53.5% were overweight and obese, respectively, at the time of diabetes diagnosis (table 2). With increasing BMI category, there were decreases in mean age at diagnosis and proportion of ever smoker status; with increases in mean systolic and diastolic blood pressures, ever use of metformin and insulin. Among individuals who never developed diabetes, 40.1% and 24.7% were overweight and obese, respectively. The proportions with CVD generally increased with increasing BMI category.
Age and ever smoking proportions across BMI categories in individuals with incident type 2 diabetes and never (non)diabetes cohorts, Salford Integrated Database (1995–2012)
BMI and mortality
Among T2D patients, during a mean follow-up of 8.6 years, there were 1175 deaths; among the non-diabetes individuals, during a mean follow-up time of 8.7 years, there were 2613 deaths. Taking all T2D patients together (without stratification by smoking), the associations between BMI and all-cause mortality, adjusted for age and sex, were similar to those adjusted for age, sex, and smoking. Similarly, taking never diabetes individuals together, the associations between BMI and all-cause mortality differed little in Cox models adjusted for age and sex only compared with models that adjusted for age, sex, and smoking (see online supplementary table S3). This has been noted elsewhere1 and might indicate failure of regression adjustments to unmask the true effects of smoking.
BMI-mortality associations by smoking status
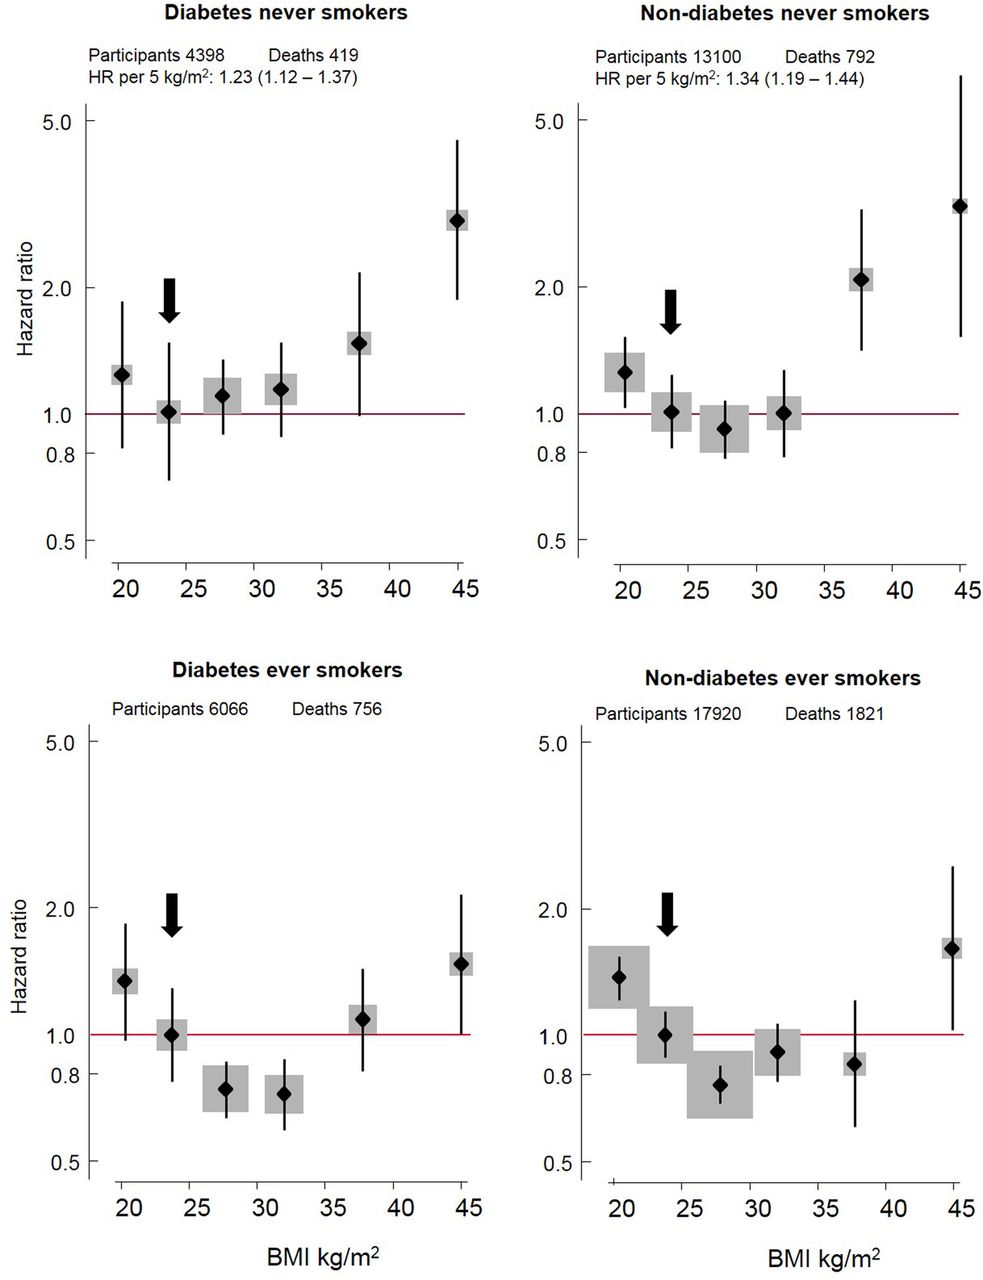
Figure 2 demonstrates graphically the associations between BMI and all-cause mortality. For never smokers, the hazard of all-cause mortality increased from 25 kg/m2, in a linear manner, with increasing BMI for T2D patients (HR per 5 kg/m2: 1.23, 95% CI 1.12 to 1.37, ptrend<0.001) and for non-diabetes individuals (HR per 5 kg/m2: 1.34, 95% CI 1.19 to 1.44, ptrend<0.001). In contrast, among ever smokers, for diabetes and non-diabetes cohorts, the BMI–mortality relationship was U-shaped with evidence for the obesity paradox (ie, risk estimates with CIs were below one) for the overweight categories (diabetes and non-diabetes), and obese I (diabetes).
Association of body mass index with all-cause mortality in diabetes and non-diabetes populations, by smoking status. Boxes are plotted against the mean body mass index (BMI) in each group using floating absolute risk models. The vertical lines represent absolute risk CIs. Sizes of box are proportionate to number of participants per category; proportionality is retained across the populations. Arrow indicates referent category. The HR per 5 kg/m2 higher BMI and its 95% CI are calculated (using Cox modeling) for BMI more than 25 kg/m2, restricted to never smokers.
The obesity paradox was further detailed, and shown to be limited to the ever smokers, in table 3. For BMI categories 18.5–22.49, 22.5–24.9 (referent); 25.0–29.9; 30.0–34.9; 35.0–39.9; and ≥40.0 kg/m2), the HRs in the T2D population who were ever smokers were: 1.34 (0.98 to 1.83); 1.00; 0.74 (0.59 to 0.92); 0.72 (0.56 to 0.92); 1.09 (0.81 to 1.46); 1.48 (1.03 to 2.11); and in the non-diabetes population who were ever smokers were 1.34 (1.17 to 1.53); 1.00; 0.75 (0.66 to 0.85); 0.91 (0.78 to 1.07); 0.82 (0.61 to 1.10); 1.69 (1.18 to 2.43). In contrast, there was no evidence of the obesity paradox among never smokers with and without diabetes.
HRs (and 95% CIs) of all-cause mortality across BMI categories in individuals with type 2 diabetes and without (never) diabetes, Salford Integrated Database (1995–2012) stratified by ever/never smoking status
Evidence of the obesity paradox in ever smokers, with and without T2D, argued against a selection bias. We further tested this, exploring interaction terms within global models that included diabetes and smoking status. The optimal model included a significant BMI-smoking interaction term (p=0.009) (see online supplementary table S4).
Sensitivity analyses
We performed various sensitivity analyses testing assumptions of our models (with and without diabetes by smoking status), and showed no material differences in the point estimates after we excluded individuals with <2-year follow-up (see online supplementary table S5); stratification by below (see online supplementary table S6) and above age 65 years (see online supplementary table S7); stratification by follow-up >5 years (see online supplementary table S8); and excluded individuals with CVD and cancer (see online supplementary table S9).
Discussion
Principal findings
In the UK urban population, we confirmed the findings of other studies that, among adults with T2D, being overweight or obese I, near the time of diagnosis, is associated with reduced all-cause mortality compared with normal weight. This is evidence for the obesity paradox. This observation was limited to ever smokers. Additionally and importantly, the obesity paradox was present among individuals who never had diabetes but were ever smokers, drawn from the same study population. These observations argue that smoking status is a greater determinant of the obesity paradox than selection bias. Among never smokers, with and without diabetes, beyond BMI of 25 kg/m2, increasing BMI was associated with increased all-cause mortality indicating that the observation of the obesity paradox, in certain subpopulations, does not challenge weight management recommendations in diabetes.
Relation to other studies
Seven other studies7–13 in diabetes cohorts that have observed the obesity paradox between BMI and all-cause mortality. The largest was based on the Scottish Diabetes Registry;11 however, this study limited its analysis to 106 640 patients out of 240 648 due to lack of data on BMI and other covariates. Notably, only the French E3N EPIC10 study analyzed BMI–mortality relationships in populations with and without diabetes, but sample sizes were modest—for example, only 54 deaths among the diabetes group. Some studies lacked information on known key covariates or failed to display results separately (notably for smoking7), which could mask effect modifications. Three studies 9 ,11 ,12 had median follow-up periods ≤5 years; short follow-up is known to be a potential bias and result in a U-shaped BMI–mortality relationship.22 Studies based on patients with chronic conditions (other than diabetes) observed the obesity paradox but concluded that relationships are driven by reverse causality (namely, unintentional weight loss);31 ,32 we explored this by limiting analyses to patients with at least 2-year follow-up, and found no material impact.
Our findings on BMI–mortality relationships among non-diabetes are consistent with a reported dose–response meta-analysis of 230 cohort studies,22 which demonstrated evidence of the obesity paradox among ever smoker general populations, though to a lesser extent, than seen in our population. That meta-analysis additionally concluded that ‘people with prevalent and preclinical disease could bias the results towards a more U-shaped association.’ It is conceivable that smoking is a surrogate for several chronic diseases other than diabetes in our population, and that these unmeasured variables among the ever smoker non-diabetes cohort contributed to the observed obesity paradox.
Weaknesses and strengths
The study has some limitations. First, the study included predominantly white British urban population, limiting generalizability. Ethnic differences exist for the etiological role of obesity in diabetes,33 and these in turn, might impact on BMI–mortality relationships but these could not be evaluated in the Salford cohort. Second, BMI values were missing in 7.9% of the diabetes and 25.9% of the never diabetes population. The recording of BMI might have been biased toward overweight/obese and/or less healthy individuals, though the consistency of our findings in sensitivity analyses, excluding individuals with CVD and cancer (as common chronic diseases), argue against the latter. Third, we matched our cohorts on smoking (as well as age and sex), such that this might have been a selection bias. We argued that in the paucity of data on comorbidities in the non-diabetes population, we used smoking as a surrogate of unmeasured chronic illnesses. As smoking is a key determinant of outcome, based on principles of matching,28 it was appropriate to do so.
The study has several strengths. First, this was a large sample, from a stable population, with long follow-up (see online supplementary table S1 for comparisons). The Salford NHS data were well characterized and reported elsewhere as a validated source of information on chronic conditions.34 Second, much of the diabetes management is contemporaneous, addressing concerns raised by Logue and colleagues16 of the combined analysis Nurses' Health Study and Health Professionals Study,14 which failed to demonstrate an obesity paradox, but where most antidiabetes treatment was based in the 1970s and 1980s. Third, we demonstrated the importance of stratification by smoking status to disentangle the ‘true’ effects of BMI on all-cause mortality. Simple regression adjustment by smoking status may fail to unmask the effects of smoking, a paradigm noted in the Global BMI Mortality Collaboration study.1 Fourth, we performed several sensitivity analyses to explore potential biases, and found no material influences on our findings.
Meaning of study
Our motivation was to explore the obesity paradox in individuals with and without T2D, thus disentangling confounding and selection bias, and supporting our mathematically-founded hypothesis that collider bias only partially explains the obesity paradox.25 Other explanations are plausible, including factors such as reverse causality or unintentional weight loss.22 As an additional dimension, diabetes driven by obesity might be a different disease than diabetes driven by other factors, such as the ageing process, and the risk patterns (including mortality) might be different. We argue that although the above explanations are plausible, the observations of the obesity paradox in our cohort and other datasets are in the main explained through methodological mechanisms, namely unmeasured confounding, effect modification and selection bias, and are not true causal effects. The obesity paradox has evoked a notion that overweight, or even obesity, is protective in regards to chronic disease. This interpretation needs caution to avoid clinical guidance advocating that patients maintain a clinically obese BMI.20
Unanswered questions and future research
There remains a need to test the hypothesis that weight loss in overweight/obese patients reduces all-cause mortality, although there is indirect evidence that this is probably true in morbidly obese patients with diabetes following bariatric surgery.35 There also remains the question whether or not the obesity paradox is an issue specific to BMI as an ‘adiposity’ exposure. Further studies using different measures of adiposity (eg, body composition and measures of central adiposity) are needed. In these new studies, detailed quantification and timing of comorbidities and smoking exposure are essential. The co-occurrence of obesity with T2D is an important common public health problem—it is critical that the relationship between these, and their impact on mortality, is correctly evaluated to inform clinical management for millions of individuals with diabetes worldwide.
Acknowledgments
We acknowledge the generous funding from the EASD. We would like to thank NHS staff who extracted the data from the SIR. We thank Dr Matthew Carr for statistical support identifying read codes; and Dr Artur Akbarov for developing the matching command in R. We would like to thank NHS staff who extracted the data from the SIR.
References
Footnotes
Contributors EB performed analysis, data interpretation, and contributed to all sections of the manuscript. AGR conceptualized the paper and contributed to all sections of the manuscript. MS contributed to statistical interpretation and all sections of the paper. IEB contributed to all aspects of interpretation and all sections of the paper.
Funding This work was supported by European Foundation for the Study of Diabetes. Funding for EB is from the Medical Research Council grant number MR/K006665/1.
Competing interests AGR has received lecture honoraria from Merck Serona and Janssen-Cilag, and independent research funding from Novo Nordisk. IB has received honoraria from Merck and GlaxoSmithKline. Other authors have no conflicts to declare.
Ethics approval 11/EM/0337 NREC committee East Midlands- Nottingham 1, UK.
Provenance and peer review Not commissioned; externally peer reviewed.
Data sharing statement No additional data are available.