Article Text

Abstract
Objective We measured insulin sensitivity with euglycemic clamp (Si-clamp) in initially normoglycemic African Americans (AA) and European Americans (EA), to probe the existence of subphenotypes of obesity and leanness, and their impact on incident dysglycemia during longitudinal follow-up.
Research design and methods 320 healthy subjects (176 AA, 144 EA; mean age 44.2±10.6 years) underwent baseline assessments, including Si-clamp and homeostasis model of insulin resistance (HOMA-IR) and were stratified into: insulin-resistant obese (IRO) (body mass index (BMI) >30 kg/m2, Si-clamp <0.1, HOMA-IR >2.5); insulin-sensitive obesity (ISO) (BMI >30 kg/m2, Si-clamp >0.1, HOMA-IR <2.5); insulin-resistant non-obese (IRN) (BMI <28 kg/m2, Si-clamp <0.1, HOMA-IR >2.5); insulin-sensitive non-obese (ISN) (BMI <28 kg/m2, Si-clamp >0.1, HOMA-IR <2.5). Outcome measures were cardiometabolic risks and incident pre-diabetes/type 2 diabetes (T2D) during 5.5 years.
Results Compared with IRO, subjects with ISO had lower abdominal fat, triglycerides and high-sensitivity C reactive protein and higher adiponectin (p=0.015 to <0.0001). IRN subjects had higher cardiometabolic risk markers than ISN (p=0.03 to <0.0001). During 5.5-year follow-up, incident pre-diabetes/T2D was lower in ISO (31.3% vs 48.7%) among obese subjects and higher in IRN (47.1% vs. 26.0%) among non-obese subjects (p=0.0024). Kaplan-Meier analysis showed significantly different pre-diabetes/T2D survival probabilities across insulin sensitivity/adiposity phenotypes (p=0.0001).
Conclusions Insulin sensitivity predicts ~40% decrease in the relative risk of incident pre-diabetes/T2D among obese persons, whereas insulin resistance predicts ~80% increased risk among non-obese persons. This is the first documentation of healthy and unhealthy phenotypes of obesity and leanness in a prospective biracial cohort, using rigorous measurement of insulin sensitivity.
- pre-diabetes
- obesity metabolism
- ethnic comparisons
- cardiovascular disease risk
This is an Open Access article distributed in accordance with the Creative Commons Attribution Non Commercial (CC BY-NC 4.0) license, which permits others to distribute, remix, adapt, build upon this work non-commercially, and license their derivative works on different terms, provided the original work is properly cited and the use is non-commercial. See: http://creativecommons.org/licenses/by-nc/4.0/
Statistics from Altmetric.com
Significance of this study
What is already known about this subject?
Previous studies have identified subsets of metabolically healthy obese (MHO) and metabolically obese, normal weight (MONW) individuals.
Although implied as the underlying mechanism for the MHO and MONW phenotypes, insulin sensitivity is seldom measured directly in the published reports.
What are the new findings?
Using hyperinsulinemic euglycemic clamp to directly assess insulin sensitivity in a normoglycemic cohort, the present study documents insulin-sensitive and insulin-resistant phenotypes among obese and non-obese African Americans and European Americans.
Insulin-sensitive obese (ISO) subjects had a favorable cardiometabolic risk profile and showed decreased risk of incident dysglycemia, compared with insulin-resistant obesity.
Insulin-resistant non-obese (IRN) subjects exhibited an unfavorable cardiometabolic risk profile and accelerated progression from normoglycemia to dysglycemia during 5.5 years of follow-up.
The observed ISO and IRN phenotypes roughly mirror the MHO and MONW characteristics.
How might these results change the focus of research or clinical practice?
A longer follow-up study is needed to assess the stability of the ISO phenotype and to determine whether the association between insulin-sensitivity phenotypes and incident pre-diabetes extends to type 2 diabetes.
Intervention studies are needed to determine the impact of insulin-sensitivity phenotypes on the efficacy of lifestyle interventions on prevention of type 2 diabetes and reversal of pre-diabetes.
Introduction
A phenotype of obesity characterized by preserved insulin sensitivity and paucity of components of the metabolic syndrome is being increasingly recognized.1–5 Variously referred to as ‘metabolically healthy obesity’, ‘metabolically benign obesity’, or ‘insulin-sensitive obesity’ (ISO), this phenotype has been reported in approximately 10%–40% of obese people,6–9 including those with extreme obesity.8 The obverse—a subset of normal weight persons who harbor >2 components of the metabolic syndrome—has also been described.8–10 Such individuals have been referred to as having the ‘metabolically obese, normal weight’ (MONW) phenotype.8–10 As conventionally defined, metabolically healthy obesity exists in any individual who is obese (body mass index (BMI) >30 kg/m2) but has fewer than two components of the metabolic syndrome and shows evidence of preservation of insulin sensitivity.1–10 The latter is usually documented by calculating the homeostasis model of insulin resistance (HOMA-IR) from fasting insulin and glucose levels or indices derived from oral glucose tolerance tests.1–10 Fasting glucose, waist circumference, blood pressure (BP), triglycerides and high-density lipoprotein (HDL) cholesterol levels are among the five metabolic syndrome components11 used to classify individuals as metabolically ‘healthy’ or ‘unhealthy’.1–10 However, these are not mutually exclusive traits, as much collinearity exists among the components.12 13 Moreover, some of the metabolic syndrome markers (such as triglycerides and HDL cholesterol) display ethnic variations in normative values.14
As insulin resistance drives metabolic syndrome components in unfavorable directions,15 the use of those same components for defining phenotypes of obesity is a metaphor for documentation of insulin sensitivity. Publications describing the metabolically healthy or unhealthy phenotypes of obesity and leanness have traditionally been based on less rigorous assessment of insulin sensitivity, despite the implied centrality of insulin action in the classification.16 However, more recent studies in the field have used hyperinsulinemic euglycemic clamp to define insulin sensitivity status.17–19 Numerous studies have reported that the metabolically healthy obese (MHO) phenotype may be associated with a better cardiometabolic risk profile and decreased incidence of type 2 diabetes (T2D) compared with the metabolically unhealthy phenotype.1–8 16 17 20 21 In the Framingham Offspring Study of predominantly white subjects, insulin sensitivity status (as determined by HOMA-IR) significantly influenced the risk of incident T2D, with lower hazard among insulin-sensitive obese subjects and higher hazard among insulin-resistant non-obese (IRN) subjects.20 In a pooled analysis of eight prospective studies, the adjusted relative risk for incident T2DM was 2.2-fold higher in metabolically unhealthy obese subjects compared with MHO subjects.21
Clearly, the concept of metabolically healthy and unhealthy phenotypes of obesity and lean stature remains intriguing. However, data in the literature are limited by imprecise definitions, restricted demography, and the use of surrogates or superficial assessment of insulin sensitivity.16 Another drawback is inclusion of elevated fasting glucose among the risk markers used for defining the phenotypes: even mild elevations in plasma glucose can alter lipid metabolism and activate reactive oxygen species and proinflammatory cytokines, making it difficult to separate primary from secondary phenomena.22 23 The Pathobiology of Pre-diabetes in a Biracial Cohort (POP-ABC), a longitudinal study of initially normoglycemic African Americans (AA) and European Americans (EA) with parental T2D,24–26 afforded an opportunity to use rigorously defined insulin sensitivity status to probe the nosological phenotypes of obese and non-obese habitus, denominated by heterogeneity in insulin sensitivity, in a biracial cohort. Specifically, we aimed to answer the following questions: (1) to what extent do similarly obese individuals differ regarding hepatic and whole-body insulin sensitivity; (2) to what extent do similarly non-obese individuals differ regarding hepatic and whole-body insulin sensitivity; and (3) to what extent does the presence of insulin sensitivity in obese subjects, or insulin resistance in non-obese subjects, affect the rate of progression from normoglycemia to pre-diabetes/T2D?
Research design and methods
Study subjects
The study subjects were participants in the POP-ABC study.24–26 Inclusion criteria for the POP-ABC study were as follows: age 18–65 years; non-Hispanic white (EA) or non-Hispanic black (AA) race/ethnicity status; biological parent(s) with T2D. In addition, participants completed a screening of 75 g oral glucose tolerance test (OGTT) and were enrolled if they had normal fasting plasma glucose (FPG) (<100 mg/dL (5.6 mmol/L)) or normal glucose tolerance (2-hour plasma glucose (2hrPG) <140 mg/dL (7.8 mmol/L)). All participants were ambulatory, in good overall health, and were not taking medications known to alter body weight, insulin sensitivity, glucose, lipids or BP. The University of Tennessee Institutional Review Board approved the study and all participants signed written informed consent before initiation of study, which was conducted according to the World Medical Association's Declaration of Helsinki.
Assessments
All procedures were conducted at the University of Tennessee General Clinical Research Center (GCRC). Baseline assessments included medical history and examination, measurement of height, weight and waist circumference, and a standard 75 g OGTT.26 The BMI was calculated as the weight in kilogram divided by the height in meter squared. Measures of food habits and physical activity were also recorded, as previously described.27
Total, trunk, and lean body mass were measured using DEXA. Additional assessments included FPG measured quarterly, OGTT annually, insulin secretion annually, and insulin sensitivity in years 1, 3 and 5, as previously described.24–26 The primary outcome was the development of pre-diabetes (FPG 100–125 mg/dL (5.6–6.9 mmol/L) and/or 2hrPG 140–199 mg/dL (7.8–11.0 mmol/L)) or diabetes, as defined by the American Diabetes Association criteria.28 29
Insulin sensitivity and insulin secretion
Whole-body insulin sensitivity was measured using the hyperinsulinemic euglycemic clamp method of DeFronzo et al.30 In brief, subjects who had fasted overnight underwent the clamp studies at the GCRC. After placement of intravenous cannulas in both arms, a primed, continuous intravenous infusion of regular insulin (2 mU/kg/min; 14.4 pmol/kg/min) was administered for 180 min while maintaining blood glucose level at ~100 mg/dL (5.6 mmol/L) with a variable rate dextrose (20%) infusion. Arterialized blood sampling was performed every 10 min. The rate of total insulin-stimulated glucose disposal (M) was calculated from the dextrose infusion rate during steady state (final 60 min of insulin infusion). The M value was corrected for the steady-state plasma insulin levels, to derive the final insulin sensitivity index (Si-clamp, µmol/kg fat-free mass/min/pmol/L).24 26 29 30 Acute insulin response to glucose (AIR) was assessed using the frequently sampled intravenous glucose tolerance test, as previously described.24 26 The HOMA-IR, an estimate of hepatic insulin sensitivity, and (HOMA-B), an estimate of beta-cell function, were derived from fasting glucose and insulin values.31
Biochemical measurements
Plasma glucose was measured with a glucose oxidase method (Yellow Spring Instruments, Yellow Spring, OH, USA). Plasma levels of insulin, high-sensitivity C reactive protein (hsCRP), adiponectin and leptin were measured with commercial ELISA kits in our Endocrine Research Laboratory. Hemoglobin A1c (HbA1c) and fasting plasma lipid profiles were measured in a contract clinical laboratory.
Definition of insulin sensitivity and adiposity subgroups
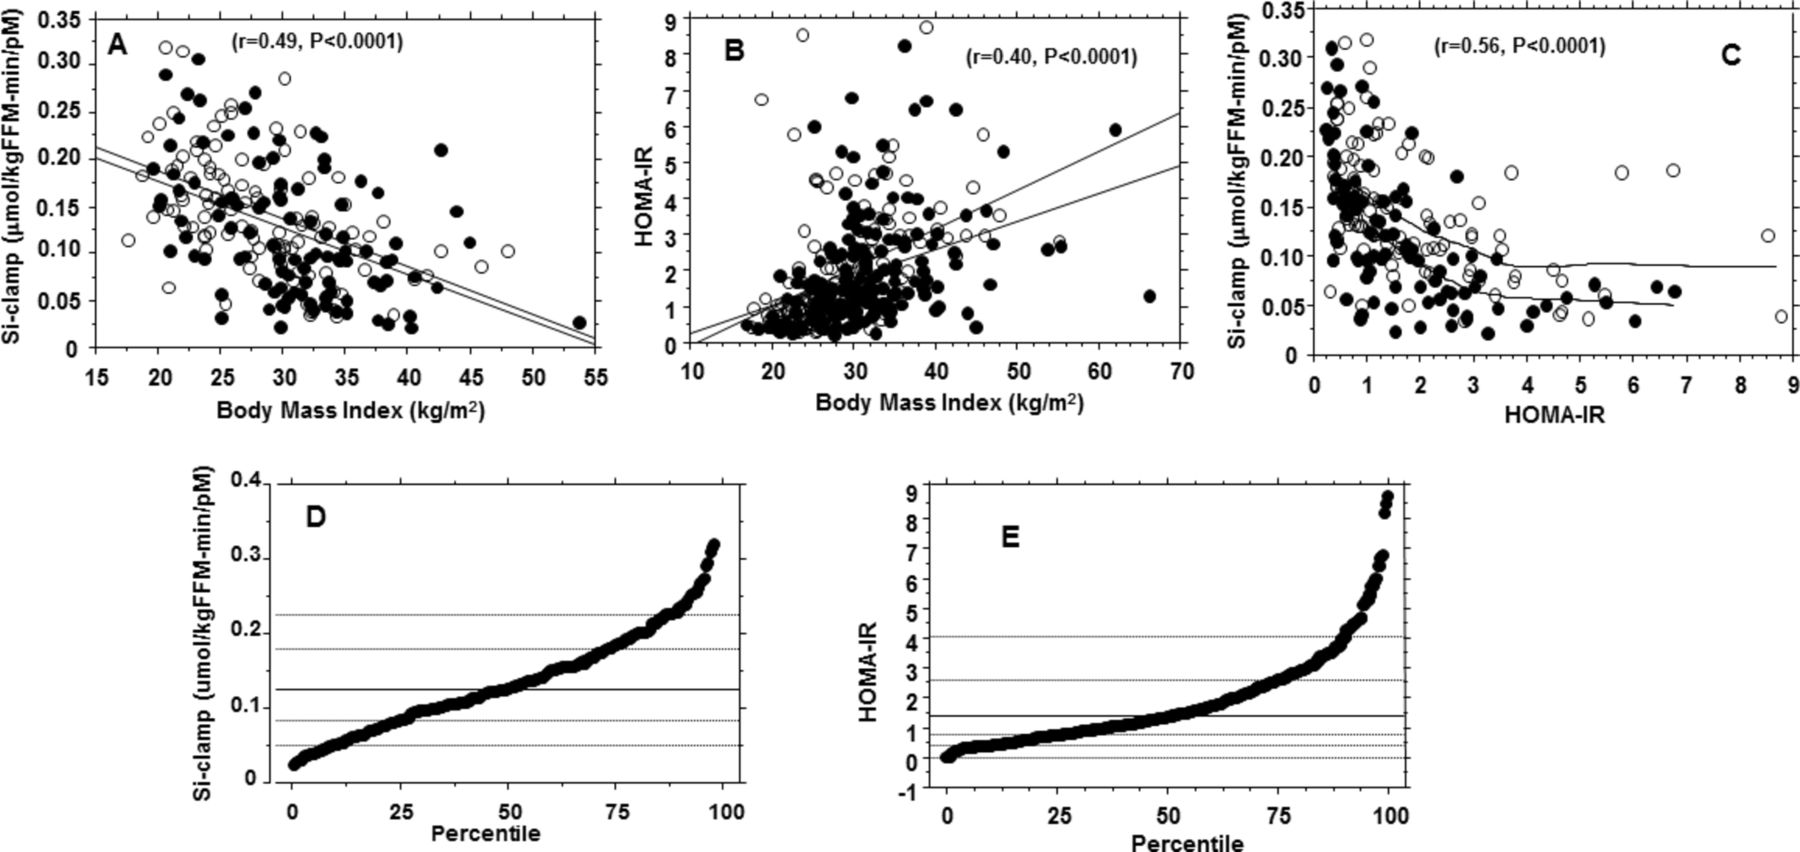
Using BMI data from our cohort, we stratified study subjects into obese (BMI >30 kg/m2) and non-obese (BMI <28 kg/m2) groups. From the cohort distributions of Si-clamp and HOMA-IR values, we defined insulin resistance as a Si-clamp value below the 25th percentile (<1.0 µmol/kg fat-free mass/min/pmol/L) and/or an HOMA-IR value above the 75th percentile (>2.5). Thus, the BMI and insulin sensitivity data enabled the stratification of study subjects into four subgroups: (1) insulin-resistant obese (IRO) (BMI >30 kg/m2, Si-clamp <0.1 and/or HOMA-IR >2.5); (2) ISO (BMI >30 kg/m2, Si-clamp >0.1 and/or HOMA-IR <2.5; (3) IRN (BMI <28 kg/m2, Si-clamp <0.1 and/or HOMA-IR >2.5); (4) insulin-sensitive non-obese (ISN) (BMI <28 kg/m2 and/or Si-clamp >0.1, HOMA-IR <2.5). Figure 1 shows the regression plots of Si-clamps and HOMA-IR versus BMI, the agreement between the two measures of insulin sensitivity, and the percentile distribution of Si-clamp and HOMA-IR.

Upper panel: Regression plots of insulin sensitivity (Si-clamp) (A) and homeostasis model of insulin resistance (HOMA-IR) (B) versus body mass index, and Si-clamp versus HOMA-IR (C), in African Americans (closed circles) and European Americans (open circles). Lower panel: Percentile distribution of Si-clamp (D) and HOMA-IR (E) in the study cohort. HOMA-IR data were obtained in 320 subjects, of whom 206 underwent hyperinsulinemic euglycemic clamp to generate Si-clamp data.
Statistical analysis
Data were reported as means±SD. Significance level was set as p<0.05. Percentile plots were generated to determine the 25th and 75th percentiles for Si-clamp and HOMA-IR, respectively. Unpaired t-tests were used to compare continuous variables and χ2 and χ2 for trend (Cochran-Armitage) tests were used for categorical data. General linear regression models were used to compare baseline anthropometric and cardiometabolic characteristics in IRO, IRN, ISO and ISN groups of subjects. The relationship between Si-clamp or HOMA-IR versus BMI was analyzed using linear regression and Pearson correlation coefficients. The relationship between Si-clamp and HOMA-IR was analyzed using polynomial regression with Lowess model for curve fitting. Kaplan-Meier plots for the probability of incident pre-diabetes/diabetes in defined groups of obese and non-obese subjects were compared using log-rank test. Statistical analyses were performed with Statview and SAS statistical software, V.9.3 (SAS Institute).
Results
Cohort characteristics
We analyzed data from 320 (176 AA, 144 EA) study participants. At enrollment, the mean (±SD) age was 44.2±10.6 years, BMI was 30.2±7.23 kg/m2, FPG was 91.8±6.77 mg/dL, 2hrPG was 124±25.8 mg/dL, and HbA1c was 5.56%±0.44%, for the cohort. The mean systolic BP was 121±16.1 mm Hg, diastolic BP was 72.8±9.1 mm Hg, triglycerides was 94.3±53.3 mg/dL, HDL cholesterol was 52.6±13.7 mg/dL (46.1±12.4 mg/dL in men; 55.2±13.4 mg/dL in women) and waist circumference was 94.3±15.6 cm (97.9±15.2 cm in men; 92.7±15.6 cm in women). Table 1 shows the baseline characteristics for participants in the four insulin sensitivity/adiposity strata.
Baseline clinical and biochemical characteristics of study subjects by obesity and insulin sensitivity status
Subjects in the ISN group were, on average, 2–4 years older than those in the other groups, but the age differences were not statistically significant. Similarly, there were no significant differences in gender or ethnic composition across the subgroups. Glycemic measures (FPG, 2hrPG and HbA1c) at enrollment were similar across subgroups, as expected in a cohort selected for initial normoglycemia.24–26 The mean BMI values in the two obese subgroups (36.7 kg/m2 in IRO and 35.1 kg/m2 in ISO) and the two non-obese subgroups (26.4 kg/m2 in IRN and 24.2 kg/m2 in ISN) were in line with the study targets. Self-reported food habits and physical activity were not significantly different across the subgroups (table 1).
The HOMA-IR values for insulin resistance and the Si-clamp values for insulin sensitivity were internally consistent and robust at demarcating IRO, IRN, ISO and ISN subjects (table 1). Using the BMI cut-off of >30 kg/m2 and defining prevalent insulin resistance as Si-clamp <0.1 µmol/kg fat-free mass/min/pmol/L and/or HOMA-IR >2.5, 30% (96/320) of the study cohort (or 55.8% of the obese subjects) had ISO. In contrast, the IRN status was observed in only 5.3% (17/320) of the cohort (or 11.5% of non-obese subjects) (table 1). HOMA-IR data were obtained in all 320 subjects, of whom 206 underwent hyperinsulinemic euglycemic clamp to generate the Si-clamp data.
Cardiometabolic measures
Among the obese subgroups, ISO subjects had lower values for waist circumference (p=0.007), total body fat (p=0.009), trunk fat (p=0.0032), serum triglycerides (p=0.0019), hsCRP (p=0.013) and insulin secretion (p=0.0061), and higher adiponectin levels (p=0.003) compared with IRO subjects (table 2). The ISO group also had lower values for basal (HOMA-B, p<0.0001) and glucose-stimulated (AIR, p<0.0061) insulin secretion compared with the IRO group. Systolic and diastolic BP were not significantly different between the two obese subgroups. In the non-obese subgroups, IRN subjects had higher values for waist circumference (p<0.0001), systolic (p=0.03) and diastolic (p=0.009) BPs, total body fat (p=0.015), trunk fat (p=0.0032), serum triglycerides (p=0.0019) and leptin (p=0.02), and lower adiponectin (p=0.006) and HDL cholesterol (p=0.0013) levels compared with ISN subjects. The IRN group also had higher values for basal (HOMA-B, p<0.0001) and glucose-stimulated (AIR, p<0.0001) insulin secretion compared with ISN lean subjects. Resting energy expenditure, normalized to lean mass, did not differ significantly across the four comparison groups. The cardiometabolic characteristics are summarized in table 2.
Cardiometabolic characteristics of study subjects by obesity and insulin sensitivity status
Progression to pre-diabetes
During 5.5 years of follow-up (mean 2.62 years), 100 of the 320 subjects developed incident pre-diabetes and 10 additional participants were diagnosed with T2D. Figure 2A shows the clamp-derived measures of insulin sensitivity in obese and non-obese participants. In the obese group, 37 of 76 IRO subjects (compared with 30 of 96 ISO subjects) developed pre-diabetes/T2D during follow-up. In the non-obese group, 8 of 17 IRN subjects (compared with 34 of 131 ISN subjects) developed incident pre-diabetes/T2D. The cumulative incidence of pre-diabetes/T2DM was 48.7% in the IRO group, 31.3% in the ISO group, 47.1% in the IRN group and 26.0% in the ISN group (χ2 for trend p=0.0024) (figure 2B). Among the obese group, participants whose insulin sensitivity (Si-clamp) was above the 25th percentile had a 37% lower risk of incident pre-diabetes/T2D compared with those whose insulin sensitivity was below the 25th percentile or whose insulin resistance (HOMA-IR) was above the 75th percentile. Among the non-obese participants, the presence of insulin resistance at baseline predicted a nominal 80% higher risk of incident dysglycemia compared with ISN subjects. The Kaplan-Meier disease-free survival analysis (figure 2C) showed a higher pre-diabetes/T2D survival probability for ISO subjects versus IRO subjects, and a lower survival probability for IRN subjects versus ISN participants (p=0.0001).

Insulin sensitivity (Si-clamp) in obese and non-obese study subjects (A) and cumulative incidence of pre-diabetes/type 2 diabetes in insulin-resistant obese (IRO), insulin-sensitive obese (ISO), insulin-resistant non-obese (IRN) and insulin-sensitive non-obese (ISN) subjects (B). The cumulative incidence was 48.7% in IRO, 30.9% in ISO, 47.1% in IRN and 26% in ISN groups, respectively (χ2 P for trend=0.0024). (C) Kaplan-Meier plot of pre-diabetes/type 2 diabetes survival among participants stratified by IRO, IRN, ISO or ISN status (log-rank sum p=0.0001).
Discussion
The existence of insulin-sensitive (metabolically ‘healthy’) and insulin-resistant, (metabolically ‘unhealthy’) phenotypes of obese and lean subjects has been the subject of several previous reports.1–10 16 However, there is a lack of consistency in the definition of those phenotypes, and their generalizability across racial/ethnic groups is unclear. Although insulin sensitivity is implied as a foundational construct in the classification of individuals into metabolically healthy versus unhealthy groups, it is seldom measured.1–10 16 Of the studies that assessed insulin sensitivity, calculation of HOMA-IR has been the predominant approach,7 16 20 although some recent studies have used the more rigorous hyperinsulinemic euglycemic clamp.17–20 As is well-known (and confirmed in the present study, figure 1), the correlation between HOMA-IR (an estimate of hepatic insulin sensitivity) and Si-clamp (a direct measurement of whole-body insulin sensitivity, using hyperinsulinemic euglycemic clamp) is far from perfect.32 33
Using a stricter definition of insulin sensitivity in the present study, we validate the existence of insulin-sensitive and insulin-resistant phenotypes among obese and non-obese individuals. Our study cohort had a large representation (55%) of AA, which allowed us to specifically document the fidelity of these phenotypes in a non-Caucasian population. Unlike previous contributions on the subject, where the components of the metabolic syndrome were substituted as surrogates for insulin sensitivity, our approach stratified obese and non-obese study subjects purely based on insulin sensitivity. The threshold for insulin sensitivity used in the present study (>0.1 µmol/kg fat-free mass/min/pmol/L) corresponds to a level previously characterized as indicative of insulin-sensitive, glucose-tolerant status among healthy subjects34; the HOMA-IR cut-off point for insulin resistance (>2.5) in the present study is also consistent with published practice.8 16 20 We observed a plethora of cardiometabolic risk markers that aligned congruently with insulin sensitivity status, with high fidelity in obese and non-obese subjects. Several of these markers (including waist circumference, total and abdominal fat, hsCRP, adiponectin, hyperinsulinemia, BP, triglycerides, and HDL cholesterol) were differentially expressed among ISO, ISN, IRO and IRN participants in our biracial cohort. In general, the finding of preserved insulin sensitivity in obese individuals attenuated the expected adverse cardiometabolic profile, and insulin resistance in non-obese individuals was associated with an adverse cardiometabolic profile. It is noteworthy that these findings were observed in normoglycemic individuals, before any confounding effects of hyperglycemia-induced perturbations.22 23
Our findings support the existence of heterogeneity in cardiometabolic risk status among similarly obese or non-obese individuals. We show that measured insulin sensitivity correctly identified the expected pattern of co-segregation of cardiometabolic risk markers, regardless of obese or non-obese status. Although direct comparison is difficult, due to methodological differences, our ISO subjects display the properties associated with the MHO phenotype and our IRO subjects would be analogous to the ‘metabolically unhealthy obese’ (MUO) subjects described in the literature.1–10 16 Similarly, the non-obese subjects with insulin resistance in our study (IRN) resemble the MONW individuals and our ISN subjects are akin to the ‘metabolically healthy, normal weight individuals’ (MHNW).1–10 16 Note, however, that our study population was a healthy cohort with a mean BP of <130/80 mm Hg, triglycerides of <150 mg/dL, FPG of <100 mg/dL, HDL cholesterol of >50 mg/dL and waist circumference of 97.9 cm in men and 92.7 cm in women. The traditional approach of classifying MHO/MUH and MONW/MHNW phenotypes, based on the presence or absence of two of five metabolic syndrome markers, would have misclassified nearly all the IRO and IRN subjects as ‘metabolically healthy’.2–11 16
In contrast, our approach of phenotyping obese individuals as ISO or IRO and non-obese subjects as IRN or ISN, based on measured insulin sensitivity, was remarkably sensitive at identifying a clustering of subclinical perturbations in cardiometabolic risk factors (table 2). Indeed, ours is the first study that has employed rigorous measurement of insulin sensitivity to document healthy and unhealthy phenotypes of obesity and leanness in a prospective biracial cohort. The frequency of the MHO phenotype was 30% in our study population (55.8% of the obese group). Previous estimates of the MHO phenotype from mostly Caucasian populations have been in the 10%–40%.1–10 16 35 In a study of 343 AA obese subjects, 96 (28%) were classified as having the MHO phenotype, based on components of the metabolic syndrome.36 In another report, 36 of 126 obese AA (28.5%) had the MHO phenotype, defined as a BMI ≥30 kg/m2, HDL cholesterol ≥40 mg/dL, and absence of T2D or hypertension.37
The frequency of the ISO phenotype in the obese group of our study (55.8%) is numerically higher than previously reported estimates for MHO. Data from National Health and Nutrition Examination Survey 1999–2004 showed that 51.3% of overweight adults and 31.7% of obese adults were metabolically healthy.9 Besides methodological differences, the reason for the higher frequency of the ISO phenotype might be the unique characteristics of our study subjects, all of whom have parents with T2DM but were required to have normoglycemia at enrollment. Given their mean age of 44 years and their strong genetic risk for T2DM, it is likely that obese offspring of parents with T2DM who met the eligibility criterion of normoglycemia had an enrichment of subjects with healthier insulin sensitivity. Thus, a more representation cross-section of the general population would be expected to have a lower proportion of individuals with ISO than was observed in our study. We also observed that the IRN phenotype was present in 5% of our entire cohort (11.5% of non-obese subjects). Other studies have reported frequencies ranging from 5% to 45% for the MONW.9 10 16 35 Based on our population distributions, the ISO (or MHO-like) phenotype is more prevalent than the IRN (or MONW-like) phenotype, which would be teleologically congruent. Preservation of insulin sensitivity would be an adaptive trait among obese persons, whereas an insulin-resistant lean phenotype would seem maladaptive.
The insulin-sensitive or MHO phenotype has been associated with decreased risk of cardiovascular disease,16 20 38 although mortality data are discordant.39 In the predominantly Caucasian Framingham Offspring Study, lower insulin resistance (assessed by HOMA-IR) was associated with decreased risk of incident T2DM among obese subjects, whereas higher insulin resistance predicted increased diabetes risk in non-obese subjects.20 In the present study, ISO (compared with IRO) subjects had a 37% relative decrease, and IRN (compared with ISN) subjects had an 80% relative increase, in incident pre-diabetes/T2D. Although the small number of participants in the IRN group should temper conclusions, our findings extend the previous report from the Framingham Offspring Study20 to a broader demographic group and a more proximal stage in the pathogenesis of diabetes. The mechanisms underlying the existence of ISO, ISN, IRO and IRN phenotypes are not fully understood. Putative mechanisms/mediators include visceral fat abundance and hepatic enzymatic activity,8 40 pathways involving natural killer cells41 and endocannabinoids,42 and expression of lipogenic transcription factors,43 among others. In experimental models, overexpression of adiponectin recapitulates elements of the MHO phenotype.44 In the present study, the insulin-sensitive phenotype was associated with higher adiponectin levels compared with the insulin-resistant phenotype in obese and non-obese subjects. Previous reports have also associated higher adiponectin levels with MHO phenotype36 45 and decreased risk of incident pre-diabetes.46
The strengths of our analysis include the unique biracial cohort, specific documentation of insulin sensitivity, and the longitudinal follow-up design. Furthermore, by studying a generally healthy, normoglycemic cohort, we avoided confounding from secondary effects of hyperglycemia, dyslipidemia or other perturbations on important cardiometabolic variables. We also obtained behavioral measures (food habits and physical activity), which, though self-reported, nonetheless allowed us to eliminate gross differences as a possible explanation for our findings. The major weakness is that our study was confined to offspring of parents with T2D, and thus our findings may not be generalizable to the larger population. Also, the hyperinsulinemic euglycemic clamp is tedious and not amenable to translation. Indeed, even the simpler HOMA-IR, which requires measurement of fasting plasma insulin and glucose, may be beyond the reach of primary care practice. It is, therefore, reassuring that our study essentially validates the existence of metabolically healthy and unhealthy obese and non-obese phenotypes that were largely deduced from the use of simpler clinical traits and routine laboratory tests. Also, pre-diabetes is a heterogenous condition, and individuals with impaired fasting glucose and those with impaired glucose tolerance may not have identical penetrance of insulin resistance and related metabolic perturbations.47 Furthermore, the MHO phenotype may not be stable over time, as nearly one-third of individuals have been reported to convert to a metabolically less healthy phenotype.48
In conclusion, using rigorous methodology for quantitation of insulin sensitivity, we have demonstrated that ISO is quite prevalent, is associated with a favorable cardiometabolic profile, and is protective of incident pre-diabetes/T2D among AA and EA with parental history of diabetes.
Acknowledgments
We are indebted to the participants who volunteered for this study.
References
Footnotes
Contributors SD-J: principal investigator, designed study, wrote manuscript. IO: collected data, reviewed and revised manuscript. NU: collected data, reviewed and revised manuscript. CP: collected data, reviewed and revised manuscript. JW: performed statistical analysis, reviewed and revised manuscript. SD-J, as the guarantor, takes full responsibility for the work including the study design, access to data, and the decision to submit and publish the manuscript.
Funding The POP-ABC study was supported by grants R01 DK067269 and R01 DK067269-04S1 from the National Institutes of Health and grant 7-07-MN-13 from the American Diabetes Association. The funding sources had no role in the design and execution of the POP-ABC study, or analysis and publication of the data obtained from the study.
Competing interests None declared.
Ethics approval The University of Tennessee Institutional Review Board.
Provenance and peer review Not commissioned; internally peer reviewed.
Data sharing statement No additional data are available.
Collaborators POP-ABC Research Group: Current: Samuel Dagogo-Jack, MD (Principal Investigator), Ann Ammons, BS, Amy Brewer, MS, RD, Fatoumatta Ceesay, BS, Ibiye Owei, MBBS, MPH, Casey Provo, MS, LDN, Nkiru Umekwe, MBBS, Jim Wan, PhD. Past members: Emmanuel Chapp-Jumbo, MBBS (2009–2011), Chimaroke Edeoga, MBBS, MPH (2007–2013), Ruben Cuervo, MD (2006–2007), Sotonte Ebenibo, MBBS, MPH (2011–2014), Nonso Egbuonu, MBBS (2007–2010), Nicoleta Ionica, MD (2007–2008), Dorota Malinowski, MD (2007–2008). Consultant: Steven Haffner, MD; Data and Safety Officer: Murray Heimberg, MD, PhD.