Article Text

Abstract
Objective To compare the associations of diabetes mellitus risk factors with nontraditional markers of hyperglycemia (glycated albumin, fructosamine, 1,5-anhydroglucitol (1,5-AG)) to those observed with traditional markers (fasting glucose, hemoglobin A1c (HbA1c)).
Design Cross-sectional study.
Setting The community-based Atherosclerosis Risk in Communities (ARIC) Study cohort.
Participants A subsample of 1764 participants (309 with diagnosed diabetes and 1455 without diagnosed diabetes) from the ARIC Study who attended a clinic visit in 2005–2006.
Main outcome measures Elevated levels of glycated albumin, fructosamine, 1,5-AG, fasting glucose, and HbA1c in persons with and without a diagnosis of diabetes.
Results The mean age of participants was 70 years (SD, 6), 43% were men, and 20% were African-American. Black race and family history of diabetes were generally positively associated with elevated levels of all biomarkers of hyperglycemia except 1,5-AG, which showed inverse but weaker associations with the risk factors examined. In general, patterns of risk factor associations observed for fasting glucose and HbA1c were similar to those observed for the nontraditional biomarkers of hyperglycemia but with one clear exception: body mass index (BMI). In persons without a diagnosis of diabetes, BMI was positively associated with fasting glucose and HbA1c, but the associations of BMI with glycated albumin and fructosamine were inverse, with high values of these markers at low levels of BMI. 1,5-AG, which is lowered in the setting of hyperglycemia, was positively associated with BMI.
Conclusions Traditional diabetes risk factors have similar associations with glycated albumin and fructosamine as those for fasting glucose and HbA1c, with the exception of BMI. Risk factor associations with 1,5-AG were mostly inverse. The inverse associations of BMI with glycated albumin and fructosamine, and positive associations with 1,5-AG, may reflect pathways independent of glucose metabolism and merit further examination.
- Hyperglycemia
- Biomarkers
- Fructosamine
- Hemoglobin A1c
This is an Open Access article distributed in accordance with the Creative Commons Attribution Non Commercial (CC BY-NC 3.0) license, which permits others to distribute, remix, adapt, build upon this work non-commercially, and license their derivative works on different terms, provided the original work is properly cited and the use is non-commercial. See: http://creativecommons.org/licenses/by-nc/3.0/
Statistics from Altmetric.com
Key messages
-
Glycated albumin, fructosamine, and 1,5-anhydroglucitol (1,5-AG) are of growing interest as alternative markers of hyperglycemia in persons with type 2 diabetes. An important question is whether risk factor associations for these nontraditional markers of hyperglycemia are similar to those for standard markers, namely, fasting glucose and hemoglobin A1c (HbA1c).
-
With the exception of obesity, we found that the associations of traditional risk factors with glycated albumin and fructosamine were largely similar to those for fasting glucose and HbA1c. Risk factor associations for 1,5-AG were inverse (as expected) but tended to be weaker than the other biomarkers. In particular, black race and family history of diabetes were positively associated with elevated fasting glucose, HbA1c, glycated albumin, and fructosamine, and low concentrations of 1,5-AG.
-
The association of obesity with fasting glucose and HbA1c were roughly linear, whereas inverse trends were observed with glycated albumin and fructosamine, and positive trends with 1,5-AG. This result may have implications for the use of these biomarkers for monitoring glycemic control in obese persons.
Fasting glucose and hemoglobin A1c (HbA1c) are the standard measures of hyperglycemia used for the diagnosis and management of diabetes.1 Fasting glucose provides an acute assessment of glycemia, whereas elevations in HbA1c reflect long-term (2–3 months) exposure to high circulating blood glucose. Glycated albumin, fructosamine, and 1,5-anhydroglucitol (1,5-AG) are nontraditional markers of hyperglycemia that are not routinely used in clinical practice. There is ongoing debate about whether these markers may have utility as measures of glycemic control in the management of diabetes.2–6 Fructosamine forms via nonenzymatic glycation of total serum proteins (mostly albumin). Glycated albumin is the nonenzymatic glycation specifically of serum albumin. Fructosamine and glycated albumin are elevated in the presence of increased blood glucose and reflect glycemic exposure in the preceding 2–3 weeks.7 ,8 1,5-AG is a monosaccharide that is not metabolized and is normally stable in serum. In the setting of overt hyperglycemia, high amounts of glucose competitively inhibit renal tubular reabsorption of 1,5-AG; 1,5-AG is excreted in the urine, leading to a decrease in circulating serum levels. As a result, blood concentrations of 1,5-AG are lowered in the setting of elevated glucose concentrations and are thought to reflect hyperglycemia and glycemic excursions over the preceding 1–2 weeks.9–11
There is growing interest in the potential use of glycated albumin, fructosamine, and 1,5-AG in settings where short-term glycemic control is of interest or where measures of fasting glucose and HbA1c may not be optimal12 (eg, among persons with anemia, hemolysis, hemoglobinopathies, dialysis, or altered red blood cell turnover). Because glycated albumin, fructosamine, and 1,5-AG are not confounded by the same conditions, they may have added clinical utility. However, before these nontraditional biomarkers can be adopted in practice, additional information is needed to understand if their associations with known diabetes risk factors are similar to or different from those observed with standard markers, namely, fasting glucose and HbA1c. We undertook this study to compare the association of diabetes risk factors with glycated albumin, fructosamine, and 1,5-AG (nontraditional markers) to those observed with fasting glucose and HbA1c (traditional markers).
Research design and methods
Study population
We analyzed data from a subsample of participants from the Atherosclerosis Risk in Communities (ARIC) Study, an ongoing community-based prospective cohort of black and white adults from Forsyth County, North Carolina; Jackson, Mississippi; the suburbs of Minneapolis, Minnesota; and Washington County, Maryland.13 The ARIC Carotid MRI (CARMRI) substudy was originally designed to identify correlates of carotid plaque, and utilized stratified sampling to increase informative plaque prevalence. The study included 2066 ARIC participants who attended a clinical examination from 2005 to 2006.14 The CARMRI study visit included an interview, physical examination, blood collection, laboratory testing, and CARMRI.15 Institutional review boards at each clinical site reviewed the study, and written informed consent was obtained from all participants. Our final study population included 1764 participants (309 with diagnosed diabetes and 1455 without a diagnosis of diabetes) after excluding persons fasting fewer than 8 h (n=20) or missing information on variables of interest (n=282).
Measurement of glycemic markers
Fasting glucose (mg/dL) and HbA1c (%) were measured in 2005–2006 using a Roche Hitachi 911 analyzer. Glucose was measured in serum using the hexokinase method (Roche Diagnostics). HbA1c was measured in whole blood via a Tina-quant II immunoassay method (Roche Diagnostics, Basel, Switzerland) and calibrated to the Diabetes Control and Complications Trial assay. Glycated albumin and total albumin (% and g/dL, respectively; Lucica GA-L; Asahi Kasei Pharma Corporation, Tokyo, Japan), fructosamine (µmol/L; Roche Diagnostics), and 1,5-AG (µg/mL; GlycoMark, Winston-Salem, North Carolina) were measured in 2009 in serum samples with a Roche Modular P800 system (Roche Diagnostics).16 Glycated albumin was expressed as a percentage of total serum albumin according to the manufacturer's instructions, that is, [(glycated albumin)/(serum albumin)×100/1.14+2.9]%. The interassay coefficients of variation for glycated albumin, fructosamine, and 1,5-AG were 2.7, 3.7, and 4.8%, respectively.
Other variables of interest
Age, sex, race, family history of diabetes, and smoking status were self-reported. We calculated body mass index (BMI, kg/m2) from measured weight and height. Participants were asked to bring current medications to the visit, which were used to determine use of cholesterol-lowering and blood pressure-lowering medications in the past 4 weeks. Total cholesterol concentrations (mg/dL) were assayed from blood samples using standard techniques. Hypercholesterolemia was defined as a total cholesterol concentration ≥240 mg/dL17 or use of cholesterol-lowering medications in the past 4 weeks. Systolic blood pressure and diastolic blood pressure were measured after 5 min of rest using a random-zero sphygmomanometer. Mean systolic blood pressure and diastolic blood pressure were calculated by averaging the second and third blood pressure measurements. We defined hypertension as mean systolic blood pressure ≥140 mm Hg, a mean diastolic blood pressure ≥90 mm Hg,18 and/or use of blood pressure-lowering medications in the past 4 weeks. Diagnosed diabetes was defined based on self-reported physician diagnosis or current use of a diabetes medication.
Statistical analysis
The characteristics for our study population were summarized by elevated fasting glucose, HbA1c, glycated albumin, and fructosamine levels, and low 1,5-AG levels, stratified by diabetes diagnosis. Among persons without a prior diabetes diagnosis, elevated concentrations of fasting glucose and HbA1c were defined at their diagnostic thresholds, 126 mg/dL (the 93rd centile) and 6.5% (the 95th centile), respectively. Because there are no standard clinical cut-points for glycated albumin and fructosamine, we defined elevated values of these markers using the 95th centile (≥16.2% and ≥270.3 µmol/L, respectively). Since 1,5-AG is lowered in the setting of hyperglycemia, we defined low levels of 1,5-AG at the 5th centile (≤6.8 µg/mL). Among persons with a diagnosis of diabetes, we defined elevated HbA1c as a value greater than or equal to 7.0% (the 75th centile). Based on this threshold, elevated levels of fasting glucose (≥160 mg/dL), glycated albumin (≥19.5%), and fructosamine (≥292.1 µmol/L) were defined using the 75th centile. For comparability, low concentrations of 1,5-AG were defined using the 25th centile (≤6.3 µg/mL).
We used multivariable logistic regression models to evaluate the associations of the diabetes risk factors with elevated values of fasting glucose, HbA1c, glycated albumin, and fructosamine. For 1,5-AG, we evaluated risk factor associations with low concentrations of this glycemic marker. We conducted analyses separately among persons with and without a diagnosis of diabetes. A sensitivity analysis was conducted to characterize the associations in the overall population. The multivariable models included age (≥70 years or <70 years), sex (male or female), race (African-American or Caucasian), BMI (>30, 25 to <30, <25 kg/m2),19 family history of diabetes (yes or no), hypercholesterolemia (yes or no), hypertension (yes or no), and smoking status (current or former/never). We used linear regression models to evaluate the associations of diabetes risk factors with log-transformed values of each glycemic marker stratified by diagnosis of diabetes (log transformation was used because all distributions were right skewed). To determine the percent difference in mean biomarker value per unit increase of the predictor variable, regression coefficients were exponentiated, subtracted from 1.0, and then multiplied by 100, that is, [100×(eβ−1)].20
Because we observed pronounced inverse associations of BMI with several of the glycemic markers, we conducted additional analyses to rigorously characterize the shape of the associations of BMI with each of the different markers of hyperglycemia. We used linear regression with restricted cubic splines21 with knots at the median of each quartile to characterize the shape of the associations of BMI with each glycemic marker. In the spline models, glycemic marker values were truncated at the 1st and 99th centiles to minimize the influence of extreme values at either tail of the distribution. All analyses were weighted to account for the complex sample survey design of the CARMRI substudy.14 Analyses were conducted using Stata V.12.0. All p Values were two-sided, and p<0.05 was considered statistically significant.
Results
The characteristics of our study population are summarized by elevated levels of fasting glucose, HbA1c, glycated albumin, and fructosamine, and low levels of 1,5-AG, and stratified by diagnosis of diabetes in table 1. Among participants without a diagnosis of diabetes, mean age was slightly higher in persons with elevated values of each biomarker and lower concentrations of 1,5-AG. Black participants were more likely than white participants to have elevated fasting glucose, HbA1c, glycated albumin, or fructosamine. The prevalence of a family history of diabetes was higher among persons with elevated values of fasting glucose, HbA1c, glycated albumin, and fructosamine, and low 1,5-AG. Obesity prevalence was substantially higher in those persons with elevated fasting glucose, HbA1c, and glycated albumin compared with persons without elevated levels of these biomarkers. Obesity prevalence was only slightly higher at elevated levels of fructosamine compared with nonelevated values (35.5% vs 33.0%). For 1,5-AG, obesity prevalence was slightly lower at low levels (31.2%) compared with higher levels (33.2%). In general, similar risk factor patterns were observed among persons with diagnosed diabetes.
Characteristics of study participants with and without diagnosed diabetes by elevated* levels of fasting glucose, hemoglobin A1c (HbA1c), glycated albumin, fructosamine, and 1,5-anhydroglucitol (1,5-AG) in a subsample of the Atherosclerosis Risk in Communities Study, 2005–2006, n=1764
Multivariable logistic regression models for the association of diabetes risk factors with elevated levels of fasting glucose, HbA1c, glycated albumin, and fructosamine, and low levels of 1,5-AG stratified by diabetes diagnosis are shown in table 2. Among participants without a diagnosis of diabetes, older age was significantly and independently associated with elevated levels of glycated albumin and fructosamine. Older age was also associated with elevations in fasting glucose and HbA1c and low concentrations of 1,5-AG, but these results were not statistically significant. Black race/ethnicity was positively and significantly associated with elevated HbA1c, glycated albumin, and fructosamine but not fasting glucose or 1,5-AG. Obesity (BMI ≥30 kg/m2) was strongly associated with elevated fasting glucose (OR 1.78, 95% CI 1.05 to 3.02) and categories of BMI appeared to be associated with elevated fasting glucose in a graded fashion. This was not the case for the other biomarkers of hyperglycemia, which demonstrated nonlinear associations (HbA1c, glycated albumin, 1,5-AG) or lack of association (fructosamine). Family history of diabetes was strongly and significantly associated with elevated levels of fasting glucose, HbA1c, and glycated albumin. The associations of family history with elevated fructosamine (OR 1.71, 95% CI 0.89 to 3.28) and low 1,5-AG (OR 1.61, 95% CI 0.83 to 3.14) were not significant. As might be expected, results for the overall population (persons with and without diagnosed diabetes combined) generally showed similar but stronger associations. The nonlinear associations with BMI categories also persisted in the overall population (etable 1 and efigure 1).
Multivariable adjusted† associations (ORs and 95% CIs) of diabetes risk factors with elevated levels‡ of fasting glucose, hemoglobin A1c (HbA1c), glycated albumin, fructosamine, and 1,5-anhydroglucitol (1,5-AG) in persons with and without diabetes in a subsample of the Atherosclerosis Risk in Communities Study, 2005–2006, n=1764
When looking separately among persons with a diagnosis of diabetes, older age was not significantly associated with any of the biomarkers (table 2). Black race was strongly and significantly associated with elevated HbA1c, glycated albumin, and fructosamine. Black race was also associated with elevated fasting glucose (OR 1.96, 95% CI 0.89 to 4.33) and low 1,5-AG (OR 1.75, 95% CI 0.86 to 3.54), but these results were not statistically significant. Similar to the results in persons without a diagnosis of diabetes, we observed nonlinear associations of BMI categories with glycated albumin, fructosamine, and 1,5-AG, although for fasting glucose and HbA1c the associations appeared roughly linear. Other risk factor associations were less robust and largely not statistically significant in the subgroup of the population with a diagnosis of diabetes.
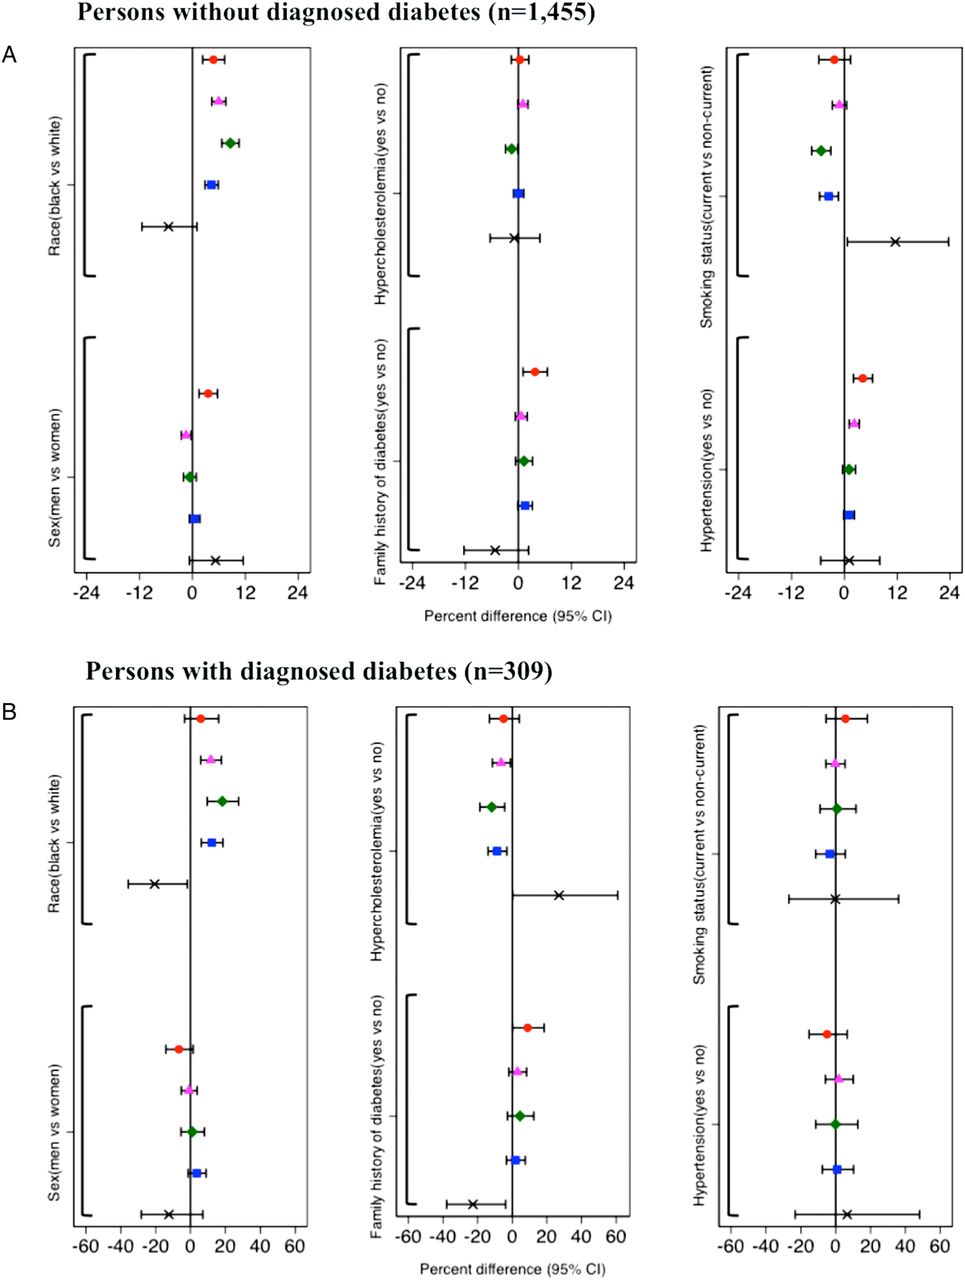
The unadjusted percentage differences in mean levels of hyperglycemia by risk factor categories stratified by diabetes diagnosis are shown in figure 1. Among persons without diagnosed diabetes, we observed significantly higher mean fasting glucose and significantly lower mean HbA1c for men, but no gender differences with the other biomarkers (figure 1A). No gender differences in mean levels of the biomarkers were observed in persons with diagnosed diabetes (figure 1B). Mean fasting glucose, HbA1c, glycated albumin, and fructosamine were higher for black compared with white persons in persons with and without diagnosed diabetes. For 1,5-AG, mean marker levels were lower in black participants without diagnosed diabetes (% difference: −5.44, 95% CI −1147 to 1.00), but this result was not statistically significant. In general, the other risk factor associations for mean differences in the biomarkers were similar to those observed in our multivariable logistic models but less robust.

Continuous associations* of diabetes risk factors with ( ) fasting glucose, (
 ) hemoglobin Alc, (
 ) glycated albumin, (
 ) fructosamine, and (
 ) 1,5-anhydroglucitol in the study population with and without diagnosed diabetes, n=1,764. *Associations are expressed as percent differences in marker levels between risk factor groups and their respective reference groups.
When BMI was modeled continuously using splines, the profoundly divergent associations across biomarkers of hyperglycemia were evident (figure 2 and efigure 1). In persons without diagnosed diabetes, the association of BMI with fasting glucose was roughly linear, whereas the association with HbA1c was J-shaped (figure 2A,B). The association of BMI with glycated albumin was slightly U-shaped (figure 2C) and the association with fructosamine was actually inverse (figure 2D). The association of BMI with 1,5-AG was positive (figure 2E). When persons with diagnosed diabetes were included in the study population, the association of BMI with HbA1c became more linear (efigure 1, panel B) and the associations with glycated albumin and fructosamine became more U-shaped (efigure 1, panels C and D).

Continuous associations* of body mass index with fasting glucose (Panel A), hemoglobin Alc (Panel B), glycated albumin (Panel C), fructosamine (Panel D), and 1,5-anhydroglucitol (Panel E) in the study population without diagnosed diabetes, n=1,455. *Linear regression models with restricted cubic splines are shows in panels A-E. The solid lines are the predicted values from the regression model; the dashed lines represent the corresponding 95% confidence intervals. In the spline midels, knots were placed at the median of each quartile to characterize the continuous associations of body mass index with each glycemic marker. The levels of each glycemic marker were truncaated at the 1st and 99th percentiles to minimize the influence of extreme values at either tail of the distributions.
Conclusions
The goal of this study was the comparison of associations of standard diabetes risk factors with traditional and nontraditional markers of hyperglycemia in an older community-based, predominantly nondiabetic population. Our logistic models examining risk factor associations with elevated fasting glucose, HbA1c, glycated albumin, or fructosamine or low 1,5-AG addressed the question of whether risk factor associations for extreme (hyperglycemic) values differed across these biomarkers in the population. Our models examining percent difference addressed the question of whether there were differences in risk factor associations for average values across these five markers of hyperglycemia in this community-based population. In general, the most consistent risk factor associations we observed were for black race and family history of diabetes. The associations of the biomarkers with hypertension, hypercholesterolemia, and smoking status with all five glycemic markers were generally weaker, but the observed patterns were relatively similar across the biomarkers, with associations for 1,5-AG being generally inverse (as expected). By contrast, the associations of BMI with the different biomarkers were quite diverse.
With the exception of BMI, associations of diabetes risk factors with traditional glycemic markers were similar to those observed with nontraditional markers. The consistently higher levels of markers of hyperglycemia (and lower levels of 1,5-AG) in African-Americans compared with Caucasians have been shown previously in this study sample22 and other study populations.23–25 The strong associations of a family history of diabetes with all five markers of hyperglycemia is reassuring and is consistent with the well-established genetic basis for hyperglycemia and type 2 diabetes26 and previous epidemiological studies showing robust associations between a parental history of diabetes and hyperglycemia.27 ,28 The inverse associations of BMI with nontraditional markers of hyperglycemia were in contrast to the more linear ones observed for fasting glucose and HbA1c.
The association of obesity with hyperglycemia is well established29; obesity is one of the strongest and most important risk factors for type 2 diabetes.30 Previous studies have demonstrated strong, positive associations of BMI with fasting glucose and HbA1c with both prediabetes and diabetes,31 ,32 consistent with our results. The inverse associations of BMI with glycated albumin and fructosamine in persons without diagnosed diabetes and the U-shaped associations in the overall population are in contrast to this literature. Interestingly, the inverse association of BMI with fructosamine has been observed in several previous studies, including in nondiabetic persons.33–36 The mechanism underlying the inverse association of BMI with serum glycated protein biomarkers is unclear. One possibility is altered serum protein turnover in obese and/or older persons.37–39 Because the inverse associations observed with glycated albumin and fructosamine were quite pronounced, this observation may have implications for the use of glycated albumin and fructosamine in monitoring glycemic control. To the best of our knowledge, no previous studies have examined the shape of the association of BMI with 1,5-AG. The observed positive association of BMI with 1,5-AG may reflect overall dietary intake and/or dietary differences between obese and non-obese adults, particularly in nondiabetic persons, as the majority of circulating 1,5-AG in the body originates from food.40–42 1,5-AG is a monosaccharide that resembles glucose in structure and is thought to be present in almost all foods, but in varying amounts. In normoglycemic persons, 1,5-AG concentrations are at a steady state of distribution, balanced by ingestion and excretion.43
Several limitations of this study warrant discussion. First, our study design was cross-sectional, which limits our ability to establish the temporality of the observed associations. Second, our study population was predominantly nondiabetic; we had only a limited number of persons with diagnosed diabetes in the study population (n=309). Third, our population was older (mean: 70, SD: 6) and consisted of only black and white adults, which may affect the generalizability of our results. Fourth, we had few persons with very low BMI (n=11 with BMI <18.5 kg/m2), so we were unable to rigorously examine associations at the low end of the range of BMI. The strengths of our study include the relatively large, biracial, community-based population; the rigorous assessments of diabetes risk factors using standardized protocols; and, finally, the low interassay coefficients of variation for each marker, indicating excellent laboratory performance of these assays.
In conclusion, we found that traditional diabetes risk factors tended to have similar associations with glycated albumin and fructosamine as compared to their associations with fasting glucose and HbA1c, with the exception of obesity. Associations of diabetes risk factors with 1,5-AG were mostly inverse, but less robust. The inverse associations of glycated albumin and fructosamine, and positive associations of 1,5-AG with BMI, may reflect pathways independent of glucose metabolism and merit further examination.
Acknowledgments
The authors thank the staff and participants of the Atherosclerosis Risk in Communities Study for their important contributions.
References
Footnotes
-
Contributors AKP conducted the analysis, wrote the manuscript, and is responsible for the intellectual content. ES and SPJ are responsible for the intellectual content and critical review. CMB and MWS reviewed and edited the manuscript. AKP is the guarantor.
-
Funding The Atherosclerosis Risk in Communities (ARIC) Study is carried out as a collaborative study supported by National Heart, Lung, and Blood Institute (NHLBI) contracts (HHSN268201100005C, HHSN268201100006C, HHSN268201100007C, HHSN268201100008C, HHSN268201100009C, HHSN268201100010C, HHSN268201100011C, and HHSN268201100012C) with the ARIC carotid MRI examination funded by U01 HL075572-01. The Asahi Kasei Corporation provided materials for the glycated albumin assay.
-
Competing interests ES was supported by a grant from the National Institutes of Health/National Institute of Diabetes and Digestive and Kidney Diseases (NIH/NIDDK) (R01 DK089174). SPJ was supported by an institutional training grant from the NIH/NHLBI (T32 HL007024).
-
Provenance and peer review Not commissioned; externally peer reviewed.
-
Data sharing statement The statistical code for this analysis is available from the corresponding author. The dataset is available from the ARIC Study on request.