Article Text

Abstract
Objective The study was aimed at estimating the prevalence of type 2 diabetes mellitus and diabetic retinopathy in a rural population of South India.
Design A population-based cross-sectional study.
Participants 13 079 participants were enumerated.
Methods A multistage cluster sampling method was used. All eligible participants underwent comprehensive eye examination. The fundi of all patients were photographed using 45°, four-field stereoscopic digital photography, and an additional 30° seven-field stereo digital pairs were taken for participants with diabetic retinopathy. The diagnosis of diabetic retinopathy was based on Klein's classification.
Main outcome measures Prevalence of diabetes mellitus and diabetic retinopathy and associated risk factors.
Results The prevalence of diabetes in the rural Indian population was 10.4% (95% CI 10.39% to 10.42%); the prevalence of diabetic retinopathy, among patients with diabetes mellitus, was 10.3% (95% CI 8.53% to 11.97%). Statistically significant variables, on multivariate analysis, associated with increased risk of diabetic retinopathy were: gender (men at greater risk; OR 1.52; 95% CI 1.01 to 2.29), use of insulin (OR 3.59; 95% CI 1.41 to 9.14), longer duration of diabetes (15 years; OR 6.01; 95% CI 2.63 to 13.75), systolic hypertension (OR 2.14; 95% CI 1.20 to 3.82), and participants with poor glycemic control (OR 3.37; 95% CI 2.13 to 5.34).
Conclusions Nearly 1 of 10 individuals in rural South India, above the age of 40 years, showed evidence of type 2 diabetes mellitus. Likewise, among participants with diabetes, the prevalence of diabetic retinopathy was around 10%; the strongest predictor being the duration of diabetes.
- Retinopathy
- Incidence
This is an Open Access article distributed in accordance with the Creative Commons Attribution Non Commercial (CC BY-NC 3.0) license, which permits others to distribute, remix, adapt, build upon this work non-commercially, and license their derivative works on different terms, provided the original work is properly cited and the use is non-commercial. See: http://creativecommons.org/licenses/by-nc/3.0/
Statistics from Altmetric.com
Key messages
-
The prevalence of type 2 DM in the rural Indian population: 10.4%.
-
The prevalence of DR in this cohort: 10.3%.
-
The prevalence of DR in newly diagnosed DM: 2.8%.
-
The most significant variable associated with DR was: Longer duration of DM, 15 years.
The epidemic of diabetes mellitus (DM), in particular type 2 DM, is assuming significant proportions in developing countries, such as India.1 ,2 The International Diabetes Federation (IDF) has projected that the number of people with diabetes in India would rise from 65.1 million in 2013 to 109 million in 2035.3 DM, being a lifestyle disease, is on the rise in urban areas; we reported that the prevalence of DM in the population older than 40 years, in urban India, was around 28% (Sankara Nethralaya Diabetic Retinopathy Epidemiology and Molecular Genetic Study (SN-DREAMS) I, report 2).4 ,5 However, in a study carried out in South India where the population was hybrid, both rural and urban, the prevalence of DM was around 11%.6 The Indian Council of Medical Research-India Diabetes (ICMR-INDIAB) Study, which was carried out in three states (Tamil Nadu, Maharashtra, and Jharkhand) and one union territory (Chandigarh), reported a varied prevalence of diabetes: 10.4% in Tamil Nadu, 8.4% in Maharashtra, 5.3% in Jharkhand, and 13.6% in Chandigarh.1 An epidemiological study estimating the prevalence of DM and diabetic retinopathy (DR) in rural India is not available; second, the changing lifestyle and urbanization of rural culture are gradually influencing the rural population as well.6 ,7 Therefore, the present study, SN-DREAMS III, a population-based cross-sectional study, using multistage random sampling was designed to estimate the prevalence of DM and DR in rural India and elucidate risk factors influencing DR.
Patients and methods
The study design and research methodology of SN-DREAMS III are described in detail elsewhere.8 The study was approved by the Institution Review Board, and a written informed consent was obtained from the participants according to the Declaration of Helsinki. The details of the study were explained to the patient in the local vernacular language; the translated local language consent form was either signed (literate) or a thumb impression obtained (illiterate).
Study areas and sample size calculations
The study was conducted in the rural areas of the district Kanchipuram and district Thiruvallur, Tamil Nadu, India (figure 1). A multistage cluster sampling method was used. We randomly selected 26 villages, divided into 26 clusters, 13 clusters from each district, and a cluster was defined as having a population of 1200–2000. The estimated sample size was 11 760, assuming a 2% prevalence of DR based on estimation from previous studies,9 ,10 keeping a design effect of 2 with a precision of 80% and compliance of 80%.
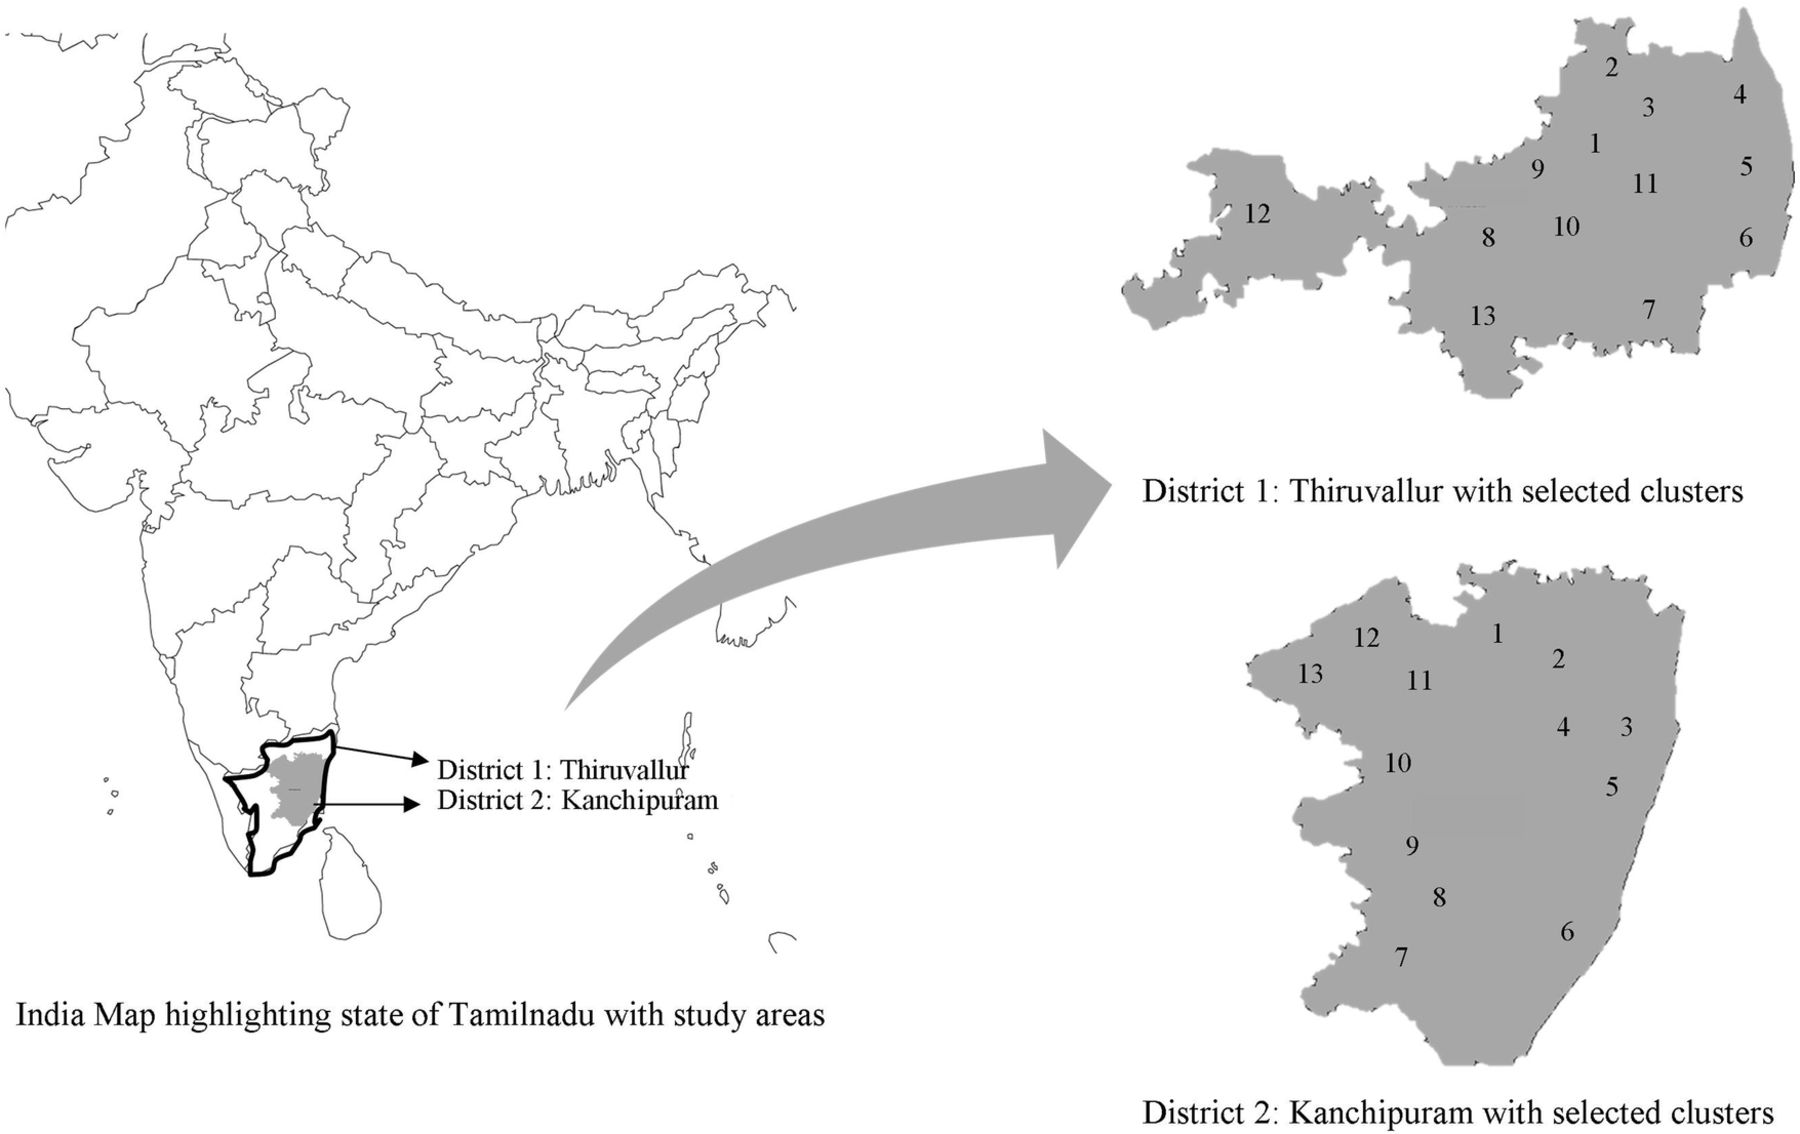
Study areas.
Diagnosis of diabetes mellitus
The following definitions were used:
-
Known diabetes: If they were using antidiabetic agents, either oral or insulin or both, along with dietary recommendations.
-
Newly diagnosed DM: As a first step, all patients underwent estimation of fasting blood glucose by the capillary method (Accutrend α) in the field, and those noted to have a reading of >100 mg/dL were invited for oral glucose tolerance test (OGTT—by enzymatic assay) in the mobile van; an OGTT value of ≥200 mg/dL was considered as newly diagnosed diabetes.11
-
Sight-threatening DR (STDR): STDR was defined as the presence of severe non-proliferative DR (NPDR), PDR, and clinically significant macular edema (CSME).12
Evaluation of patients in a mobile van
All eligible patients were interviewed by trained bilingual interviewers. All instruments were developed initially in English and later translated into Tamil (the regional spoken language), ensuring that the contents and the meanings were preserved. A comprehensive eye examination was performed in a mobile van which was equipped with an Early Treatment of Diabetic Retinopathy Study (ETDRS) chart and a fundus camera (Carl Zeiss) and other equipment (figure 2); this was performed to ensure that a participant need not travel to the city, as that would increase the compliance rate. The fundi of all patients were photographed using 45°, four-field stereoscopic digital photography; however, an additional 30°, seven-field stereo digital pairs were taken for those who showed any evidence of DR. The diagnosis of DR was based on Klein's classification (modified ETDRS Scales).13 The clinical grading of digital photographs was performed by two independent observers (experienced retinal specialists) in a masked fashion (k=0.82).
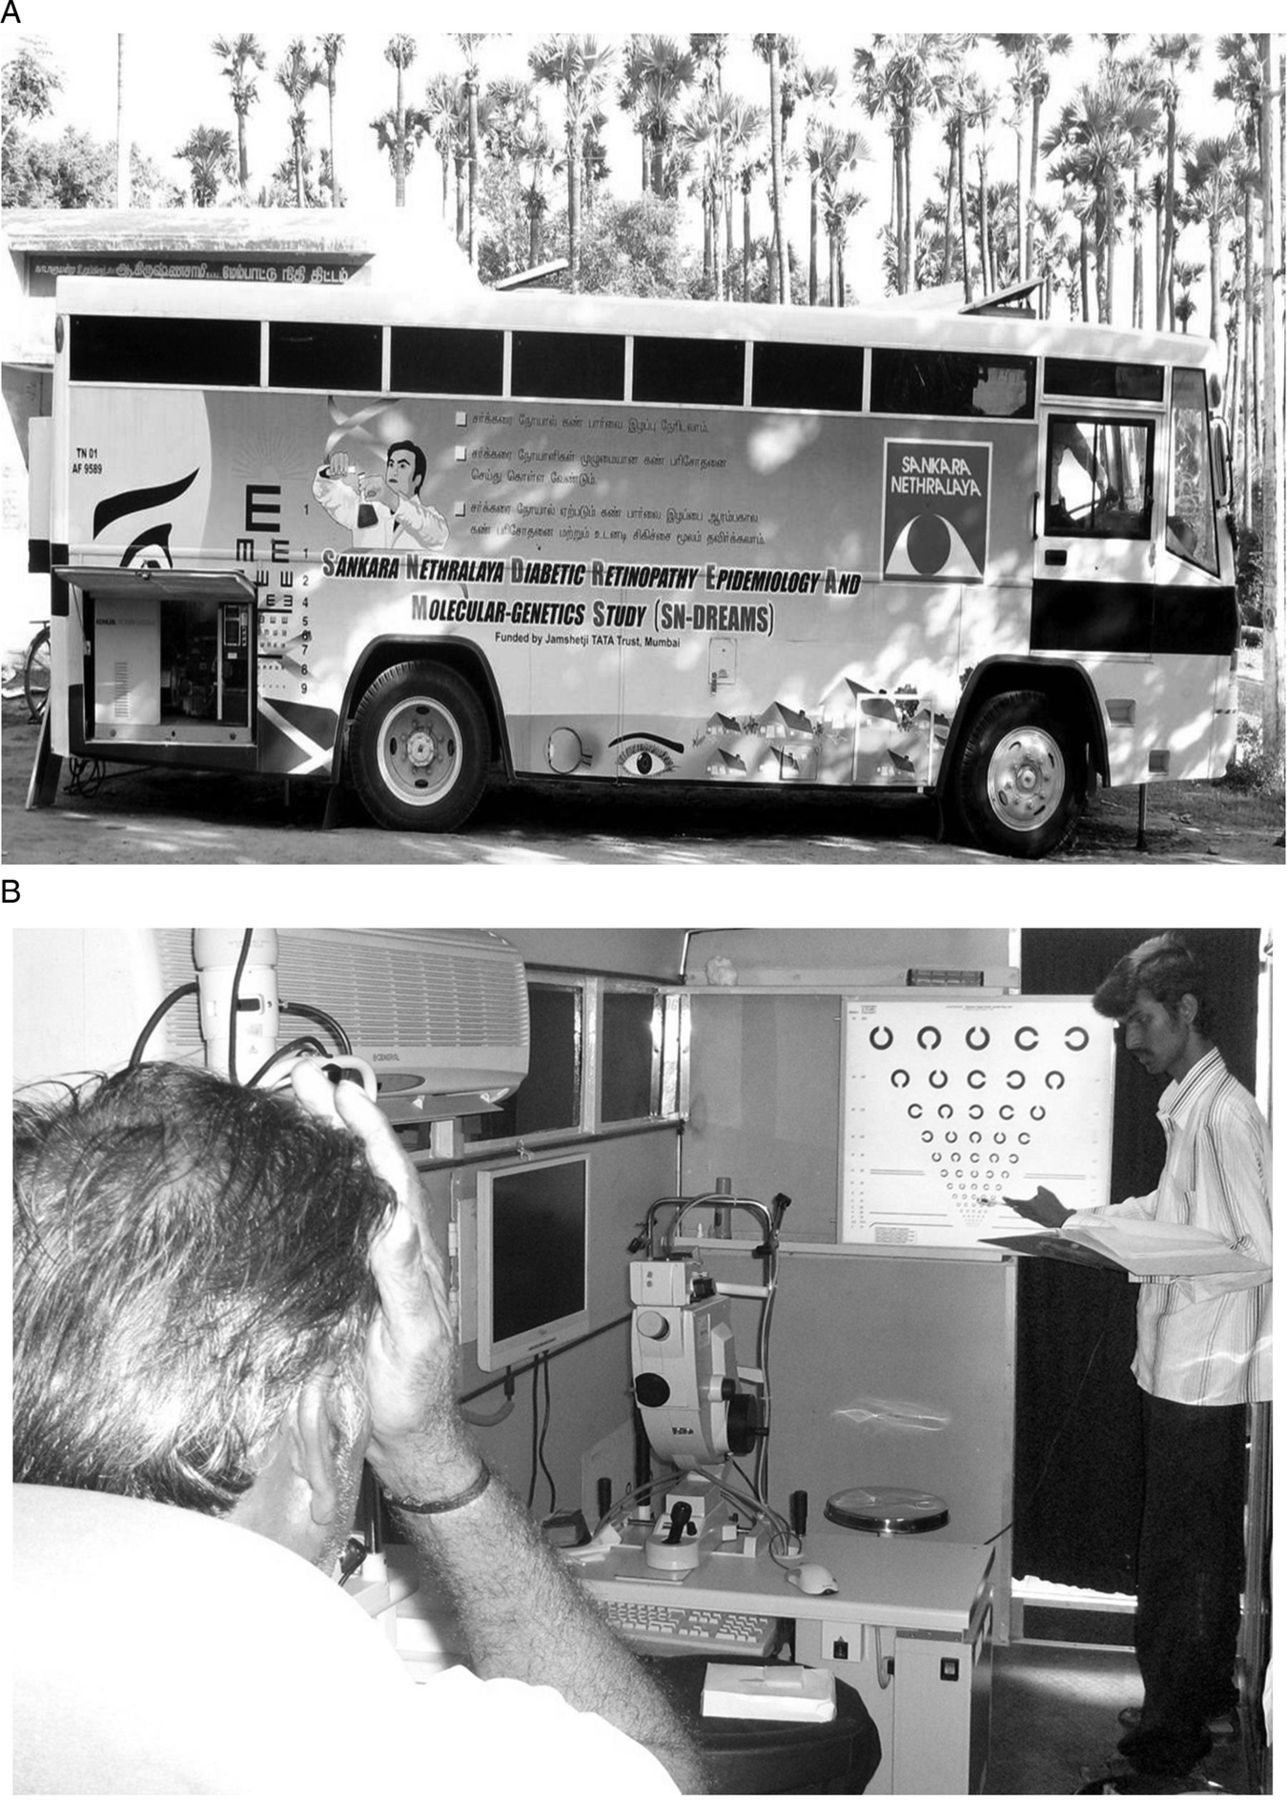
(A) A customized mobile van for comprehensive eye examination in rural areas. (B) Inside the mobile van: recording visual acuity using the EDTRS chart.
Step-by-step enumeration and enrollment
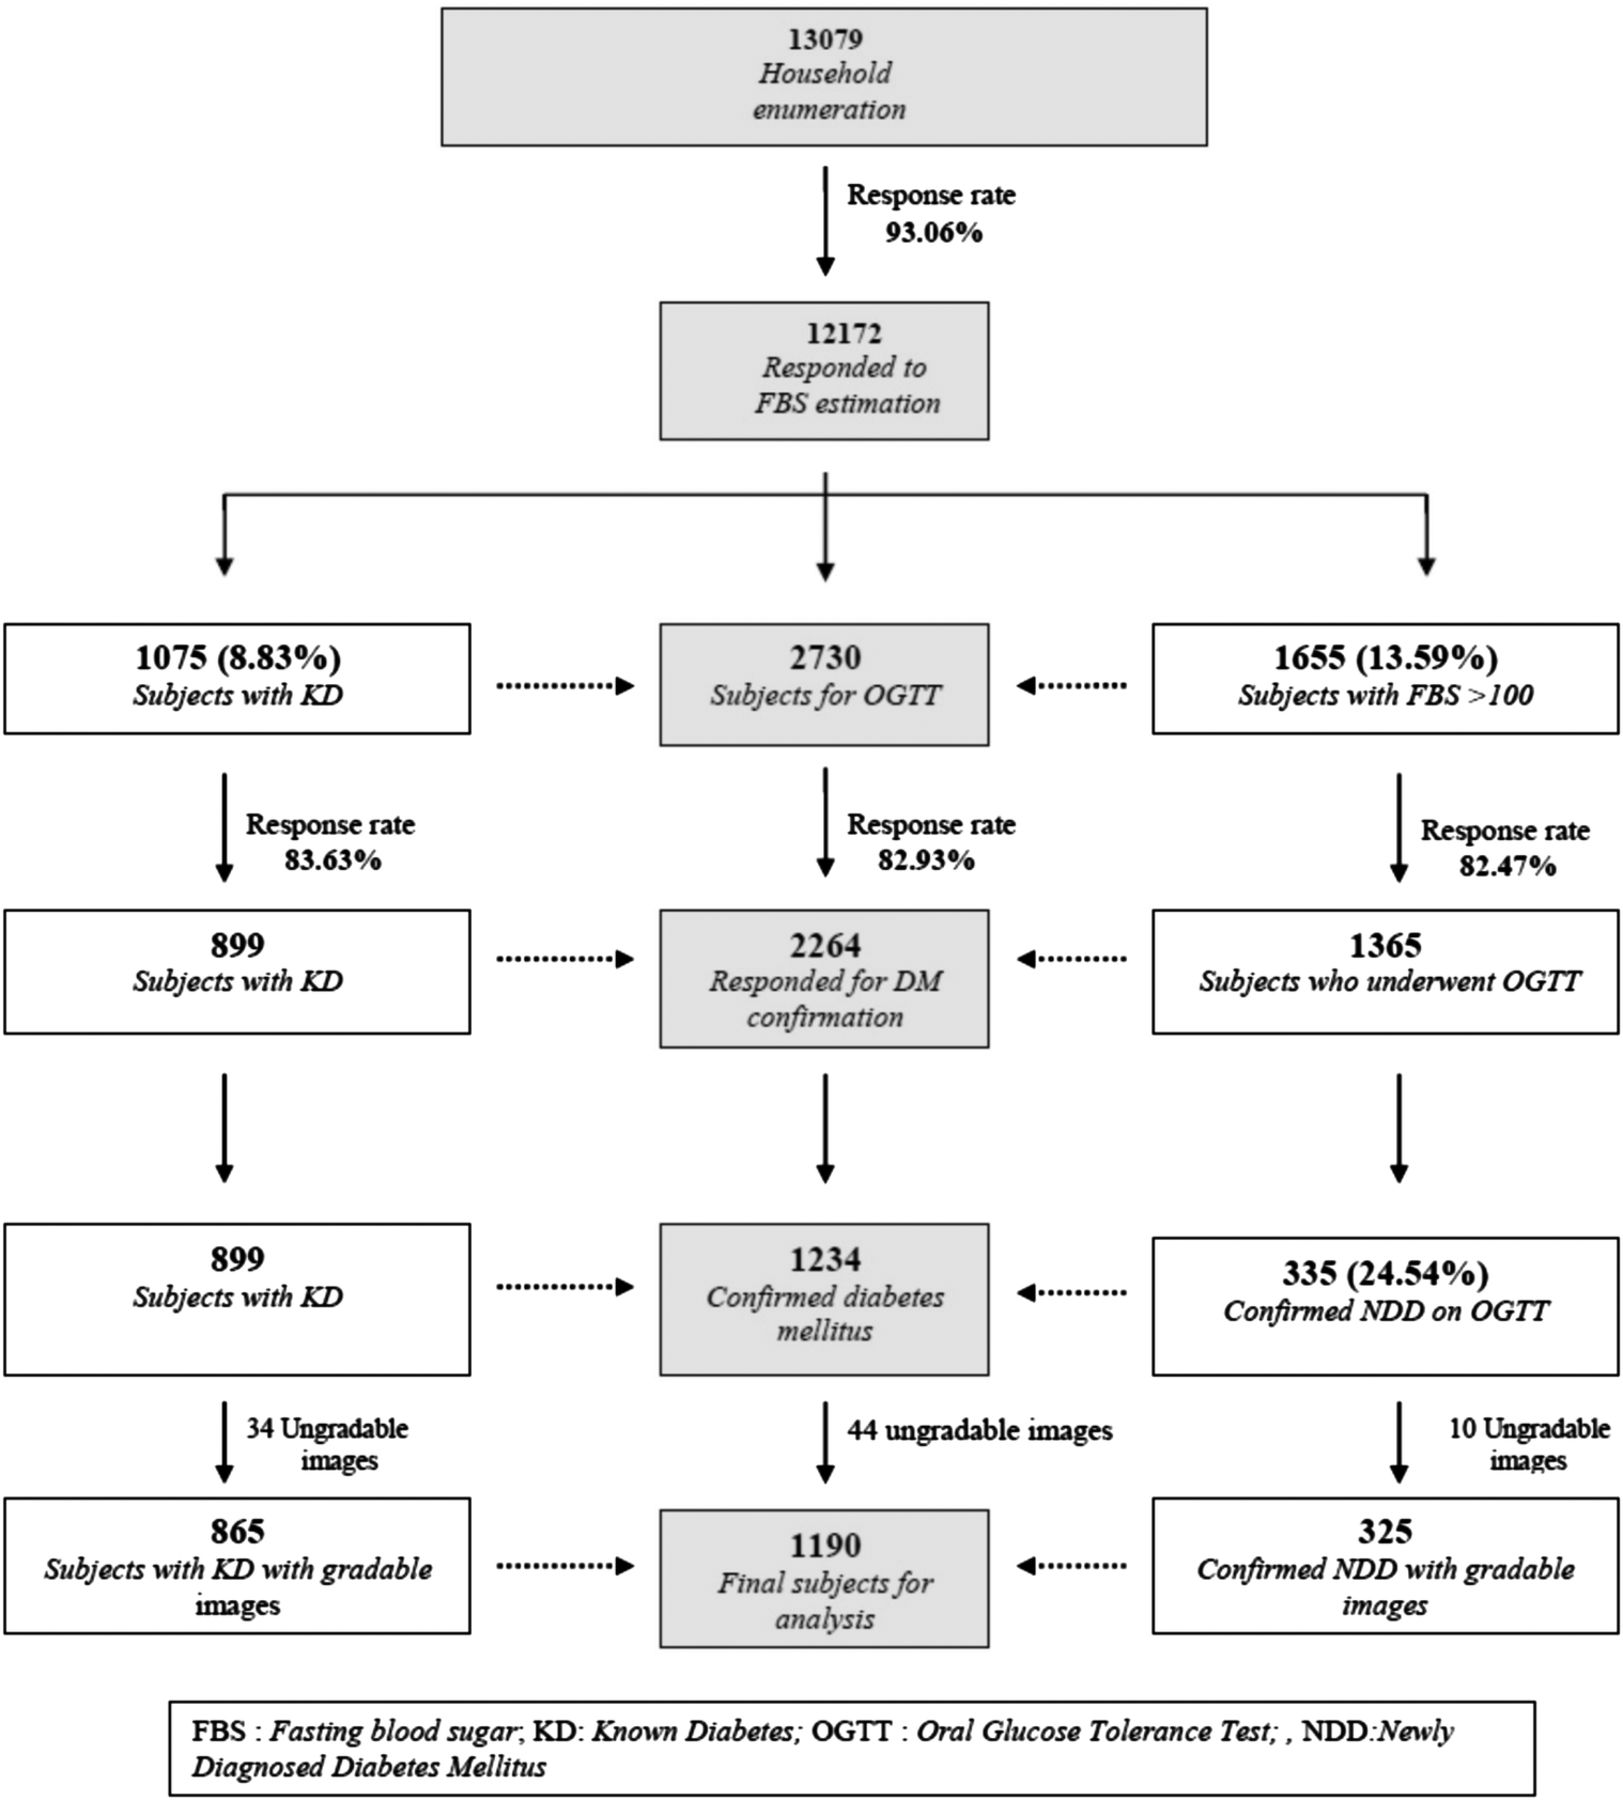
Figure 3 shows the step-by-step enrollment of the study population. A house-to-house enumeration was completed for 13 079 participants, aged 40 years or above. Participants with diabetes secondary to other conditions (secondary diabetes) were excluded based on the medical history of comorbid conditions. Likewise, those on medications which could possibly alter the blood glucose or cause changes in the retina mimicking DR were also excluded. Of the 13 079 enumerated participants, 12 172 (93.1%) responded to the estimation of first fasting glucose. Of these 12 172 participants, 2730 (22.4%) were considered to have DM, 1075 participants with known diabetes and 1655 participants with fasting blood sugar ≥100 mg/dL. Of the 1655 participants, 1365 (82.5%) reported for OGTT; 335 (24.5%) were then confirmed to have newly diagnosed DM. So, 1234 participants with DM (899, known; 335, newly diagnosed) had their fundus photographed; 44 participants (34, known; 10, newly diagnosed) were excluded as the fundus pictures were adjudged to be ungradable. Thus, all together, 1190 participants (865, known; 325, newly diagnosed) were analyzed in the study.

Flow chart showing a step-by-step enrollment of the study population.
Statistical analysis
Statistical analyses were performed using statistical software (SPSS for Windows V.14.0; SPSS Science, Chicago, Illinois, USA). The results were expressed as mean±SD if the variables were continuous and as percentage if the variables were categorical. The Student t test for comparing continuous variables and the χ2 test to compare proportions among groups were used. Newly diagnosed participants with diabetes were given a value of 0 for duration of diabetes. Univariate and multivariate logistic regression analyses were performed to study the effect of various risk factors using DR as a dependent variable.
Results
Of the 2730 participants with DM, 1075 were known diabetes, and 1655 were provisional diabetes (figure 3); these subjects were invited for eye evaluation and OGTT, respectively. Of the 1075 participants with known diabetes, 899 responded to the eye evaluation, and of the 1655 participants with provisional diabetes, 1365 responded to OGTT. Thus, the data included 2264 responders and 466 non-responders; table 1 compares the data between responders and non-responders with regard to mean age, gender, and diabetes status. No statistically significant differences were observed.
Comparison of responders and non-responders in the study population
The age-adjusted and gender-adjusted prevalence of DM in rural India was 10.4% (95% CI 10.39% to 10.42%; table 2). The prevalence was higher in those between the age group of 50–59 years and no gender difference was observed. The prevalence of any DR was 10.3% (95% CI 8.53% to 11.97%; table 3). The prevalence of any DR was higher among participants with known diabetes (13.1% vs 2.8%; p<0.0001), participants with age between 50 and 69 years (25.4% vs 6.2%; p=0.007), male gender (12.8% vs 8.1%; p=0.008), duration of DM of more than 15 years (37.1% vs 6.3%; p<0001), higher glycosylated hemoglobin (HbA1c; 15.4 vs 5.1%; p<0.0001), use of insulin (44% vs 9.5%; p<0.0001), systolic blood pressure of >140 mm Hg (19.8% vs 8.6%; p<0.0001), and diastolic blood pressure of >90 mm Hg (15.5% vs 8.8%; p=0.002). The prevalence of STDR was 3.8% (95% CI 2.70% to 4.86%; table 3). The prevalence of STDR was higher among participants with known diabetes (5.0% vs 0.6%; p<0.0001), participants with age between 50 and 69 years (p=0.001), duration of DM of more than 15 years (p<0001), higher HbA1c (6.0% vs 1.5%; p<0.0001), and use of insulin (28% vs 3.8%; p<0.0001).
Age-wise and gender-wise distribution of prevalence of diabetes mellitus
Prevalence of DR in various subgroups
Table 4 shows the univariate and multivariate regression analyses of factors related to any DR. In the univariate analysis, increased association was observed in those participants between the age group of 50 and 59 years (OR 2.24) and between 60 and 69 years (OR 2.19), male gender (OR 1.66), duration of DM >15 years (OR 8.74), HbA1c of >7.0 (OR 3.41), use of insulin (OR 7.46), systolic blood pressure (OR 2.62), and diastolic blood pressure (OR 1.90). A multivariate model identified five variables: male gender (OR 1.52), duration of DM of >15 years (OR 6.01), HbA1c >7.0 (OR 3.37), use of insulin (OR 3.59), and systolic blood pressure of >140 mm Hg (OR 2.14).
Analysis of risk factors for diabetic retinopathy
Table 5 shows the relationship between types of DR (non-proliferative, proliferative and maculopathy) and known versus newly diagnosed DM; non-proliferative DR and diabetic maculopathy were present in higher proportion in those with known DM. Of the 122 participants with DR, 3 (0.02%) participants with known diabetes were previously diagnosed to have DR; all had STDR and had received laser photocoagulation.
Severity of DR in known versus newly diagnosed DM
Table 6 shows the relationship between types of DR (non-proliferative, proliferative, and maculopathy) and the duration of DM; all types of DR were present in higher proportions in those having duration of diabetes of more than 15 years.
Severity of diabetic retinopathy in relation to duration of diabetes mellitus
Discussion
In this study, the prevalence of diabetes and DR in a rural South Indian population aged 40 years or more was 10.1% and 10.3%, respectively. The prevalence of STDR was 3.8% (known diabetes: 5% and newly diagnosed: 0.6%). Table 7 shows the prevalence of diabetes and DR among the rural population in India and the Asia-Pacific region.14–23 The previous population-based studies from India, which estimated the prevalence of DR and DM, had a diagnosis of diabetes by fasting blood sugar.17 ,18 ,20 The present study used the gold standard, OGTT, for diagnosis of diabetes, and standard fundus photography for diagnosis of DR. The prevalence of diabetes in other Asia-Pacific region countries like China and Australia was similar to that in the Indian rural population; however, the prevalence of DR was much higher in these countries (21.4% in Australia and 43.1% in the Chinese rural population).22 ,23 The relative roles of genetic and lifestyle factors in these ethnic differences remain unexplored.
Prevalence of diabetes mellitus (DM) and diabetic retinopathy (DR) among the rural population in India and the Asia-Pacific region
We have earlier reported a nearly threefold prevalence of diabetes and twofold prevalence of DR in the urban population in South India.5 Diamond24 had also described a similar trend of the prevalence of diabetes being higher among the affluent, educated, urban Indians than among the poor, uneducated, rural people.
The sedentary lifestyle and unhealthy food preferences could be the possible reasons for this urban–rural divide.25–28
On multivariate analysis, the risk factors for DR were male gender, longer duration of diabetes, poor glycemic control, participants with diabetes on insulin, and higher systolic blood pressure. These risk factors are similar to those reported in the urban population and also in other ethnic populations.5 ,22 ,23
The prevalence of any DR was more in participants with known DM than in those who were newly diagnosed (13.1% vs 2.8%, table 5). When data of the rural population were compared with those of the urban population, which were reported earlier, a higher prevalence of any DR in the newly diagnosed was found in urban compared with rural populations (6% vs 2.8%). However, the prevalence of STDR (NPDR, PDR, CSME) was quite low in those with newly diagnosed diabetes (2/325, 0.6%, table 5); a low prevalence of 0.4% was also noted in the urban Indian population.5 Others have also noted a somewhat low prevalence, ranging from around 2% to 3% in this subset.20 ,29–33
The strength of this study is that it uses OGTT for diagnosis of diabetes and photography and standard grading techniques for detecting DR. This study used a unique customized mobile van with all equipments required for standard collection of clinical data, which also had easy access to rural areas. Furthermore, the study is representative of a large population, and results could be extrapolated to the rural population of Tamil Nadu. In view of the lack of previous reports on the rural prevalence of DR and STDR, this study is of importance. The study limitations included the potential of bias in ascertaining history-related variables and no cause–effect relationship, being a cross-sectional study; longitudinal studies would be needed to establish such a relationship.
On extrapolating the data on the South Indian population of Tamil Nadu based on the population projections of the Census of the Government of India,34 the estimated population of diabetes in rural Tamil Nadu over the age of 40 years would be nearly 9.5 lakhs and those with DR would be nearly 1 lakh. It is also important to know that of the 865 participants with known diabetes, only 3 of them were known to have DR, and the rest were newly detected on eye examination. This information has a great impact on the public health awareness programme—highlighting the need for regular eye examination—in educating masses with DM. It is heartening that we could identify several of the patients with STDR in participants with known or newly detected DM. These data stress the need for regular diabetic screening programmes not only in urban areas but also in rural areas in India.
References
Footnotes
PRÉCIS The prevalence of DM and DR in a rural south Indian population was 10.1% and 10.3%, respectively. The risk factors for DR were male gender, longer duration of diabetes, higher HbA1c, insulin use, and higher systolic BP.
-
Contributors SG, SSP, and RR researched the data. SG, VK, and RR wrote the manuscript and researched the data. TS reviewed/edited the manuscript. RR and TS contributed to the discussion.
-
Funding This work was supported by the Jamshetji Tata trust, Mumbai, India.
-
Competing interests None.
-
Patient consent Obtained.
-
Ethics approval Vision Research foundation, Chennai.
-
Provenance and peer review Not commissioned; externally peer reviewed.
-
Data sharing statement No additional data are available.