Article Text

Abstract
Objective Considering the increasing number of clinical observations indicating hyperglycemic effects of statins, this study was designed to measure the influence of statins on the uptake of glucose analogs by human cells derived from liver, adipose tissue, and skeletal muscle.
Design Flow cytometry and scintillation counting were used to measure the uptake of fluorescently labeled or tritiated glucose analogs by differentiated visceral preadipocytes, skeletal muscle cells, skeletal muscle myoblasts, and contact-inhibited human hepatocellular carcinoma cells. A bioinformatics approach was used to predict the structure of human glucose transporter 1 (GLUT1) and to identify the presence of putative cholesterol-binding (cholesterol recognition/interaction amino acid consensus (CRAC)) motifs within this transporter. Mutagenesis of CRAC motifs in SLC2A1 gene and limited proteolysis of membrane GLUT1 were used to determine the molecular effects of statins.
Results Statins significantly inhibit the uptake of glucose analogs in all cell types. Similar effects are induced by methyl-β-cyclodextrin, which removes membrane cholesterol. Statin effects can be rescued by addition of mevalonic acid, or supplementation with exogenous cholesterol. Limited proteolysis of GLUT1 and mutagenesis of CRAC motifs revealed that statins induce conformational changes in GLUTs.
Conclusions Statins impair glucose uptake by cells involved in regulation of glucose homeostasis by inducing cholesterol-dependent conformational changes in GLUTs. This molecular mechanism might explain hyperglycemic effects of statins observed in clinical trials.
- Glucose Uptake
- GLUT1
- Pharmacological Therapy
This is an Open Access article distributed in accordance with the Creative Commons Attribution Non Commercial (CC BY-NC 3.0) license, which permits others to distribute, remix, adapt, build upon this work non-commercially, and license their derivative works on different terms, provided the original work is properly cited and the use is non-commercial. See: http://creativecommons.org/licenses/by-nc/3.0/
Statistics from Altmetric.com
Key messages
-
The use of statins can be associated with an increased risk of clinical complications including diabetes.
-
Statin-mediated inhibition of glucose uptake is accompanied by changes in proteolytic susceptibility of glucose transporter 1 (GLUT1).
-
Statins inhibit glucose uptake by inducing cholesterol-dependent conformational changes in GLUTs.
-
This molecular mechanism might explain hyperglycemic effects of statins observed in clinical trials.
Introduction
Cardiovascular diseases are the leading causes of death in developed countries. Their successful primary and secondary prevention is based on the administration of lipid-lowering drugs, including inhibitors of 3-hydroxy-3-methylglutaryl coenzyme A reductase (HMG-CoAR), collectively referred to as statins.1 Owing to their good tolerance and minimal adverse effects, statins have become the most widely prescribed drugs. However, in recent years, a number of intriguing and still unresolved questions have arisen whether the use of statins can be associated with increased risk of clinical complications, including an increased risk of diabetes mellitus. In February 2012, the Food and Drug Administration (FDA) issued a safety communication that statins can increase glycated hemoglobin (HbA1c) and fasting plasma glucose concentrations.2 The first link between accelerated diabetes in statin users was provided by a JUPITER study.3 A large observational study of 345 417 subjects revealed that statin use is associated with higher fasting glucose levels.4 Also, the Women's Health Initiative found that statin users have a 1.7-fold higher risk of type 2 diabetes mellitus.5 These observations are at odds with a previous primary prevention statin trial (WOSCOPS), where 30% lower incidence of diabetes was found in patients taking pravastatin,6 as well as with the results of the ATOROS study in which no changes in the glycemic control were observed on atorvastatin or rosuvastatin treatment.7 A meta-analysis that reviewed data from 13 large placebo-controlled statin trials identified that statin therapy is associated with 9% increased risk for incident diabetes.8 Importantly, no randomized controlled trials reported so far used diabetes mellitus as a primary endpoint of analysis in patients treated with statins. However, a randomized phase IIIb, multicenter study in patients with type 2 diabetes revealed that glycemic control deteriorates during statin treatment.9 Statins have also increased HbA1c levels and impaired insulin secretion in well-controlled patients with type 2 diabetes,10 and decreased insulin sensitivity in patients undergoing cardiac surgery.11 Moreover, among people with impaired glucose tolerance and other cardiovascular problems statins were associated with an increased risk of new onset diabetes.12 In women with polycystic ovary syndrome (PCOS) statins have been used to improve disease-related hyperandrogenism. Although statin treatment was invariably associated with improved lipid profile, it either impaired insulin sensitivity or increased insulin levels in patients with PCOS13 ,14 or, on the contrary, reduced insulin resistance.15 Altogether, the review of the published data in a large number of patients suggests that there may be a modest association between statin use and incidence of diabetes or impaired glycemic control in patients with diabetes. Therefore, elucidation of molecular mechanisms that could lead to dysregulated glucose homeostasis in statin users becomes increasingly more important.
Plasma glucose concentration remains within a relatively narrow range that resists daily challenges such as meal ingestion, fasting, or intense exercise. Homeostatic regulation of plasma glucose is controlled by insulin-induced changes in liver, adipose tissue, and skeletal muscle glucose fluxes. Since we have previously shown that statins impair glucose uptake by tumor cells,16 we decided to investigate whether statins can also affect glucose transport in normal cells, especially those involved in glucose homeostasis.
Methods
Cells and culture procedures
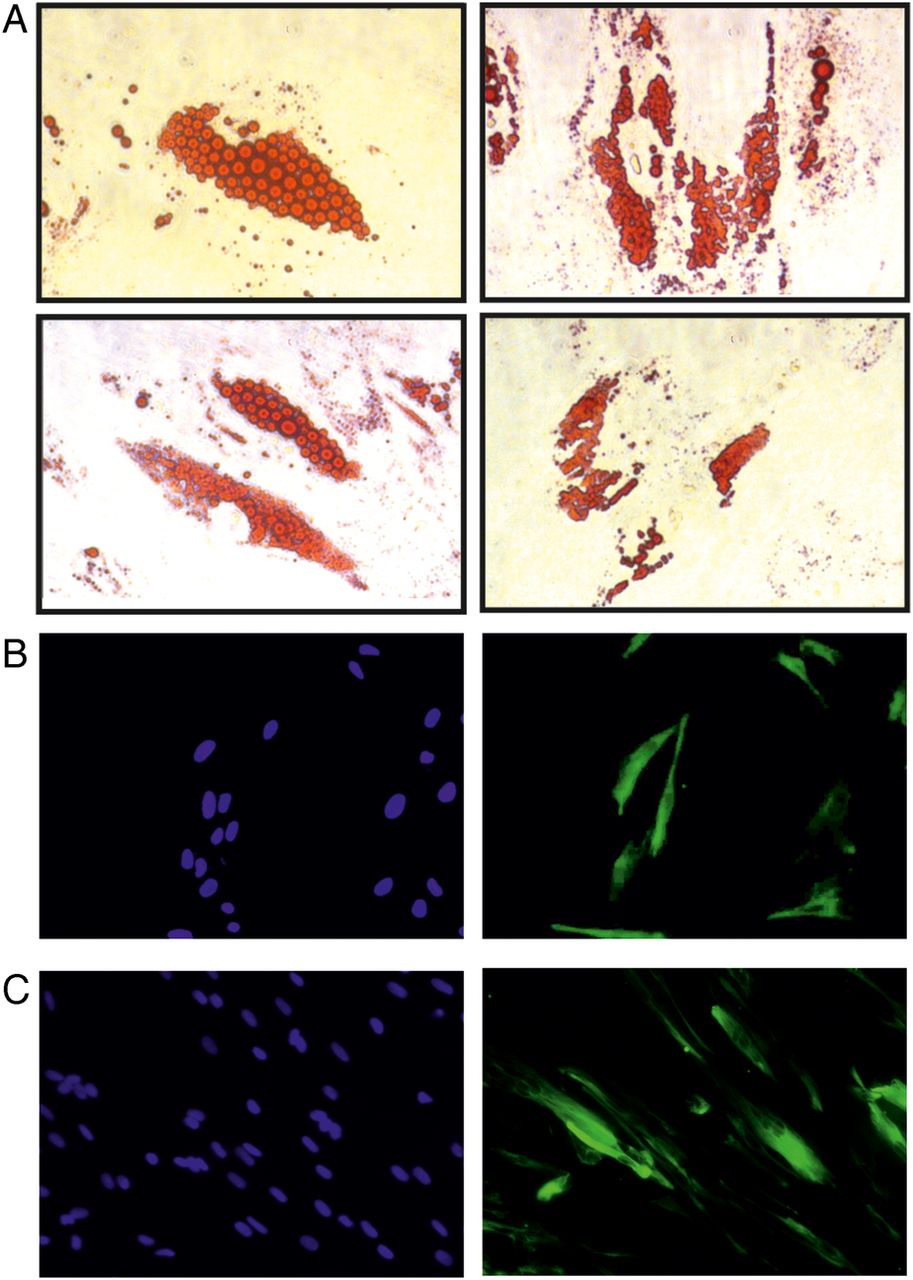
Poietics Human Visceral Preadipocytes, Clonetics Human Primary Hepatocytes (NHEPS), human skeletal muscle cells (SkMc), and human skeletal muscle myoblasts (HSMM) were purchased from Lonza (Basel, Switzerland) and cultured according to the manufacturer’s protocol. Briefly, human visceral preadipocytes were cultured in Preadipocyte Basal Medium-2 supplemented with 10% fetal bovine serum (FBS), 2 mM L-glutamine, and 37 ng/mL GA-1000 (all from Lonza). Before each experiment, the cells were differentiated into mature adipocytes by 7–10-day culture in adipocyte differentiation medium (figure 1A) composed of Preadipocyte Growth Medium-2 supplemented with insulin, dexamethasone, indomethacin, and isobutyl-methylxanthine (all from Lonza). SkMc (figure 1B) and HSMM (figure 1C) cells were cultured in Skeletal Muscle Basal Medium (SkBM) supplemented with human epidermal growth factor, fetuin, bovine serum albumin, dexamethasone, insulin, and gentamicin/amphotericin B solution (all from Lonza). Before each experiment the muscle cells were differentiated by replacing the SkBM with Dulbecco's modified Eagle's medium-F12 (DMEM-F12) supplemented with 2% horse serum (all from Invitrogen, Carlsbad, California, USA) for a 5–7-day culture. Human hepatocellular carcinoma cells (HepG2/C3A, American Tissue Culture Collection (ATCC) No CRL-10741, a clonal derivative of HepG2 cells) were purchased from the ATCC (ATCC, Manassas, Virginia). These cells were previously described as undergoing strong contact inhibition of growth associated with marked reduction in α-fetoprotein (AFP) secretion.17 HepG2/C3A cells were cultured in DMEM medium supplemented with 10% heat-inactivated FBS, 100 µg/mL streptomycin, and 250 ng/mL amphotericin B (all from Invitrogen) to achieve full confluence. All cells were cultured at 37°C in a fully humidified atmosphere of 5% CO2 and were passaged according to the manufacturer's recommendations. Human embryonic kidney (HEK293T) cell lines were purchased from ATCC and were cultured in RPMI 1640 medium supplemented with 10% heat-inactivated FBS, 100 µg/mL streptomycin, and 250 ng/mL amphotericin B (all from Invitrogen, Carlsbad, California, USA). Cells were cultured at 37°C in a fully humidified atmosphere of 5% CO2 and were passaged approximately every other day.

Morphology of cells used throughout the experiments. (A) Human visceral preadipocytes were differentiated for 10 days according to the manufacturer's protocol. Next, the cells were stained with Oil Red O and visualized under phase contrast microscope. Magnification ×250. (B) Human skeletal muscle cells (Lonza) were differentiated for 5 days in Dulbecco's modified Eagle's medium (DMEM) medium + 2% horse serum. The cells were fixed in ice-cold methanol and stained with DAPI and anti-desmin-Alexa Fluor488 antibody. Fluorescence microscopy, magnification ×200. DAPI (left panel) and antidesmin stain (right panel). (C) Human skeletal muscle myoblasts (Lonza) were differentiated for 5 days in DMEM medium + 2% horse serum. The cells were fixed in ice-cold methanol and stained with DAPI and anti-desmin-Alexa Fluor488 antibody. Fluorescence microscopy, magnification ×200. DAPI (left panel) and antidesmin stain (right panel).
Oil Red O staining of adipocytes
The presence of intracellular lipid droplets in mature adipocytes was evaluated with standard Oil Red O staining. Briefly, the cells growing on 6-well plates were washed with phosphate-buffered saline (PBS) and fixed for 1 h in 10% formalin in PBS at room temperature. Next, the cells were washed thrice in distilled water followed by 5 min incubation in 60% isopropanol. After discarding isopropanol, the cells were air-dried and incubated for 10 min at room temperature with 2 mg/mL isopropanol to water solution (3:2 v/v) of Oil Red O (Sigma-Aldrich, St Louis, Missouri, USA). Stained cells were washed thrice with distilled water and immediately evaluated under inverted contrast phase microscope (Nikon). Undifferentiated preadipocytes were used as a negative staining control.
Immunofluorescent evaluation of desmin expression in differentiated myocytes
HSMM and SkMc myocytes were cultured for 5–7 days in differentiation medium on 4-well Lab-Tek II chamber slides (Electron Microscopy Sciences, Hatfield, Pennsylvania, USA). Next, the cells were fixed with ice-cold 100% methanol for 30 min at –20°C and stained for 1 h with antidesmin mouse monoclonal antibody (clone D33, Dako, Denmark, 1:25 dilution in 5% normal donkey serum in PBS) followed by a 1 h incubation with Alexa Fluor488 donkey antimouse IgG (Invitrogen, 1:50 dilution in 5% normal donkey serum in PBS). Next, the cell slides were covered with Vectashield mounting medium with 4',6' diamino-2-phenylindole·2HCl (DAPI) (Vector Laboratories, Burlingame, California, USA) and evaluated under Nikon Eclipse TE2000 fluorescent microscope.
Evaluation of AFP secretion
AFP concentration in supernatants of HepG2/C3A cell culture was estimated in an electrochemiluminescence immunoassay (Roche Diagnostics, Mannheim, Germany) using Cobas e411 immunoassay analyzer (Roche Diagnostics). The obtained values were normalized for total cellular protein concentration measured with Bio-Rad protein assay (Bio-Rad, Hercules, California, USA).
Reagents
Atorvastatin (Pfizer Pharmaceuticals, Inc, Groton, Connecticut, USA), cerivastatin (Bayer Corp, West Haven, Connecticut, USA), fluvastatin (Novartis Pharma AG, Basel, Switzerland), lovastatin, and simvastatin (Merck, Sharp & Dohme Res Lab, Rahway, New Jersey, USA) were used throughout the experiments. Lovastatin and simvastatin were obtained in the inactive lactone form and were activated by dissolving in 100% ethanol, heating for 2 h at 50°C in 0.1N NaOH and neutralizing to physiological pH with 1N HCl. Distilled water was added to obtain the final stock concentration of 10 mM. Stock solution was aliquoted and stored frozen at −20°C. Puromycin, mevalonic acid (MA), methyl-β-cyclodextrin (MβCD), and water-soluble cholesterol were purchased from Sigma.
Flow cytometry evaluation of glucose uptake
Uptake of 6-(N-(7-nitrobenz-2-oxa-1,3-diazol-4-yl)amino)-6-deoxyglucose (6-NBDG, Sigma) was evaluated as previously described.16 Briefly, after removal of growth medium, the cells were incubated with 300 µM 6-NBDG in PBS for 30 min at 37°C in the dark. Next, the cells were washed twice with PBS, detached by trypsinization and resuspended in PBS for immediate flow cytometry analysis with fluorescence-activated cell sorting scan flow cytometer (Becton Dickinson, Franklin Lakes, New Jersey, USA) using CellQuest Pro Software V.5.2. 6-NBDG uptake was identified after gating of viable (propidium iodide negative) cells. The mean fluorescence intensity served as a measure for 6-NBDG uptake on a per cell basis.
Radioisotope measurement of glucose uptake
[1,2-3H]-deoxy-D-glucose (2-DOG; PerkinElmer, Waltham, Massachusetts, USA) uptake was assessed according to the protocol of Kaliman et al18 with minor modifications as described previously.16 Briefly, the cells were seeded on 6-well plates and incubated with indicated concentrations of statins. Next, the cells were washed three times with PBS and 1 mL of transport solution (20 mM hydroxyethyl piperazineethanesulfonic acid (HEPES), 150 mM NaCl, 5 mM KCl, 5 mM MgSO4, 1.2 mM KH2PO4, 25 mM CaCl2, 2 mM pyruvate, pH 7.4) was added to each well. The cells were incubated for 30 min at 37°C with 1.5 μL of 2-DOG (8.0 mCi/mL radionuclide concentration). 2-DOG uptake was stopped by adding 50 mM D-glucose solution in PBS at 4°C. After a three-time wash in PBS the cells were detached with trypsinization and counted. Then equal numbers of cells were lysed with 0.1 M NaOH+0.1% sodium dodecyl sulfate (SDS) solution and left overnight at 4°C to enable complete cell lysis. To evaluate the non-specific uptake of isotope-labeled deoxy-d-glucose (t0 time point), stop solution (50 mM of d-glucose in PBS) was added to the cells instead of the PBS solution. The following day the lysates were analyzed in a scintillation counter (Wallac, Gaithersburg, Maryland, USA). All experimental groups were performed in duplicates.
Detection of glucose concentration in cell culture supernatants
Glucose levels were determined using the Amplex red glucose/glucose oxidase assay kit (Invitrogen) according to the manufacturer’s protocol based on the previously published methodology.19 ,20 Reactions were composed of 50 μM Amplex Red reagent, 0.1 U/mL horseradish peroxidase (HRP), 1 U/mL glucose oxidase, and 50 μL of cell cultured supernatants diluted 100 times in 50 mM sodium phosphate buffer, pH 7.4. After 30 min incubation at room temperature resorufin absorbance at 560 nm was measured. Glucose concentrations were calculated according to the D-glucose standard curve and normalized for total cellular protein content measured in cell lysates with Bio-Rad Protein Assay (Bio-Rad).
Generation of HEK293T cells stably expressing GLUT1-flag
Complementary DNA (cDNA) for human glucose transporter 1 (GLUT1) was amplified from Raji Burkitt’s lymphoma cells with a PCR reaction adding sequence encoding a flag tag to the 3’ end of the gene in frame with GLUT1. Next, the GLUT1-flag gene was cloned into the pLVX-IRES-Puro vector (Clontech Laboratories, Inc, Mountain View, California, USA) for subsequent lentiviral expression and verified with DNA sequencing. HEK293T cells were cotransfected with pLVX-GLUT1-flag-IRES-Puro or pLVX-IRES-Puro (for controls), envelope (pMD2.G), and packaging (psPAX2) vectors using standard calcium phosphate protocol. pMD2.G and psPAX2 plasmids were obtained from professor Didier Trono (École Polytechnique Fédérale de Lausanne, Switzerland). Lentivirus-containing supernatants were collected 48 h post transfection, centrifuged overnight at 4°C at 3000×g, and added to the culture of HEK293T cells for 24 h. Mixture of positive clones was selected with puromycin (Sigma) and evaluated with Western blotting using anti-flag tag antibody (Cell Signaling, cat #2368) as described below. Two independent sets of GLUT1-flag-expressing cells and empty vector-expressing cells were obtained for further studies.
Mutagenesis of GLUT1
To evaluate the effect of substitution of consensus amino acids (phenylalanine—F and arginine—R) within putative cholesterol recognition/interaction amino acid consensus (CRAC)-like cholesterol-interacting motifs in GLUT1 protein to alanine (A), the cDNA with the following modifications as compared with original GLUT1 sequence was designed: within 83–89 motif (VGLFVNR), F (TTC) was substituted with A (GCC) and R (CGC) was substituted with A (GCC); within 322–330 motif (VVSLFVVER), F (TTT) was substituted with A (GCC) and R (CGA) was substituted with A (GCC). Finally, flag-tag-encoding sequence was added to the 3' end of the cDNA together with 5' XhoI and 3' BamHI sites enabling subsequent cloning of the gene into pLVX-IRES-Puro lentiviral vector. The DNA synthesis was ordered in Epoch Life Science, Inc, Missouri City, Texas, USA. The sequence of transgene containing vectors was confirmed with DNA sequencing. HEK293T cells were modified with mutated GLUT1-flag gene (hereafter called MUT-GLUT1-flag) using lentiviral transduction and evaluated for transgene expression as described above. Two independent sets of mutated GLUT1-flag-expressing cells were obtained for further studies.
Western blotting
For immunoblotting analysis the cells were trypsinized, washed twice with PBS, pelleted, and lysed with 25 mM HEPES, 0.3 M NaCl, 1.5 mM MgCl2, 20 mM β-glycerol-phosphate, 2 mM EDTA, 2 mM ethylene glycol tetraacetic acid (EGTA), 1 mM dithiothreitol (DTT), 1% Triton X-100, and 10% glycerol-containing buffer supplemented with Complete protease inhibitor cocktail (Roche Diagnostics, Basel, Switzerland). Protein concentration was measured using Bio-Rad protein assay (Bio-Rad, Hercules, California, USA). The samples were not boiled as high temperature induces GLUTs protein aggregation. Equal amounts of whole-cell proteins were separated on 10% SDS–polyacrylamide gel, transferred onto Protran nitrocellulose membranes (Schleicher & Schuell BioScience, Keene, New Hampshire, USA), blocked with Tris-buffered saline (pH 7.4) and 0.05% Tween 20 supplemented with 5% bovine serum albumin. Anti-GLUT1 (Millipore, Temecula, California, USA) rabbit polyclonal antibody or anti-flag tag (Cell Signaling) rabbit polyclonal antibody were used at 1:1000 dilution for overnight incubation. After extensive washing with Tris-buffered saline (pH 7.4) and 0.05% Tween 20, the membranes were incubated for 45 min with anti-rabbit HRP-coupled secondary antibodies (Jackson Immuno Research, West Grove, Pennsylvania, USA). The chemiluminescence reaction for HRP was developed using self-made chemiluminescence reagent (100 mM Tris pH 8.0, 1.25 mM luminol, 0.2 mM coumaric acid, 0.006% hydrogen peroxide) and visualized with Stella 8300 bioimager (Raytest, Straubenhardt, Germany). The blots were stripped in 0.1 M glycine (pH 2.6) and reprobed with anti-actin-HRP conjugated rabbit polyclonal antibody (Sigma) at 1:50 000 dilution for 45 min.
Real-time PCR for GLUT1 quantification
For the isolation of total cellular RNA, the TRIzol reagent (Invitrogen) was used according to the manufacturer's protocol. RNA concentration was measured with NanoDrop 2000 spectrophotometer (Thermo Scientific, Wilmington, Delaware, USA). The first-strand cDNA synthesis containing 100 ng of total RNA was primed with oligo(dT) using native avian myeloblastosis virus reverse transcriptase (EurX, Gdansk, Poland). The primers for GLUT1-flag and β2-microglobulin (B2M, reference gene) were designed with online Universal Probe Library Assay Design Center software (Roche Applied Science, Basel, Switzerland). The sequences of the primers used for quantitative PCR (qPCR) were as follows: for GLUT1-flag forward: 5'-GCCAGCCAAAGTGACAAGAC-3' and reversed (complementary to the 3' flag-tag): 5'-TCATCGTCATCCTTGTAATCCA-3'; for B2M forward: 5'-TTCTGGCCTGGAGGCTATC-3' and reversed: 5'-TCAGGAAATTTGACTTTCCATTC-3' and FAM-labeled hydrolysis probes (Universal Probe Library, Roche) #17 and #42, respectively. To generate the standard curves serial dilutions of B2M cDNA and GLUT1-flag cDNA containing vectors (pBJ1-human B2M, cat #12099, Addgene, Cambridge, Massachusetts, USA and pLVX-GLUT1-flag-IRES-Puro, respectively) were used as templates. Quantitative real-time PCR (qRT-PCR) amplification reactions were performed in the LightCycler II 480 RT PCR system (Roche, Mannheim, Germany), using the LightCycler 480 Probe Master Kit (Roche). Data were analyzed using the LightCycler 480 Software V.1.5 (Roche). The fold change for GLUT1-flag gene relative to the reference gene (B2M) was calculated using user-non-influent, second-derivative method. The primers and reaction parameters were validated and optimized according to the MIQE (minimum information for publication of qRT PCR experiments) guidelines. In addition, reaction specificity was also confirmed by agarose gel electrophoresis in which the PCR products were of expected size.
Limited proteolysis of GLUT1-flag protein
Control and lovastatin-treated WT-GLUT1-flag-expressing HEK293T cells (1×10⁶) or WT-GLUT1-flag-expressing and MUT-GLUT1-flag-expressing HEK293T cells were rinsed with PBS, centrifuged under mild conditions (60×g for 5 min), and suspended in 100 µl PBS (pH 7.4). Next, the cells were incubated for 30 min at 37°C with 0, 1, 5, and 10 µg of bovine pancreas trypsin (T; Sigma Aldrich). After enzyme inactivation with 20 µg soybean trypsin inhibitor (Sigma Aldrich), cells were centrifuged (60×g for 5 min), lysed in 25 mM HEPES, 0.3 M NaCl, 1.5 mM MgCl2, 20 mM β-glycerol-phosphate, 2 mM EDTA, 2 mM EGTA, 1 mM DTT, 1% Triton X-100, and 10% glycerol buffer supplemented with Complete protease inhibitor cocktail (Roche Diagnostics). The supernatants were next mixed with a sample buffer (50 mM Tris pH 6.8, 50 mM DTT, 2.5 mM EDTA, 10% glycerol, bromophenol blue) and separated on 12% SDS-PAGE gel, transferred to a nitrocellulose membrane, and probed with anti-GLUT1 (Millipore) and anti-flag tag (Cell Signaling) antibodies.
Statistical analysis
Data were analyzed using Microsoft Excel 2010 and GraphPad Prism V.6.0 for Windows (GraphPad Software Inc) software. Differences in glucose uptake or glucose concentration in culture media were analyzed for significance by two-tailed Student t test or one-way analysis of variance with Tukey's or Bonferroni's post hoc tests (as indicated in the description to figures). Significance was defined as p<0.05.
Results
To investigate the influence of statins on glucose uptake in cells that are physiologically involved in glucose metabolism, differentiated human visceral preadipocytes, normal human SkMc, HSMM, and contact-inhibited human HepG2/C3A were preincubated with lovastatin for 48 h (figure 2). As we have previously shown, this incubation regimen leads to a decrease in the intracellular cholesterol content.16 The cells were then incubated with either fluorescently labeled 6-NBDG or tritiated 2-deoxyglucose (2-DOG), and the uptake of 6-NBDG and 2-DOG was measured after extensive washing of cells with PBS using flow cytometry or scintillation counter, respectively. The results of these experiments revealed that the uptake of 6-NBDG and 2-DOG is strongly suppressed in all lovastatin pretreated cells as compared with controls (figure 2A). Preincubation of SkMc and HepG2/C3A cells with lovastatin resulted in decreased glucose uptake as shown by increased glucose concentration in culture medium as compared with controls measured with Amplex Red (figure 2B) indicating that not only 6-NBDG and 2-DOG but also glucose is not efficiently transported into lovastatin pretreated cells. Also preincubation of human cells with other statins including atorvastatin, fluvastatin, simvastatin, and cerivastatin significantly impaired 6-NBDG and 2-DOG uptake (figure 2C).

Lovastatin decreases glucose uptake in non-malignant cell lines. (A) Differentiated human visceral preadipocytes, normal human skeletal muscle cells (SkMc), differentiated human skeletal muscle myoblasts (HSMM) or differentiated human hepatocellular carcinoma cells (HepG2/C3A) were incubated for 48 h with 10 µM lovastatin. Next, the cells were washed with phosphate-buffered saline (PBS) and incubated with either 300 µM 6-(N-(7-nitrobenz-2-oxa-1,3-diazol-4-yl)amino)-6-deoxyglucose (6-NBDG) in PBS or with 1.5 µL of [1,2-3H]-deoxy-D-glucose (2-DOG; 8.0 mCi/mL radionuclide concentration) for 30 min at 37°C. After three-time wash in cold PBS, the cells were analyzed in flow cytometry (6-NBDG) or in scintillation counter (2-DOG). The figure presents mean fluorescence intensity (MFI) or mean counts per minute (cpm)±SD; *p<0.05 vs controls in Student t test. (B) Normal human SkMc or differentiated human HepG2/C3A were incubated for 48 h with 5 µM (L5) or 20 µM (L20) lovastatin. Next, culture media were diluted and incubated with the reaction buffer composed of 10 mM Amplex Red, 10 U/mL horseradish peroxidase, and 100 U/mL glucose oxidase. The samples were light-protected and incubated at room temperature for 30 min. Next, absorbance at 560 nm was measured with spectrophotometer. Glucose values were calculated according to the glucose standard curve and normalized to the protein content measured with Bio-Rad Protein Assay; *p<0.05 vs controls in Student t test. (C) Normal human SkMc or differentiated human HepG2/C3A were incubated for 48 h with 10 µM atorvastatin (Ator), 10 µM fluvastatin (Flu), 10 µM simvastatin (Sim) and 1 µM cerivastatin (Cer). Next, the cells were washed with PBS and incubated with 300 µM 6-NBDG in PBS for 30 min at 37°C. After three-time wash in cold PBS, the cells were trypsinized and analyzed by flow cytometry. The figure presents MFI±SD; *p<0.05 vs controls in one-way analysis of variance and Tukey's post hoc test.
A 30 min incubation of differentiated human visceral preadipocytes with 10 mg/mL of MβCD to deplete cholesterol from the exoplasmic leaflet of the plasma membrane21 resulted in an over fourfold inhibition of 6-NBDG uptake (figure 3A) indicating the possibility that statin-mediated impairment of intracellular glucose transport might result from diminished plasma membrane cholesterol content. Restoration of cellular cholesterol with cholesterol-MβCD complexes in differentiated human visceral preadipocytes and HSMM cells rescued glucose uptake in lovastatin-treated cells (figure 3B). Similar restoration of glucose uptake in lovastatin-treated cells was observed in cells incubated with MA, a downstream product of HMG-CoAR in cholesterol biosynthesis pathway (figure 3C).

Decreased glucose uptake results from inhibition of mevalonate pathway. (A) Differentiated human visceral preadipocytes were incubated for 30 min with 10 mg/mL methyl-β-cyclodextrin (MβCD). Next, the cells were washed with phosphate-buffered saline (PBS) and incubated with 300 µM 6-(N-(7-nitrobenz-2-oxa-1,3-diazol-4-yl)amino)-6-deoxyglucose (6-NBDG) in PBS for 30 min at 37°C. After three-time wash in cold PBS, the cells were trypsinized and analyzed by flow cytometry. The figure presents mean fluorescence intensity (MFI)±SD; *p<0.05 vs controls in Student t test. (B) Differentiated human visceral preadipocytes or differentiated human skeletal muscle myoblasts (HSMM) were incubated for 48 h with 10 µM lovastatin (L). For the last 30 min of incubation, 0.2 mg/mL of water-soluble cholesterol–MβCD (chol) was added. Next, the cells were washed with PBS and incubated with 300 µM 6-NBDG in PBS for 30 min at 37°C. After a three-time wash in cold PBS, the cells were trypsinized and analyzed by flow cytometry. The figure presents MFI±SD; *p<0.05 in one-way analysis of variance and Tukey's post hoc test. (C) Differentiated human visceral preadipocytes, normal human skeletal muscle cells (SkMc), differentiated HSMM or differentiated human hepatocellular carcinoma cells (HepG2/C3A) were incubated for 48 h with 10 µM L and 200 mM mevalonic acid (M). Next, the cells were washed with PBS and incubated with 300 µM 6-NBDG in PBS for 30 min at 37°C. After three-time wash in cold PBS, the cells were trypsinized and analyzed by flow cytometry. The figure presents MFI±SD; *p<0.05 in one-way analysis of variance and Tukey's post hoc test.
Despite many efforts, the structural information for GLUT1 or its homologues remains unknown. Therefore, we have previously used a comparative modeling approach22 to obtain a putative structure of GLUT1 based on the glycerol-3-phosphate transporter structure and to show that GLUT1 contains a CRAC or CRAC-like domains within its juxtamembrane regions.16 Recently, a crystal structure of the XylE, a xylose transporter from Escherichia coli was determined, which is more closely related to GLUT1.23 The updated model of GLUT1 structure obtained using the same approach as previously, using the XylE structure (4GBY in Protein Data Bank) as a template, revealed the presence of two CRAC-like cholesterol interaction consensus sequences within a membrane embedded region of GLUT1 (figure 4A,B) analogously to the previous report.16

Localization of putative cholesterol-binding motifs in the homology model of human glucose transporter 1 (GLUT1) protein. (A) A homology model of human GLUT1 protein: N-termini and C-termini are indicated and the placement within the plasma membrane is only schematic. (B). Putative cholesterol recognition/interaction amino acid consensus (CRAC)-like motifs in GLUT1: aa 83–89 (VGLFVNR, left) and aa 322–330 (VVSLFVVER, right).
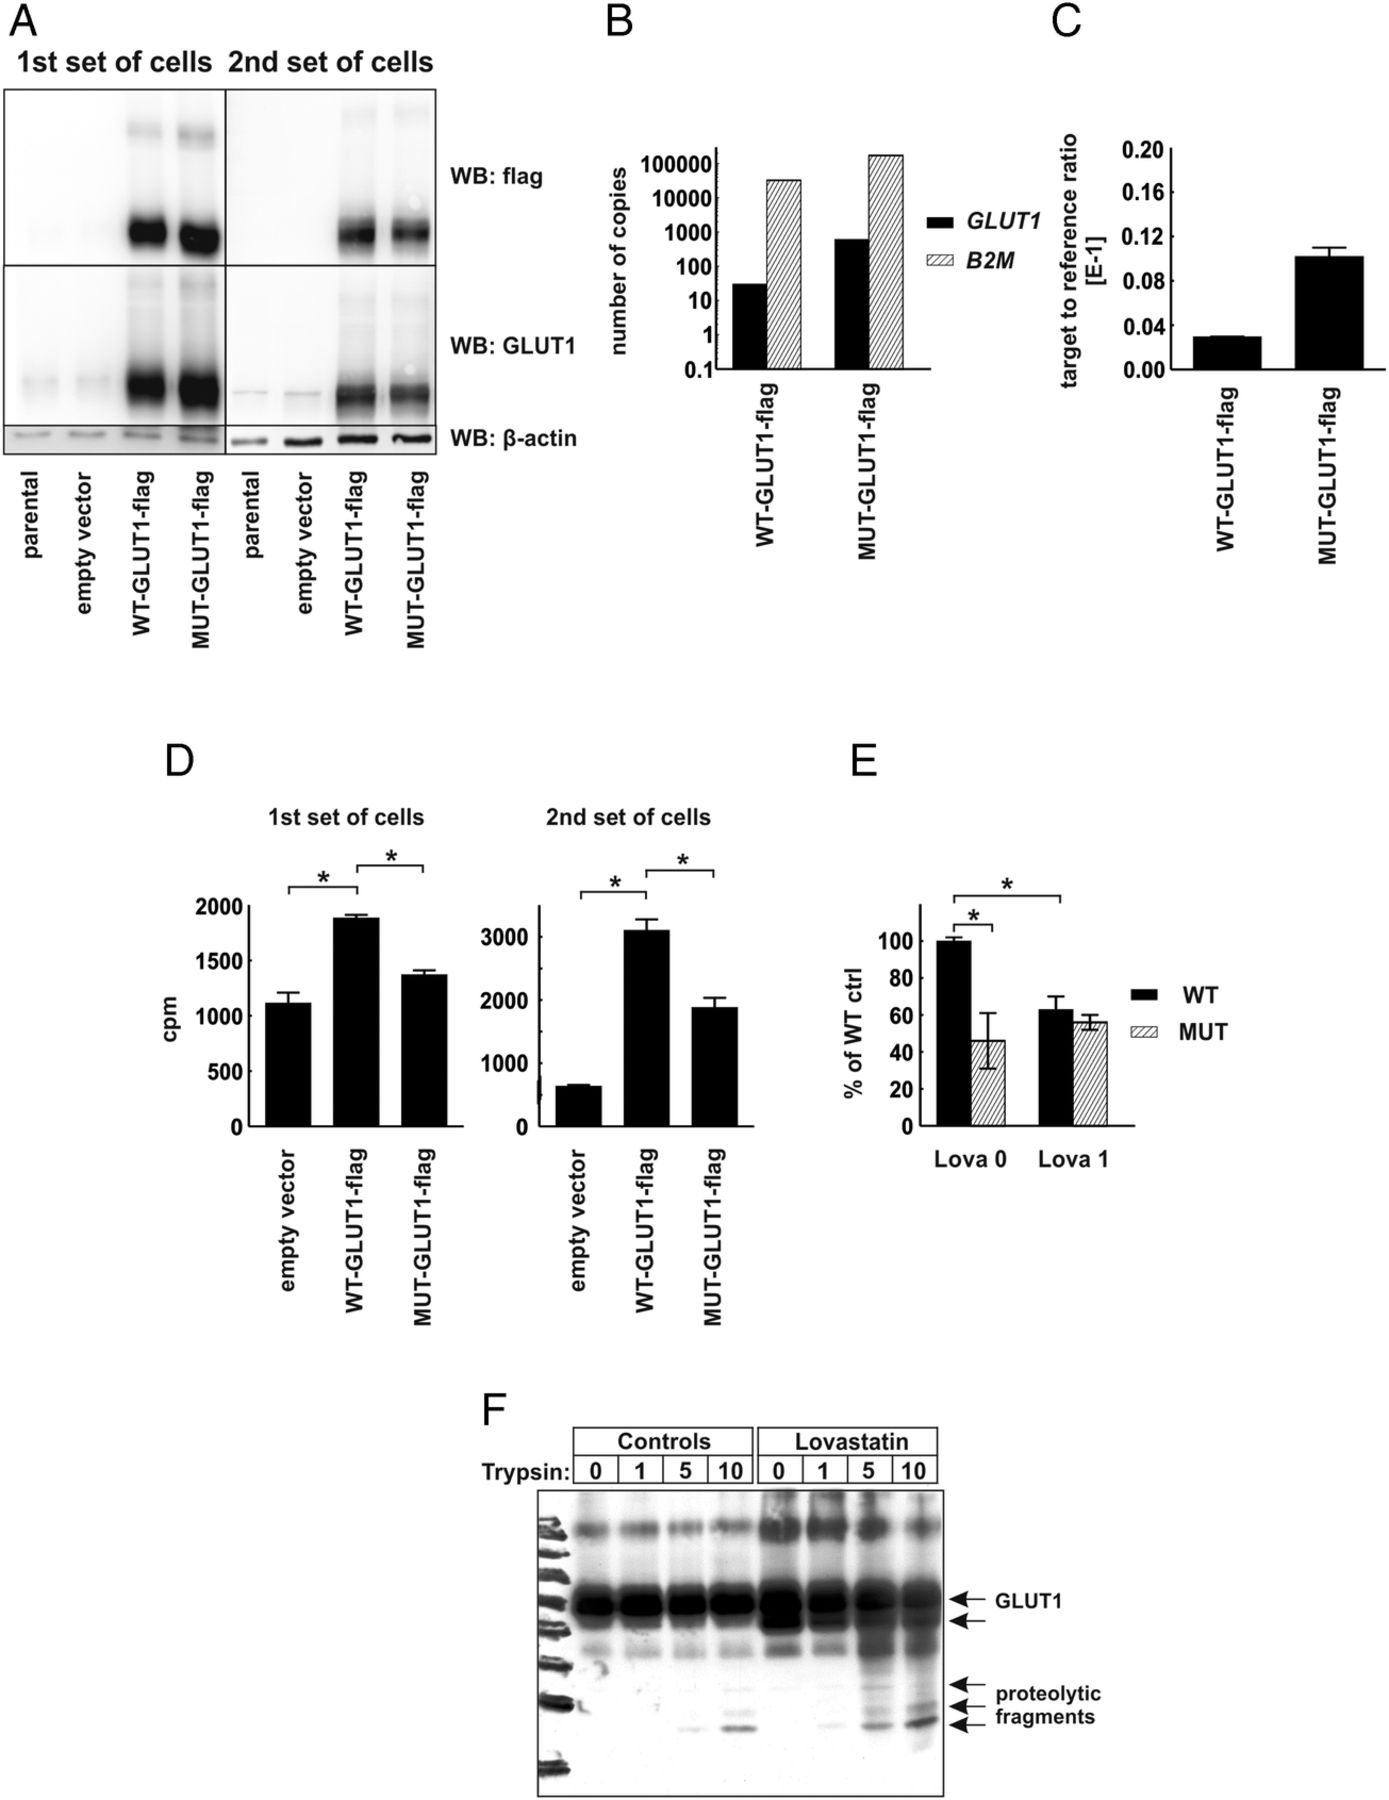
To verify the functional role of CRAC-like cholesterol-interacting motifs localized within the transmembrane region of human GLUT1 protein, we have carried out mutagenesis of SLC2A1 gene to substitute consensus amino acids (phenylalanine and arginine) with alanines within 83–89 CRAC-like motif (VGLFVNR) and 322–330 CRAC-like motif (VVSLFVVER), generating MUT-GLUT1-flag gene. Next, we transduced HEK293T cells with lentiviral vectors encoding C-terminus flag-tagged wild-type (WT-GLUT1-flag) or a gene encoding mutant (MUT-GLUT1-flag) human GLUT1 protein. Two independent sets of transduced HEK293T cells were generated, and transgene expression was determined with immunoblotting for GLUT1 and flag-tag expression (figure 5A) and with qPCR reaction using absolute and relative transgene quantification method (figure 5B,C, respectively). In both sets of cells the expression of MUT-GLUT1-flag was slightly higher than that of WT-GLUT1-flag. Interestingly, HEK293T cells expressing MUT-GLUT1-flag have taken up significantly less 2-DOG as compared with cells expressing WT-GLUT1-flag (figure 5D). Moreover, incubation of the cells for 48 h with 1 μM lovastatin impaired 2-DOG uptake in WT-GLUT1-flag expressing, but not in MUT-GLUT1-flag expressing cells (figure 5E). The results of these experiments confirm that the presence of cholesterol interaction domains is necessary for glucose-transporting activity of GLUT proteins and indicate the possibility that inhibition of cholesterol synthesis with statins might have an impact on the cellular glucose uptake.

Human embryonic kidney (HEK293T) cells expressing mutated glucose transporter 1-flag gene (MUT-GLUT1-flag) uptake less glucose than their WT-GLUT1-flag counterparts. (A) Evaluation of GLUT1 and GLUT1-flag protein expression in total cellular lysates of two independent sets of parental (non-transduced) HEK293T cells, cells transduced with empty vector, WT-GLUT1-flag and MUT-GLUT1-flag with Western blotting. β-actin levels served as loading control. (B) Absolute quantification of GLUT1-flag and β-2-microglobulin (B2M) transcripts in HEK-WT-GLUT1-flag and HEK-MUT-GLUT1-flag cells. (C) Relative quantification of GLUT1-flag transcript in HEK-WT-GLUT1-flag and HEK-MUT-GLUT1-flag cells. (D) [1,2-3H]-deoxy-D-glucose (2-DOG) uptake in two independent sets of HEK293T cells transduced with empty vector, WT-GLUT-flag, or MUT-GLUT1-flag. The figure presents mean counts per minute (cpm) value±SD; *p<0.05 in one-way analysis of variance (ANOVA) and Bonferroni's post hoc test. (E) 2-DOG uptake in the first set of HEK293T cells transduced with WT-GLUT-flag or MUT-GLUT1-flag incubated for 48 h with 1 μM lovastatin. The figure presents mean cpm as a percentage of WT-GLUT1-flag controls±SD; *p<0.05 in one-way ANOVA and Bonferroni's post hoc test. (F) Limited trypsin proteolysis of membrane proteins in HEK293T cells transduced with empty pLVX-IRES-Puro or WT-GLUT1-flag-encoding vector. The cells were preincubated for 48 h with 2.5 μM lovastatin. Each sample consisted of 1 mLn of cells. The cells were exposed to 0–10 μg/mL trypsin for 20 min. The figure presents result of Western blot using anti-GLUT1 antibody.
Finally to see whether statin-mediated inhibition of cholesterol synthesis could result in conformational changes in GLUT proteins a limited proteolysis experiment was carried out. Trypsin digestion of flag-GLUT1-transfected cells revealed a different pattern of bands in lovastatin-treated cells as compared with controls (figure 5F), indicating that statins induce conformational changes in GLUT1 thereby exposing trypsin-sensitive sites in this transporter.
Discussion
It remains unclear whether and how statins may be implicated in the development of diabetes. A number of potential mechanisms have recently been proposed by Goldfine,24 including interference with insulin secretion from pancreatic β cells, lower activity of insulin signaling proteins in adipocytes, or reduced expression or trafficking of GLUTs. Our results suggest that the effects of statins on glucose homeostasis can also be inherent to their cholesterol-lowering activity. By inhibiting mevalonate pathway statins decrease cholesterol content within plasma membranes.25 Cholesterol allows condensation of membrane lipids and rigidifies fluid plasma membrane to reduce passive permeability, increase its mechanical properties, and increase total thickness.26 These effects have significant consequences for the function of membrane-embedded proteins, especially those with multiple membrane-spanning domains.27 Since GLUTs have 12 transmembrane domains we have previously suggested that by reducing plasma cholesterol content statins might affect the structure and function of GLUTs.16 We observed that statins decrease glucose uptake in primary human visceral adipocytes, skeletal myocytes, differentiated hepatoma cells (figure 2), as well as in tumor cells.16 These effects are neutralized by either water-soluble cholesterol or MA (figure 3B,C). Also extraction of membrane cholesterol with MβCD inhibits glucose uptake (figure 3A). Our previous homology model based on the structure of glycerol-3-phosphate transporter,16 which we have updated in this work using the XylE xylose transporter structure as a template, reveals that GLUTs contain putative CRAC or CRAC-like domains within their juxtamembrane regions (figure 4). Functional substitution of corresponding amino acid motifs in GLUT1 revealed that these regions are important in conferring the ability to transport glucose by this transporter (figure 5). Our observations indicate that inhibition of cholesterol synthesis affects the function of transmembrane proteins that play a critical role in glucose homeostasis and are in concordance with previously published observations, where statin treatment reduced glucose uptake in 3T3-L1 murine adipocytes.28 ,29 However, in the cited articles the authors claimed the statin effects were associated with either decreased GLUT4 expression or impaired signal transduction from the insulin receptor.
Further studies defining the risks of statin-induced diabetes or glycemic control in patients with diabetes are necessary. However, the overwhelming benefit of statins in reducing cardiovascular events seems to supersede the small increase in the relative risk of developing diabetes.30 More intense vigilance of fasting glucose levels seems to be a reasonable approach in statin users. Elucidation of the molecular mechanisms of statin-induced effects should be continued. The results of these studies can shed light on development of novel approaches mitigating negative consequences of statin treatment or development of novel therapeutic approaches for cardiovascular diseases in high-risk patients or patients with diabetes.
Acknowledgments
The authors would like to thank Ewa Wilczek for providing us with antidesmin antibody. The authors also acknowledge Elzbieta Gutowska, Anna Czerepinska, and Agnieszka Zagozdzon for excellent technical assistance.
References
Footnotes
DN and AM contributed equally.
-
Contributors DN was involved in research concept and design, collection and assembly of data, data analysis and interpretation, writing the article, designed and conducted most of the research, analyzed and interpreted data, and supervised the study. AM, KF, BO, RS, JC, MF, ADS, RZ, EG-M and LS were involved in collection and assembly of data, data analysis and interpretation, revision and final approval of the article. JMB was involved in bioinformatics analyses, acquisition of funding, data analysis and interpretation, revision and final approval of the article. JG was involved in research concept and design, acquisition of funding, data analysis and interpretation, and writing the article.
-
Funding This work was supported by grants N N402 365438 (JG), from Polish Ministry of Science and Higher Education, grant from the European Commission 7th Framework Programme: FP7-REGPOT-2012-CT2012-316254-BASTION (JG). The work carried out by JMB (modeling of GLUT1) was supported by the Polish Ministry of Science and Higher Education (grant number POIG.02.03.00-00-003/09).
-
Competing interests None.
-
Provenance and peer review Not commissioned; externally peer reviewed.
-
Data sharing statement The human glucose transporter 1 (GLUT1) homology model created using XylE xylose transporter structure as a template is available at: ftp://genesilico.pl/iamb/models/GLUT1/. No additional data are available.