Article Text

Abstract
Objective Residual insulin secretion provides important protection against the development of diabetic retinopathy in type 1 diabetes. The data to support this in type 2 diabetes are unclear. We therefore tested in type 2 diabetes whether markers of residual beta-cell function are associated with the development of diabetic retinopathy, an important microvascular complication of diabetes.
Design Prospective, cross-sectional, family-based study.
Participants 585 Latino type 2 diabetic participants, ascertained in families via a proband either with known diabetes duration of greater than 10 years and/or with diabetic retinopathy.
Outcome measures Circulating levels of fasting insulin and C peptide measured and correlated to degree of diabetic retinopathy, assessed by digital fundus photography and graded using the Modified Airlie House Classification and the Early Treatment Diabetic Retinopathy Study scale (range: levels 10–85).
Results Fasting plasma insulin (β=−0.29; 95% CI −0.38 to −0.20; p<0.0001) and C peptide (β=−0.21; 95% CI −0.30 to −0.13; p<0.0001) concentrations in these diabetic participants were significantly correlated with retinopathy and its degree of severity. This relationship remained significant after adjusting for potential covariates including age, gender, glycosylated hemoglobin, duration of diabetes, blood pressure, and renal function.
Conclusions These data suggest that residual endogenous insulin secretion is associated with the presence of diabetic retinopathy and its severity in Latinos with familial type 2 diabetes. It remains to be proven whether beta-cell targeted therapies, to maintain beta-cell mass and/or function in addition to glycemic control, will further the goal of preventing diabetic microvascular disease.
- Retinopathy
- Insulin
- C-Peptide
This is an Open Access article distributed in accordance with the Creative Commons Attribution Non Commercial (CC BY-NC 3.0) license, which permits others to distribute, remix, adapt, build upon this work non-commercially, and license their derivative works on different terms, provided the original work is properly cited and the use is non-commercial. See: http://creativecommons.org/licenses/by-nc/3.0/
Statistics from Altmetric.com
Key messages
-
Large family-based cohort of Latinos with type 2 diabetes recruited exclusively in the Los Angeles area.
-
Seven-field fundus photography and standardized diabetic retinopathy grading system using the Modified Airlie House Classification and the Early Treatment Diabetic Retinopathy Study (ETDRS) scale.
-
Suggests the possible importance of beta-cell targeted therapy in prevention of diabetic retinopathy in type 2 diabetes.
-
Limitations include the cross-sectional nature of the study and the need to adjust for family relationship.
Introduction
Diabetic retinopathy (DR), an important microvascular complication of diabetes, is a leading cause of blindness in working-age adults. Latinos are the fastest growing ethnic minority in the USA and have a higher risk of developing type 2 diabetes1 and DR2 than non-Hispanic Caucasians. This difference is not explained by previously well-established risk factors such as glycemic control and blood pressure.2 Indeed, recent studies of type 2 diabetes have demonstrated that even achieving goals of tight glycemic control may not prevent progression of DR, suggesting the need for a better understanding of other risk factors.3–5 One of these is endogenous insulin secretion. Our prior biomarker study demonstrates that levels of both soluble tumor necrosis factor receptors 1 and 2 are positively correlated with severity of DR, suggesting that both inflammation and insulin regulation may be involved in the development of DR.6
Insulin secretion is also a potential modifier of DR, though the relationship of endogenous insulin secretion with DR in type 2 diabetes remains unclear. Studies in type 1 diabetes suggest that residual endogenous insulin secretion, as reflected by circulating C peptide concentrations, may have protective effects in the eye,7 ,8 whereas studies in type 2 diabetes are contradictory.9–15 The GOLDR (Genetics of Latinos Diabetic Retinopathy) study6 afforded us the opportunity to test the role of diminished residual insulin secretion in the development of DR and its severity, due to the large cohort studied and the relatively large number of participants with severe forms of DR. We hypothesized that evidence for diminished residual insulin secretion would be associated with presence of DR and also its severity, independent of glycemic control and diabetes duration in patients with type 2 diabetes.
Methods
Ethics
This study was performed in accordance with the tenets of the Declaration of Helsinki and approved by the institutional review boards of each participating center. Informed consent was obtained from each participant.
Study participants
The GOLDR study is a family-based study assessing diabetes and diabetic complications in families (siblings and/or parents) of a proband, defined as having type 2 diabetes and either known DR or a diabetes duration of ≥10 years. Participants are all Latinos of Mexican or Central American origin, recruited, and studied at the Los Angeles BioMedical Research Institute at Harbor-UCLA Medical Center (HUMC).
Siblings and parents with unknown diabetes status at the time of the study were offered an oral glucose tolerance test (OGTT). The diagnosis of diabetes was based on standard criteria from the American Diabetes Association.16 Participants who were determined to be non-diabetic after an OGTT, or a fasting plasma glucose <126 mg/dL (<7 mmol/L) and glycosylated hemoglobin (HbA1c) <6.5% at the initial study visit, and/or those with undetermined DR status from fundus photography were removed from the analysis. In total, there were 585 type 2 diabetic participants from 212 families, with sizes ranging from 1 to 8 members per family, whose data were used in the analyses for this study. There were 183 families with 1 generation, 26 families with 2 generations, and 3 families with 3 generations. Furthermore, there were a total of 552 sib-pairs in this study.
The participants’ demographics, pedigree information, medical history, family history, and current medications were collected. Anthropometric measurements (height, weight, waist circumference), vital signs (blood pressure and pulse), and blood and urine samples (fasting serum glucose, HbA1c, serum lipids, serum creatinine, and urinary albumin-to-creatinine ratio) were measured. The estimated glomerular filtration rate (eGFR) was calculated using the 2009 CKD-EPI (Chronic Kidney Disease Epidemiology Collaboration) equation, which takes into account the participant's age, gender, race, and creatinine level.17
Measurements of biochemical assays
Fasting plasma C peptide was measured by radioimmunoassay (Coat-A-Count RIA kit, Diagnostic Products Corporation, Los Angeles, California, USA). The lower limit of sensitivity of this assay is 0.033 nmol/L. Fasting plasma insulin concentration was measured by Dissociation-Enhanced Lanthanide Fluorescent Immunoassay (DELFIA; PerkinElmer Life Sciences, Waltham, Massachusetts, USA). The lower limit of sensitivity of this assay is 1.12 μU/mL.
Eye phenotypes
All participants received dilated ophthalmic eye examination with seven standard 30° fields using digital stereoscopic color fundus photography at HUMC. Retinal images were evaluated by two independent masked photograders at the Ocular Epidemiology Reading Center at the University of Wisconsin, Madison, using the Modified Airlie House Classification Scheme and the Early Treatment Diabetic Retinopathy Study (ETDRS) severity scale.18
Statistical analyses
DR status
Participants were first grouped as diabetes without retinopathy (controls) versus diabetes with retinopathy (cases). Levels of fasting C peptide and insulin were compared between these two groups using the Student t test, adjusting for family relationships. Insulin analysis was conducted in participants without exogenous insulin usage.
DR severity
We then examined the association of C peptide and insulin with severity of DR using the retinopathy score from the ETDRS scale in categorical and quantitative analyses. The ETDRS scale, though it utilizes a numerical step scale, is graded categorically using well-defined criteria.18 For the purpose of our study, in the categorical analysis, participants were grouped into five classes of increasing severity: none (levels 10–13), mild non-proliferative DR (NPDR; levels 14–20), moderate NPDR (levels 31–43), severe NPDR (levels 47–53), and proliferative DR (PDR; levels 60–85), as previously described.6 In the ‘quantitative’ analysis, the assigned numerical retinopathy score from the ETDRS severity scale was utilized. The eye with the more severe retinopathy score was used for assigning the retinopathy level for each participant.
Statistical analyses
Statistical analyses and database management were performed using SAS V.9.1 (SAS Institute Inc, Cary, North Carolina, USA). All data were first transformed before analysis. A log or squared-root transformation was applied to normalize the quantitative traits of interest, and a normal distribution was assumed in the analysis. Logistic regression with multilevel link function (multinomial distribution) was used for categorical data.
We used the generalized estimating equation methods (GEE1) as implemented in the GENMOD procedure of SAS to determine the relationship of C peptide and insulin with severity of DR. This approach accounts for the dependency of a familial relationship that may bias the outcome of a study. A pedigree is first drawn for each family. This approach uses ‘family’ as a unit of clustering factor. A correlation matrix based on family relationship is then estimated for participants in this study, assuming that members from the same family are correlated and members from different family are independent. The regressions were reanalyzed correcting for this relationship. A detailed explanation of this approach is described elsewhere.19
To determine whether the association was independent of known DR risk factors, different models were used to analyze the relationship of C peptide and insulin with severity of DR, adjusting for potential covariates. In model 1, the association was analyzed without any covariate adjustments except for family structure. In model 2, the significance of this trend was analyzed adjusting for family structure, age, gender, HbA1c, diabetes duration, systolic blood pressure, and serum creatinine. In model 3, the significance of this trend was analyzed adjusting for family structure, age, gender, HbA1c, diabetes duration, systolic blood pressure, and urinary albumin-to-creatinine ratio. And finally, in model 4, the significance of this trend was analyzed adjusting for family structure, HbA1c, diabetes duration, systolic blood pressure, and eGFR. We adjusted for glycemic control using HbA1c only, which has less variation than fasting glucose, and to prevent multicollinearity with too many covariate adjustments. Although certain drugs, such as fibrates or thiazolidinediones, may affect study outcome we did not adjust for these because too few participants were on these medications to permit a meaningful analysis (only 4.7% of study participants on fibrates, and only 15.2% on thiazolidinediones).
To further delineate whether the relationship of C peptide with severity of DR is independent of the above potential confounders, such as renal impairment, we calculated the residuals of C peptide regression on creatinine (renal function only) and on HbA1c, diabetes duration, systolic blood pressure, and eGFR (model 4). We then explored the associations of residual C peptide with severity of DR, in categorical and quantitative analyses.
All statistical analyses were performed with JMP and GENMOD in SAS, adjusting for family relationship. A p<0.05 was considered statistically significant. Data are presented as mean±SEM (SE of the mean).
Results
A total of 585 participants were included in this study and the demographics are summarized in table 1. As expected, cases, defined as diabetes with retinopathy (n=329), exhibit a higher level of HbA1c (p<0.0001), a longer diabetes duration (p<0.0001), a higher percentage of participants using exogenous insulin injections (p<0.0001), a higher systolic blood pressure (p<0.0001), and worse renal function (p<0.0001), compared with the controls, defined as diabetes without retinopathy (n=256). For the biomarker assays, cases have a lower level of C peptide (1 versus 1.2 nmol/L; p=0.0005). Insulin was evaluated in patients not receiving exogenous insulin injections (n=406), and was found to be lower in the patients with DR versus those with no DR (10.1 versus 13.7 μU/mL; p<0.0001; table 1). Serum total cholesterol, triglyceride, high-density lipoprotein, and low-density lipoprotein were similar in the two groups (data previously published6).
Demographics and laboratory results of cohort
To delineate the relationship of insulin and C peptide with levels of DR severity, we first examined our data by DR phenotype defined categorically. Of the 329 cases with DR, 29.5% had mild NPDR, 40% had moderate NPDR, 7.5% had severe NPDR, and 23% had PDR (table 2). Categorical analysis indicated that the mean plasma C peptide decreased progressively from 1.23±0.04 nmol/L in participants with no DR to 0.87±0.14 nmol/L in severe NPDR, and increased to 1.14±0.08 nmol/L in PDR (p=4.7×10⁻⁷ adjusting for family structure; table 2 and figure 1A). The mean level of insulin in participants without exogenous insulin injection progressively decreased from 13.69±0.6 in those without DR to 8.47±1.47 μU/mL in PDR (p=8.63×10⁻⁹ adjusting for family structure and exogenous insulin usage; table 2 and figure 1B).
Categorical analysis of C peptide and insulin with severity of diabetic retinopathy and corresponding renal functions

Graphs of C peptide (A) and insulin (B) with severity of diabetic retinopathy analyzed categorically (top). Corresponding comparison of C peptide (C) and insulin (D) using the ETDRS scale with severity of diabetic retinopathy analyzed quantitatively (bottom). The reported p values are analysis conducted in four models: unadjusted (no covariate adjustment, except for family relationship) and adjusted (covariate adjustments including family relationship plus age, gender, HbA1c, diabetes duration, systolic blood pressure, and renal function (serum creatinine, urinary albumin-to-creatinine ratio), and eGFR, respectively*). ETDRS, Early Treatment Diabetic Retinopathy Study; HbAIc, glycosylated hemoglobin; eGFR, estimated glomerular filtration rate; DM, diabetes mellitus; DR, diabetic retinopathy; NPDR, non-proliferative diabetic retinopathy; PDR, proliferative diabetic retinopathy.
To determine whether the identified association was independent of other risk factors, we then analyzed the data adjusting for potential covariates. We found that both the Cpeptide and insulin association with severity of DR remained significant after adjusting for family structure, age, gender, HbA1c, diabetes duration, systolic blood pressure, and renal function (table 2).
We also analyzed the data ‘quantitatively’ using the ETDRS scale. Quantitative analysis demonstrated that both C peptide (β=−0.21; 95% CI −0.30 to −0.13; p=1.3×10⁻⁶) and insulin (β=−0.29; 95% CI −0.38 to −0.20; p=5.6×10⁻¹⁰) were inversely correlated with severity of DR (table 3). This relationship remained significant even after adjusting for family structure, age, gender, HbA1c, diabetes duration, systolic blood pressure, and renal function for both C peptide (table 3 and figure 1C) and insulin (table 3 and figure 1D).
Quantitative analysis of C peptide and insulin with severity of diabetic retinopathy
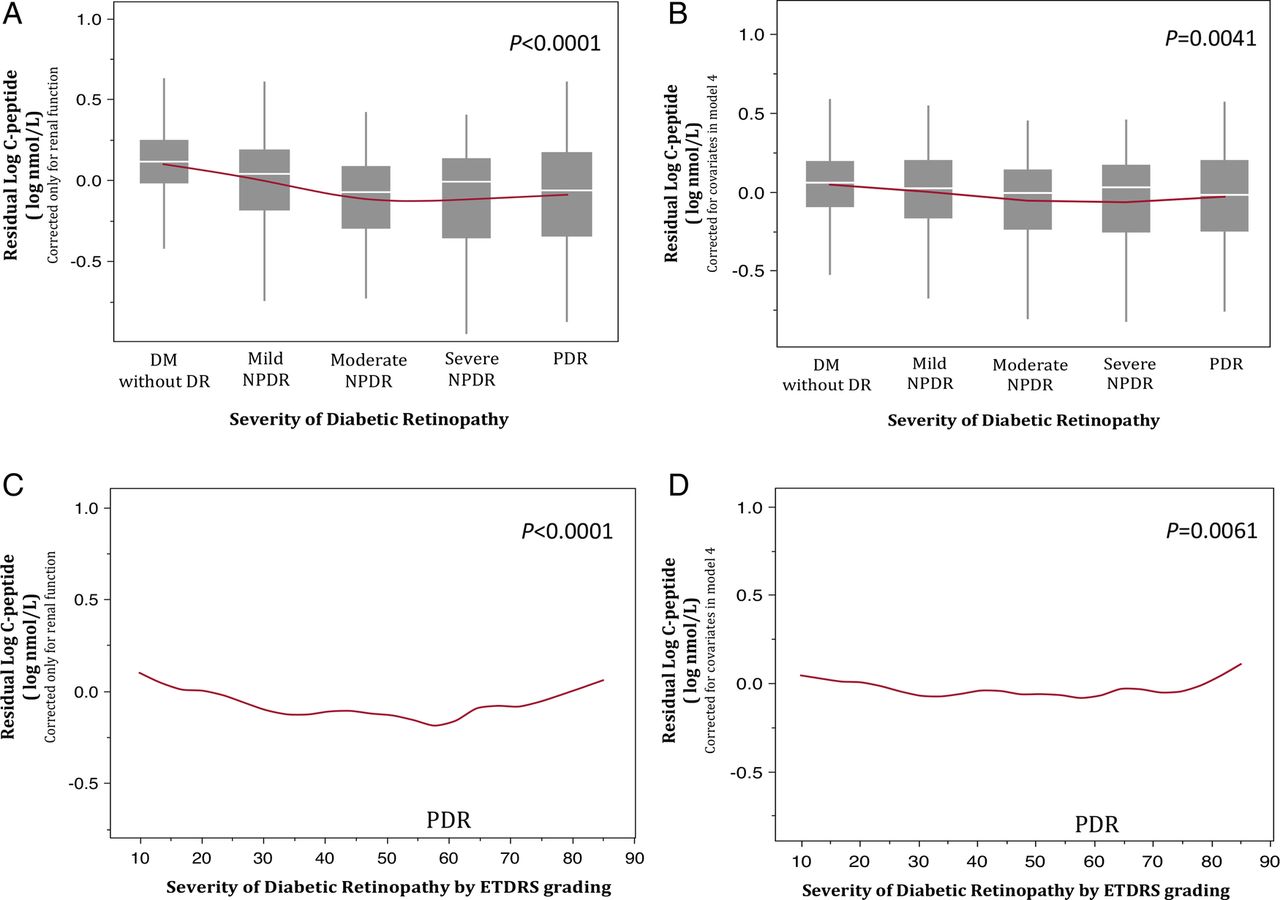
Both categorical and quantitative analyses demonstrate that the level of C peptide decreases with severity of DR, but seems to have a paradoxical increase in the PDR group. These values are the uncorrected C peptide concentrations. To explore whether this observed increase is possibly due to renal impairment on C peptide clearance, we first examined renal function by degree of DR severity in our participants. The PDR group exhibited worse renal function (mean serum creatinine 1.84 mg/dL; mean eGFR 68.2 mL/min/1.73 m2) compared with all other groups (table 2).
We then evaluated the corrected C peptide by examining the ‘residuals’ of C peptide with creatinine (renal function only; figure 2A, C) and with HbA1c, diabetes duration, systolic blood pressure, and eGFR (model 4; figure 2B, D) on DR severity in the regression model. We found that the C peptide residuals do not increase with the PDR group—i.e, C peptide remains significantly associated with severity of DR, independent of renal function in categorical (p<0.0001, figure 2A) and quantitative (p<0.0001, figure 2C) analyses, respectively. Corrected C peptide with additional covariates showed similar findings in categorical (p=0.0041) and quantitative (p=0.0061) analyses (figure 2B, D, respectively). The decreasing trend of C peptide is thus made more apparent with examination of the residuals. We did not evaluate residuals for insulin because there was no paradoxical rise in the entire PDR group (see figure 1B). The PDR group is composed of participants with an ETDRS score that ranges from 60 to 85. In figure 1D, the curve rises in those with a score of 85, which is essentially only 7 participants and is <10% of the entire PDR group.
Graphs of residual C peptide with severity of diabetic retinopathy analyzed categorically (top) and quantitatively (bottom). Residual C peptide corrected only for renal function (creatinine; A and C) and corrected for covariates in model 4 (B and D) is shown. DM, diabetes mellitus; DR, diabetic retinopathy; NPDR, non-proliferative diabetic retinopathy; PDR, proliferative diabetic retinopathy; ETDRS, Early Treatment Diabetic Retinopathy Study.
Discussion
Statement of principal findings
This study provides evidence that in Latinos with type 2 diabetes, fasting insulin and C peptide concentrations are significantly lower in patients with DR when all forms of DR are included, compared with non-DR. Furthermore, reduced insulin and C peptide concentrations are associated with severity of DR. This relationship remains significant after controlling for known confounding risk factors for DR, including age, gender, glycemic control, diabetes duration, blood pressure, and renal function.
Comparisons with other studies
It is well known that glycemic control is a key factor in determining the development of DR in type 1 and type 2 diabetes,20 ,21 and this information has driven the adoption of glycemic goals as standards of care for diabetes management, at HbA1c levels of 7%. Though key to the development and progression of DR, the mechanisms by which glycemia influences the development of DR have been questioned22; glycemic variation has been suggested as a more important contributor than overall glycemic burden. Also, glycemic control as a management strategy may have its limitations in DR prevention, as recently shown in studies of type 2 diabetes in which further improvement in HbA1c below 7% did not provide additional benefit to reduce DR.3 ,4 DR progressed in these studies, apparently independent of improved glycemic control. This strongly suggests that factors other than glycemic control may also be involved in the progression of DR, which was the rationale for the development of the GOLDR protocol. In this study, we evaluated the role of residual insulin secretion in relationship with the presence of DR and its severity.
The relationship of endogenous insulin secretion with the development of DR remains unclear. In type 1 diabetes, residual endogenous insulin secretion protects patients against development of DR,7 ,8 while in type 2 diabetes, previous studies have not been definitive in demonstrating a clear relationship. Some prior studies demonstrated that lower levels of C peptide are associated with DR,9–12 while other studies did not.13–15 Our findings are consistent with those studies that found an inverse correlation of DR with C peptide in type 2 diabetes.9–12 For example, Yoon et al11 found that patients with DR have a lower level of basal and stimulated C peptide compared with patients without DR. Similar findings were observed by Bo et al10 in a larger study, in which the lowest tier of C peptide was associated with the highest incidence of DR at baseline and also when followed longitudinally. These studies suggest that levels of C peptide, and thus endogenous beta-cell function, were inversely correlated with prevalence and incidence of DR. In another example, the Wisconsin Epidemiologic Study of Diabetic Retinopathy (WEDSR) study found a lower C peptide concentration in participants with PDR.23 However, the PDR group in that study may have included persons with type 1 diabetes, making conclusions about this relationship less certain for type 2 diabetes. That group concluded that it was likely glycemic control, not C peptide that is associated with DR.24
Our study differs from previous studies in that we examined the relationship of C peptide and DR in patients within the entire spectrum of DR severity and used 7-field digital imaging with standard ETDRS grading criteria. Furthermore, none of the prior studies measured insulin concentration, a better representation of residual beta-cell function, and evaluated this metric with the severity of DR.
Importance of the study
In our study, the association of circulating insulin and C peptide with severity of DR remained highly significant after adjusting for well-known risk factors for DR, including diabetes duration and glycemic control. Of note, there are no other studies of residual insulin secretion and DR in Latinos, and it is unclear whether ethnic differences contribute to the observed differences in previous studies, which were performed in a variety of populations. An important contribution of this study is the demonstration in a large cohort of people with DR, not only of a relationship between residual insulin secretion and DR, but for the first time, a relationship between residual insulin secretion and the severity of DR. Overall, the degree of deficit in endogenous insulin secretion is associated with increasingly severe DR.
Plasma C peptide concentrations paralleled plasma insulin across the range of severity of DR, supporting the likelihood that the insulin concentrations reflect insulin secretion—and therefore beta-cell function. This is the only study in which both insulin and C peptide were examined to clarify the role of residual beta-cell function in DR. However, in the PDR group, C peptide concentrations were observed to be higher relative to the insulin concentrations. This apparent internal discrepancy is likely a result of the greater effect of concomitant renal disease on C peptide clearance in the PDR group, as the PDR group clearly demonstrates impaired renal function compared with all other groups. Renal clearance is the predominant mechanism for C peptide degradation, while insulin is also cleared by the liver. By examining the residuals of C peptide versus severity of DR, we found, in contrast to the uncorrected values, that the residuals did not increase with the PDR group. Thus, this inverse relationship (i.e, worsening of DR with decreasing C peptide) is made more apparent with examination of the residuals, and reinforces the importance of insulin secretion, and beta-cell function, in DR severity. We therefore speculate that the discrepant results in previous studies, all of which only reported C peptide/DR relationships without insulin, may be due to the complexity of using C peptide as a marker of beta-cell function in the presence of kidney disease, as illustrated here.
The significance of the relationship between residual insulin secretion and DR in type 2 diabetes lies in ongoing attempts to prevent DR and its progression. If tight glycemic control is necessary but not sufficient to prevent DR, then other therapeutic approaches are necessary. Our previous observation that inflammation, possibly associated with insulin resistance, may play a role in DR supports the idea that these may be targets of therapeutic intervention.6 Similarly, our findings in this study suggest that in addition to glycemic control, maintenance of beta-cell function or beta-cell mass in type 2 diabetes may also be justified as a therapeutic goal and warrants further investigation.
Strength and limitations of the study
The strength of the present study includes a large cohort of Latinos with type 2 diabetes and well-characterized phenotypes, including a standardized DR grading system using the Modified Airlie House Classification and the ETDRS scale. All prior studies that evaluated insulin secretion in DR did not use, or only partly used, seven-field photography, the gold standard for evaluation of DR.25 Many were much smaller studies. A few limitations of this study should also be addressed. First, the cross-sectional nature of the study design cannot indicate a causal relationship between the investigated biomarkers and severity of DR. Second, using GEE1 needed to adjust for family relationship is a less powerful approach compared with a standard case–control analysis. Third, the clinic-based cohort and its selection may not reflect general characteristics of the Latino population. Finally, using stimulated C peptide may be a better measurement of residual insulin secretion and thus beta-cell function than basal C peptide. However, this approach is less feasible in larger studies.
Conclusions
In summary, we found that insulin and C peptide levels are significantly associated with severity of DR in Latinos with type 2 diabetes after adjusting for potential covariates. Further study is necessary to determine whether maintenance of endogenous insulin secretion will protect against the development of DR in type 2 diabetes as is known in persons with type 1.
References
Footnotes
-
Contributors All authors made substantial contributions to the concept and design of this study, acquisition of data or analysis and interpretation of data and to drafting of the article and revised it critically for intellectual content. All authors gave final approval of the version to be published and agreement to be accountable for all aspects of the work related to accuracy or integrity of the work are appropriately investigated and resolved.
-
Funding This study was supported by the National Institutes of Health (EY014684) and ARRA Supplement (EY014684-03S1, −04S1), the National Institute of Diabetes and Digestive and Kidney Disease Diabetes Research Center (DRC) grant DK063491 to the Southern California Diabetes Endocrinology Research Center, the Eye Birth Defects Foundation, and an unrestricted grant to the UCSD Department of Ophthalmology from Research to Prevent Blindness, New York, NY. The Clinical and Translational Science Institute (CTSI) was supported by the National Center for Advancing Translational Sciences, CTSI grant UL1TR000124.
-
Competing interests None.
-
Ethics approval Los Angeles Biomedical Research Institute IRB.
-
Provenance and peer review Not commissioned; externally peer reviewed.
-
Data sharing statement No additional data are available.