Article Text

Abstract
Background The transcription factor 7-like 2 (TCF7L2) locus is strongly implicated in the pathogenesis of type 2 diabetes (T2D). We previously mapped the genomic regions bound by TCF7L2 using ChIP (chromatin immunoprecipitation)-seq in the colorectal carcinoma cell line, HCT116, revealing an unexpected highly significant over-representation of genome-wide association studies (GWAS) loci associated primarily with endocrine (in particular T2D) and cardiovascular traits.
Methods In order to further explore if this observed phenomenon occurs in other cell lines, we carried out ChIP-seq in HepG2 cells and leveraged ENCODE data for five additional cell lines. Given that only a minority of the predicted genetic component to most complex traits has been identified to date, plus our GWAS-related observations with respect to TCF7L2 occupancy, we investigated if restricting association analyses to the genes yielded from this approach, in order to reduce the constraints of multiple testing, could reveal novel T2D loci.
Results We found strong evidence for the continued enrichment of endocrine and cardiovascular GWAS categories, with additional support for cancer. When investigating all the known GWAS loci bound by TCF7L2 in the shortest gene list, derived from HCT116, the coronary artery disease-associated variant, rs46522 at the UBE2Z-GIP-ATP5G1-SNF8 locus, yielded significant association with T2D within DIAGRAM. Furthermore, when we analyzed tag-SNPs (single nucleotide polymorphisms) in genes not previously implicated by GWAS but bound by TCF7L2 within 5 kb, we observed a significant association of rs4780476 within CPPED1 in DIAGRAM.
Conclusions ChIP-seq data generated with this GWAS-implicated transcription factor provided a biologically plausible method to limit multiple testing in the assessment of genome-wide genotyping data to uncover two novel T2D-associated loci.
- Genetic Association
- Type 2
- Transcription Factor
- Gene
This is an Open Access article distributed in accordance with the Creative Commons Attribution Non Commercial (CC BY-NC 4.0) license, which permits others to distribute, remix, adapt, build upon this work non-commercially, and license their derivative works on different terms, provided the original work is properly cited and the use is non-commercial. See: http://creativecommons.org/licenses/by-nc/4.0/
Statistics from Altmetric.com
Key messages
-
Across multiple data sets derived from various cell lines, there is consistent evidence of a highly significant over-representation of genome-wide association study (GWAS)-implicated loci within the list of genes harboring a transcription factor 7-like 2 (TCF7L2) occupancy site.
-
Given this TCF7L2 genome-wide occupancy behavior, we observe that through cross-referencing GWAS-derived statistics with specific ChIP (chromatin immunoprecipitation)-seq data, one can facilitate biologically plausible limitations to multiple testing and thus aid gene discovery efforts.
-
We reveal UBE2Z-GIP-ATP5G1-SNF8 and CPPED1 as novel type 2 diabetes loci using this approach.
Introduction
The repertoire of genes already established to play a role in the pathogenesis of type 2 diabetes (T2D) has grown substantially as a consequence of results from recent genome-wide association studies (GWAS). One of the strongest T2D associations to date, based on risk conferred, is with variation within the transcription factor 7-like 2 (TCF7L2) gene.1–6 Indeed, the common intronic variant at this locus is strongly associated with the disease in all major racial groups.7
In order to better understand the functional role of TCF7L2, we previously performed a ChIP (chromatin immunoprecipitation)-seq experiment with this transcription factor to elucidate its binding repertoire genome wide.8 ,9 This approach performed well with the human colorectal carcinoma cell line, HCT116, where the TCF7L2 protein is abundantly expressed. Unexpectedly, and despite employing a carcinoma cell line, our initial data suggested that the gene list corresponding to TCF7L2 occupancy sites was strongly enriched for pathway categories related to metabolic-related functions and traits.
To our surprise, we also observed a highly significant over-representation of GWAS-implicated loci within the list of genes harboring a TCF7L2 occupancy site; indeed, the primary GWAS categories enriched were for endocrine, in particular T2D, and cardiovascular traits. Our observations are supported by the recent report that classically defined transcription factors operating in the β-cell cluster around variants reported in GWAS.10
As only a minority of the predicted genetic component to most complex traits has been identified to date, termed the ‘missing heritability’,11 there is potential for using knowledge of TCF7L2 occupancy to aid further gene discovery for T2D. The rationale behind this is that if one restricted association analyses to just the genes occupied by TCF7L2, one could limit the extent of correction for multiple testing that typically blights GWAS analyses.
In order to elucidate this possibility, we first elected to expand on our initial findings to investigate if this intriguing pattern holds across multiple cell lines, using the algorithm HOMER (Hypergeometric Optimization of Motif EnRichment); indeed, we have already reported our use of this program when analyzing ChIP-seq data for other GWAS-implicated transcription factors, namely MEF2C12 and FOXA2.13 To that end, we meshed our in-house-derived ChIP-seq data sets, both for HCT116 and HepG2, with those made available by the ENCODE project.14 In addition to analyzing these data sets separately to further investigate possible GWAS locus enrichment, we postulated that many novel genes on the TCF7L2 target list could be relevant to T2D; as such, we analyzed the shortest ChIP-seq-derived gene list, generated in HCT116, in the context of GWAS data itself to investigate if novel T2D loci could be revealed when restricting testing to just the loci derived from this approach.
Methods
Cell culture and reagent
The HepG2 hepatocarcinoma cell line was purchased from the American Type Cell Center (ATCC, Manassas, Virginia, USA). Cells were cultured at 37°C, 95% humidity, and supplied with 5% CO2 in ATCC-formulated Eagle's Minimum Essential Medium supplemented with 10% fetal bovine serum (Sigma, St. Louis, Missouri, USA), 2 mM l-glutamine (Gibco Invitrogen, Carlsbad, California, USA), 100 units/mL penicillin/100 μg/mL streptomycin (Cellgro, Manassas, Virginia, USA). On the basis of previous papers outlining TCF7L2 isoforms,15–17 we chose from antibodies that were raised to antigen at the most constant region among TCF7L2 isoforms, that is, the amino acids encoded by exons 1–3 (Cat.05-511; Millipore, Billerica, Massachusetts, USA) as described previously.8
Chromatin Immunoprecipitation
ChIP was performed in triplicate following the instructions provided by the suppliers of the EZ-ChIP kit (Cat.17-371; Millipore, Billerica, Massachusetts, USA) and as described previously.18 Cells were sonicated on ice for 12 cycles of 15 s on and 45 s off at setting 3 (2100XL ultrasonic liquid processors, Misonix, Farmingdale, New York, USA). Sonicated chromatin was primarily in the 100–500 bp range, averaging 200–300 bp.
After overlaying all reads from two independent experiments for HepG2, a total of 3810 binding sites were observed at a false discovery rate of 1%, cumulative Poisson p value of 0.0001, and fold coverage threshold of four times normalized sequence tags in the target experiment comparable with random background sequence tags using the HOMER19 analysis package. The TCF7L2 ChIP signal was clearly distinct from the pseudo-ChIP signal as identified by GLITR18 (online supplementary figure S1). In addition, we chose 17 sites with a variable binding score for validation purposes by real-time PCR, all of which showed clear evidence of enrichment (online supplementary figure S2 and table S1).
Sequencing
The sequencing library was prepared as per Illumina's instructions (http://www.illumina.com, San Diego, California, USA). Sequencing on the Illumina Genome Analyzer and subsequent analyses were performed at the Functional Genomics Core at the University of Pennsylvania.
DNA libraries were assessed for size, purity, and quantity using an Agilent 2100 Bioanalyzer (Agilent Technologies, Santa Clara, California, USA), followed by sequencing using an Illumina GA-II according to the manufacturer's instructions, and have been described previously.8 The ENCODE ChIP-seq ((HepG2, HeLa-S3 (×2), HEK293, MCF7, and PANC1) and input raw sequence files were downloaded from the UCSC database (http://genome.ucsc.edu/ENCODE/dataMatrix/encodeChipMatrixHuman.html). HOMER19 was utilized to determine TCF7L2 binding sites and their association with RefSeq transcripts aligned to hg19 was downloaded from UCSC via HOMER. The candidate target gene was the closest gene regardless of the direction from the binding site. In all cases, the transcription start site of the aligned transcript was used as the anchor point for distance measurements.
TCF7L2 ChIP-seq in ENCODE
We processed the ENCODE TCF7L2 ChIP-seq data for the HepG2, HeLa-S3, HEK293, MCF7, and PANC1 cell lines14 and also reanalyzed our HCT116 data,8 using HOMER.
We observed a wide range in the occupancy site number, location, and nearest unique gene. HCT116 was found to harbor the lowest number of binding sites (n=865) and corresponding genes (n=750). ENCODE's HeLa-S3 (exons 1–3) revealed the highest number of binding sites (n=11 817) and corresponding genes (n=6451; online supplementary table S2).
We elected to reanalyze all of ENCODE's and our own generated TCF7L2 ChIP-seq data with the same HOMER peak parameters described above to eliminate any threshold effects that would be caused by comparing the occupancy sites between different peak finding programs and threshold parameter settings. The number of placed sequence reads for all eight ChIP-seq experiments varied from a low of 18 139 284 to a high of 57 938 025 (online supplementary table S3).
Pathway analysis
Data were analyzed through the use of Ingenuity Pathways Analysis (Ingenuity Systems, http://www.ingenuity.com, Redwood City, California, USA) specified for ‘Human’. The genes that corresponded to at least one function or pathway annotation in the Ingenuity Knowledge Base were eligible for the analysis. The p value associated with functions and pathways was calculated using the right-tailed Fisher exact test.
GWAS category analyses
We based our analysis on all GWAS genes summarized in a freeze of the National Human Genome Research Institute (NHGRI) GWAS catalog (http://www.genome.gov/gwastudies) from 19 February 2013. Enrichment was investigated using a χ2 analysis. Our method of scoring overlapping GWAS-implicated genes detected in the ChIP-seq data was to assign 1 point to a GWAS region where all the genes in the region were found in our list and a fraction of a point determine by how many genes where found in our gene list divide by the total genes in the GWAS region. For instance, this analysis model would give a GWAS region with 1 gene the same weight as a region harboring 8 genes.
Association analyses
We derived the list of genes bound by TCF7L2 within 5 kb of the transcription start site in the HCT116 cell line, as it yielded the smallest number of binding sites and thus the smallest list of corresponding genes. First, we derived the list of single nucleotide polymorphisms (SNPs) at GWAS-implicated loci on this gene list (n=40). Furthermore, we aimed to look at the remainder of the gene list, the members of which had not been previously implicated by GWAS, and in order to minimize multiple testing we elucidated which tag-SNPs represented on the basic Illumina Human Hap 550 BeadChip resided with our genes of interest (n=892). We then separately queried both lists against the publicly available GWAS meta-analysis data set generated by DIAGRAM (http://diagram-consortium.org/downloads.html)20 to determine if any variants would yield a p value lower than the Bonferroni-corrected p value for the respective test, where the threshold for significance for the previously reported GWAS loci test was set at 1.25×10⁻³ and for the non-GWAS-implicated loci test it was set at 5.61×10⁻⁵.
Results
ChIP-seq data appraisal
To extend our previous genomic occupancy analyses for TCF7L2 in HCT116 cells,8 we performed ChIP-seq in the human heptocarcinoma cell line, HepG2, to map DNA sequences bound by TCF7L2. Utilizing HOMER, the distribution of the binding sites was 1555 intronic, 1920 intergenic, and the remaining 335 in various other genic regions (online supplementary figure S3). We also processed similarly with HOMER TCF7L2 ChIP-seq data for the HepG2, HeLa-S3, HEK293, MCF7, and PANC1 cell lines from ENCODE,14 plus our previously generated HCT116-derived data.8
We went on to employ the de novo motif discovery algorithm, also within HOMER, to derive the consensus binding site for these other seven ChIP-seq data sets compared with the consensus motif derived from our HCT116 ChIP-seq data and from previous work by others.21 A similar 12 bp consensus was found in 24–53% of all binding sites (online supplementary figure S4). The majority of occupancy (>93%) fell within 5–500 kb of a RefSeq gene transcription start site in the remaining seven ChIP-seq data sets analyzed (online supplementary table S4).
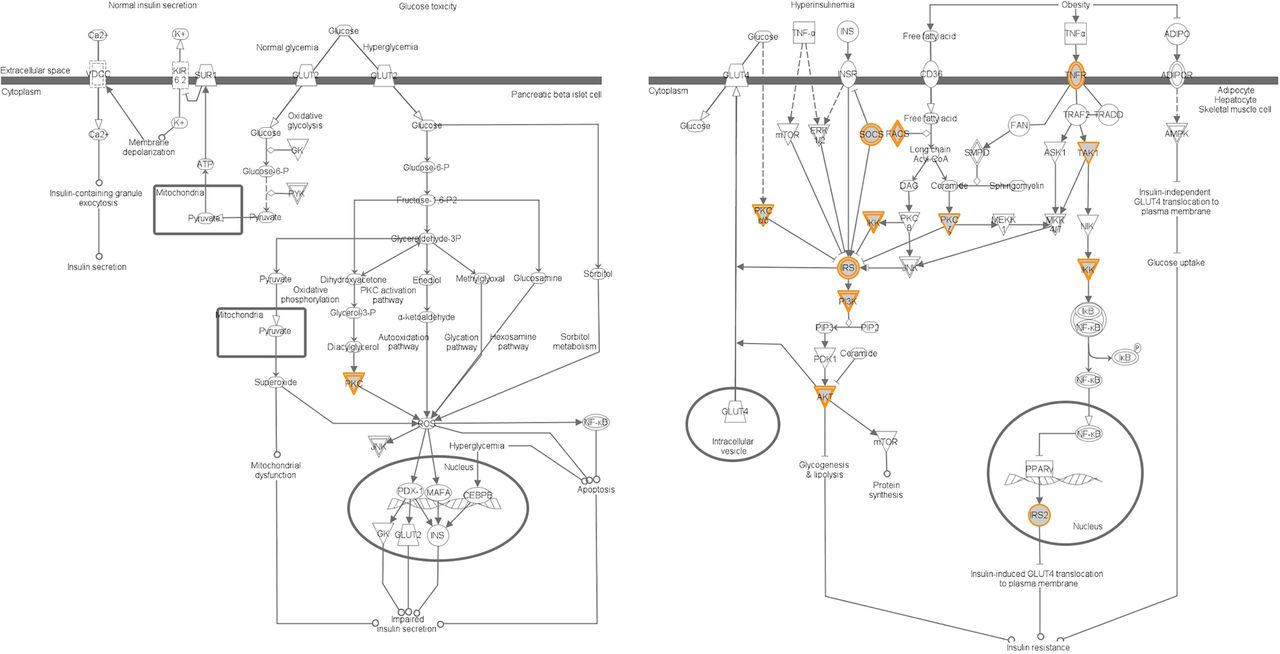
We went on to perform pathway analyses for each of the eight ChIP-seq-derived gene sets. In HCT116, we observed pathways related to ‘Factors Promoting Cardiogenesis in Vertebrates’, ‘Type II Diabetes Mellitus Signaling’, and ‘NF-κB Activation by Viruses,’ respectively, making them the most significant annotations and readily surviving correction for multiple comparisons (see all categories that achieved a nominal p<0.05 in online supplementary table S5).We also observed that HeLaS3 (exons 1–3), HeLaS3 (exons 4–16), MCF7, and PANC1 yielded significant enrichment, following adjustment for multiple comparisons (uncorrected p value: 4.47×10⁻⁶, 9.12×10⁻⁶, 5.62×10⁻⁴, and 9.33×10⁻⁴) for genes in the ‘Type II Diabetes Mellitus Signaling’ category from the top 20 canonical pathway analyses (see all categories that achieved a nominal p<0.05 in online supplementary tables S6–S9). We observed consistent under-representation of members of the β-cell-related pathway in the ‘Type II Diabetes Mellitus Signaling’ category and over-representation of binding in other tissues within the same category across these data sets (see figure 1 for representative image derived from HCT116 in-house data).

TCF7L2 ChIP-seq in HCT116 cells. The orange color genes in the ‘Type II Diabetes Mellitus Signaling’ pathway represents TCF7L2 binding sites candidate target genes that were the closest gene transcription start site to TCF7L2 binding sites regardless of the direction from the binding site. Data were analyzed through the use of Ingenuity Pathways Analysis (Ingenuity Systems, http://www.ingenuity.com, Redwood) City, California, USA) specified for ‘Human’. The genes that contain at least one function or pathway annotation in the Ingenuity Knowledge Base were eligible for the analysis. ChIP, chromatin immunoprecipitation; TCF7L2, transcription factor 7-like 2; VDCC, voltage-dependent calcium channels; JNK, Jun N-terminal kinases; ROS, reactive oxygen species; PKC, protein kinase C; NF-κB, nuclear factor-κB; SUR, sulfonylurea receptor; TNFα, tumor necrosis factor α; INS, insulin; INSR, INS receptor; TRAF2, TNF receptor-associated factor 2; mTOR, mechanistic target of rapamycin; SMPD, sphingomyelin phosphodiesterases; DAG, diacylglycerol; PPAR, peroxisome proliferator-activated receptors; GK, glucokinase; PYK, pyruvate kinase; GLUT, glucose transporter; ADIPOR, adiponectin receptor.
Three of the data sets, two derived from the liver and one from the kidney, that is, two HepG2 and one HEK293, did not yield a significant enrichment of genes in the ‘Type II Diabetes Mellitus Signaling’ category from the canonical pathway analyses (see all categories that reached a nominal p<0.05 in online supplementary tables S10–S12).
In addition, our pathway analysis also determined consistent and significant enrichment of genes in the ‘Wnt/β-catenin Signaling’, ‘Molecular Mechanisms of Cancer’, and ‘Factors Promoting Cardiogenesis in Vertebrates’ categories from the top 20 canonical pathway analyses in all eight of the cell lines (see all categories that achieve an adjusted p<0.05 in online supplementary tables S5–S12).
GWAS category enrichment
Given that original HCT116 study suggested TCF7L2 occupancy was found more often at GWAS loci than expected by chance,8 as did our work with MEF2C12 and FOXA2,13 we were motivated to query the results for each data set in turn against all GWAS signals reported, as derived from the NHGRI GWAS catalog.
Of the 2435 nearest genes with a TCF7L2 binding site in our in-house HepG2-generated data set, representing 12.8% of all RefSeq genes used in the overall analysis (n=19 015), there was a highly significant over-representation of loci implicated in disease susceptibility by GWAS (629.71 of 3607 (17.5%) loci; p=1.09×10⁻¹⁰; table 1). This observation was primarily driven by excess loci revealed from GWAS of endocrine (p=6.18×10⁻¹⁰), cardiovascular (p=9.30×10⁻¹⁰), and cancer (p=1.04×10⁻⁶) traits; specifically, T2D also showed an enrichment (p=8.80×10⁻³). In contrast, we observed only marginal or no significant enrichment of GWAS signals for neurological or inflammation-related traits.
Enrichment of GWAS signals for the nearest RefSeq genes to the TCF7L2 binding site in all eight cell lines
Expanding our GWAS signal analyses to the data derived from the other six cell lines (HeLaS3 (exons 1–3), HeLaS3 (exons 4–16), MCF7, PANC1, HCT116, HEK293, and HepG2 (ENCODE)), we determined that there was also highly significant over-representation of GWAS loci for TCF7L2 targets in all seven cell lines (table 1). As seen in HepG2 (in-house), this observation was again primarily driven by excess loci from GWAS of endocrine, cardiovascular, and cancer traits. As demonstrated in HepG2 (in-house), T2D GWAS-implicated loci specifically are also generally enriched, although not statistically significant due to the relatively small list of GWAS-implicated T2D genes being queried. Neurological and inflammation-related GWAS signals were largely consistently shown to have marginal or no enrichment in the seven ChIP-seq data sets, comparable with what was seen in HepG2 (in-house; table 1).
To contrast with control data sets, we also generated a random list of 5000 genes from the 19 015 RefSeq genes used by HOMER to determine the nearest gene lists described above to ascertain if there was a bias of our data analysis. The randomly generated gene list showed no significant over-representation of GWAS genes in the random gene set; in fact, it showed a trend of under-representation of GWAS genes in the random HOMER gene set, primarily due to the fact that some gene names in the NHGRI GWAS catalog are not RefSeq annotations (online supplementary table S13).
Cross comparisons with genome-wide meta-analysis summary data
Given that only a minority of the predicted genetic component to most complex traits has been identified to date, plus the fact that our GWAS-implicated transcription factor of interest shows consistent statistically significant preferential binding to loci associated with complex traits, we investigated if restricting association analyses to just the genes uncovered from our ChIP-seq approach in order to reduce multiple testing could yield novel loci associated with T2D. When investigating all the known GWAS loci bound within 5 kb by TCF7L2 (most likely to be functional) in the shortest gene list in order to minimize multiple testing, derived from HCT116, apart from the known TCF7L2 locus itself (rs7901695), the coronary artery disease-associated variant, the T allele of rs46522 within the UBE2Z-GIP-ATP5G1-SNF8 locus, yielded significant and novel DIAGRAM-derived association with T2D risk (OR=1.07; p=3.20×10⁻⁴) (table 2); indeed, the occupancy site was ∼4 kb from the transcription start site for GIP in an intergenic region known to be a hub for binding proteins, H3K27Ac histone marks and open chromatin via a DNase I hypersensitive site. Furthermore, when we analyzed Illumina Human Hap 550 tag-SNPs within genes not previously implicated by GWAS but bound within 5 kb by TCF7L2 in HCT116, again due to the fact that it was the shortest gene list, we observed significant association within the DIAGRAM data set of the A allele of rs4780476 within the gene encoding calcineurin-like phosphoesterase domain-containing protein 1 (CPPED1) with T2D risk (OR=1.1, p=4.10×10⁻⁵; table 2). Furthermore, the TCF7L2 occupancy site was in the immediate CPPED1 promoter region.
DIAGRAM-derived association results for type 2 diabetes with respect to the loci on interest
Discussion
Given that only a minority of the predicted genetic component to most complex traits has been identified to date, plus the fact that this GWAS-implicated transcription factor shows preferential binding to genes genetically associated with complex traits, we investigated if restricting association analyses to the genes yielded from our ChIP-seq approach in order to reduce multiple testing could yield novel loci associated with T2D. Indeed, we found that of the known GWAS loci for any trait bound by TCF7L2 within 5 kb in HCT116, the coronary artery disease-associated variant, rs46522, within the UBE2Z-GIP-ATP5G1-SNF8 locus22 yielded association that survived correction for multiple testing. Interestingly, rs46522 is in strong LD with two potential functional variants in the biologically plausible gene encoding gastric inhibitory polypeptide (GIP): p.Ser103Gly (rs2291725) and variant influencing the splice site of intron 3 (rs2291726) leading to a truncated transcript.22 This is particularly notable as this observation implicates a variant playing a role in T2D after being found originally in another GWAS category, i.e. cardiovascular. It has long been thought that TCF7L2 may confer its T2D effect via incretins,1 of which GIP is one, thus furthering the case for this line of investigation; indeed, the locus encoding the receptor for GIP (GIPR) has already been reported in relevant GWAS settings to be associated with body mass index23–25 and to influence the glucose and insulin responses to an oral glucose challenge.26
Furthermore, when considering the non-GWAS-implicated loci bound by TCF7L2 within 5 kb in HCT116, we observed significant association with rs4780476 within CPPED1. This is an equally interesting observation, as only two papers have been published to date on this gene product, with one showing that downregulation of CPPED1 expression improves glucose metabolism in vitro in adipocytes27 and another implicating it in syndromic obesity using array comparative genomic hybridization.28
The challenge of the increasing level of genetic data being generated in population-based cohorts, such as imputed genome-wide genotypes, exome and whole-genome data, is how one can derive true positive signals from the large amount of data, where the required stringent corrections for multiple testing at the genome level can easily miss true signals. Indeed, there have been great efforts to rationalize restricted testing to plausible regions of the genome to address a particular complex trait, most typically by leveraging previously reported linkage signals. However, linkage regions are often broad in terms of genomic regions covered and are therefore fraught with imprecision. Our limitation of multiple testing is based on biological plausibility, where a GWAS-implicated transcription factor is clearly pointing us to genes that are genetically associated with complex disease more often than expected by chance and thus may also be pointing us to novel genes where their strength of the association was at the level of noise at the genome-wide scale.
We carried out the meshing of GWAS-derived data with a ChIP-seq-derived gene list for a GWAS-implicated transcription factor in one of our cell lines. The rationale was that as all cell lines exhibited the same GWAS category enrichment characteristic, we would aim to carry out this investigation by narrowing the field as much as possible. As such, we elected to only leverage the gene names derived from the cell line that yielded the shortest gene list, namely HCT116. We also added the extra constraint of the site being within 5 kb of the nearest gene, as this made them the most biologically plausible, and thus limiting our testing further. We also limited our testing by only considering tag-SNPs used on a conventional genotyping array. Of course, we recognize that these cut-offs are completely arbitrary and that further testing with additional genotype and phenotype (we only considered T2D due to the obvious TCF7L2 connection) data sets should be the subject of subsequent studies to refine this data-mining approach.
In conclusion, our study has further characterized loci bound by TCF7L2, which has in turn reinforced our previous observation that TCF7L2 has a statistically significant preference to occupy loci previously implicated by GWAS. By cross-referencing the loci at these occupancy sites with GWAS results in order to restrict correction for multiple testing, UBE2Z-GIP-ATP5G1-SNF8 and CPPED1 have been uncovered as T2D-associated loci. This approach has potential utility for the discovery process of novel therapeutic targets for diabetes and related traits in the future.
References
Supplementary materials
Supplementary Data
This web only file has been produced by the BMJ Publishing Group from an electronic file supplied by the author(s) and has not been edited for content.
Files in this Data Supplement:
- Data supplement 1 - Online figures
- Data supplement 2 - Online tables
Footnotes
MEJ and JZ contributed equally.
-
Contributors JZ, JS, SD, QX, VCG, KHK, ADW, and SFAG generated the data; MEJ, JS, KHK, ADW, and SFAG analyzed the data; and MEJ, JZ, SD, QX, VCG, JS, KHK, ADW, and SFAG reviewed the manuscript and contributed to the writing.
-
Funding This work was supported by NIH grant number P30 DK 19525. This work was supported by Institutional Development Funds and the Ethel Brown Foerderer Fund for Excellence from the Children's Hospital of Philadelphia.
-
Competing interests None.
-
Provenance and peer review Not commissioned; externally peer reviewed.
-
Data sharing statement All sequence reads from the ChIP-seq data sets generated at the Children's Hospital of Philadelphia and the University of Pennsylvania are available on request.