Article Text

Abstract
Objective We assessed the relationship of mortality with glycated hemoglobin (HbA1c) variability and with absolute change in HbA1c.
Design A population-based prospective observational study with a median follow-up time of 6 years.
Methods Based on a validated algorithm, 11 205 Danish individuals with type 2 diabetes during 2001–2006 were identified from public data files, with at least three HbA1c measurements: one index measure, one closing measure 22–26 months later, and one measurement in-between. Medium index HbA1c was 7.3%, median age was 63.9 years, and 48% were women. HbA1c variability was defined as the mean absolute residual around the line connecting index value with closing value. Cox proportional hazard models with restricted cubic splines were used, with all-cause mortality as the outcome.
Results Variability between 0 and 0.5 HbA1c percentage point was not associated with mortality, but for index HbA1c ≤8% (64 mmol/mol), a variability above 0.5 was associated with increased mortality (HR of 1 HbA1c percentage point variability was 1.3 (95% CI 1.1 to 1.5) for index HbA1c 6.6–7.4%). For index HbA1c≤8%, mortality increased when HbA1c declined, but was stable when HbA1c rose. For index HbA1c>8%, change in HbA1c was associated with mortality, with the lowest mortality for greatest decline (HR=0.9 (95% CI 0.80 to 0.98) for a 2-percentage point decrease).
Conclusions For individuals with an index HbA1c below 8%, both high HbA1c variability and a decline in HbA1c were associated with increased mortality. For individuals with index HbA1c above 8%, change in HbA1c was associated with mortality, whereas variability was not.
- HbA1c
- Type 2 Diabetes
- Mortality
- Change
This is an Open Access article distributed in accordance with the Creative Commons Attribution Non Commercial (CC BY-NC 4.0) license, which permits others to distribute, remix, adapt, build upon this work non-commercially, and license their derivative works on different terms, provided the original work is properly cited and the use is non-commercial. See: http://creativecommons.org/licenses/by-nc/4.0/
Statistics from Altmetric.com
Key messages
A widely used criterion for optimizing diabetes care is to aim at reducing the glycated hemoglobin (HbA1c) level below a given limit, but the evidence is scarce on how variability in HbA1c or absolute changes in the individual HbA1c level affect mortality.
In this study, both high HbA1c variability and a decline in HbA1c were identified as risk factors for death among persons with an index HbA1c below 8%. For individuals with an index HbA1c above 8%, change in HbA1c was associated with mortality, whereas variability was not.
The results suggest prevention of complications by more individualized treatment, presumably by aiming at reducing HbA1c variability for individuals with HbA1c ≤8%. However, as only two studies have previously addressed variability in HbA1c and mortality in type 2 diabetes and as our study is an observational study, the findings should be replicated.
Introduction
As the prevalence of type 2 diabetes continues to increase worldwide,1–4 diabetes-related morbidity and mortality increase as well. A widely used criterion for optimizing diabetes care is to aim at reducing the HbA1c level below a given limit.5 However, since publication of the Action to Control Cardiovascular Risk in Diabetes (ACCORD) study, which revealed hazardous effects of intensive therapy to target HbA1c levels,6 the appropriateness of universal glycemic targets for people with type 2 diabetes has been discussed with increasing controversy.
In type 1 diabetes, it has been suggested that HbA1c variability, in addition to the HbA1c level, is an independent risk factor for development of diabetic complications.7–9 In people with type 2 diabetes, high, and possibly also low, levels of HbA1c might be associated with increased mortality;10–12 recent studies found the development of microalbuminuria, progression of nephropathy, and incidence of cardiovascular disease related to HbA1c variability independent of the mean HbA1c level,13–17 whereas a Korean study concluded that HbA1c variability, in addition to the mean HbA1c level, was not an independent predictor of intima-media thickness,18 and a cross-sectional analysis of the Renal Insufficiency and Cardiovascular Events (RIACE) Italian Multicentre Study showed no impact of HbA1c variability on macrovascular complications.19 Moreover, among people with type 2 diabetes, population-based evidence is scarce with respect to associations between absolute changes in the individual HbA1c level and mortality, and as far as we know, only two studies exist with respect to HbA1c variability and mortality, revealing SD, CV, and Visit-to-Visit variability of HbA1c measurements assessed every 2–4 months to be independently associated with all-cause mortality.20 ,21 Therefore, we have investigated mortality and its relation to both HbA1c variability and absolute change in HbA1c in a large population-based observational study among Danish individuals with type 2 diabetes. We thereby aim to refine the ability to identify the individual prognosis for people with type 2 diabetes.
Methods
Study design
The administrative unit Aarhus County, Denmark, existing from 1970 until 2007, had a population of approximately 650 000 persons, corresponding to 12% of the Danish population. The present study is based on this background population. Individuals with type 2 diabetes were identified from public data files in Aarhus County, Denmark, with a dedicated and validated algorithm. This algorithm is described in detail elsewhere,22 ,23 but briefly it is designed to identify people with type 2 diabetes in Aarhus County, Denmark, has a sensitivity of 96% and a positive predictive value of 89%, and includes information on age, sex, laboratory results, and redeemed prescriptions. This algorithm is unique in Denmark due to the population-based setting with inclusion of laboratory results, unlike the population-based Danish National Diabetes Registry, which was established in 2006, where laboratory results are lacking. In this study, we identified individuals who were registered with type 2 diabetes either by December 31, 2001, 2002, 2003, 2004, 2005, or 2006, and who subsequently had at least three HbA1c measurements as follows: one index measure in the same year as they were registered as having type 2 diabetes, one closing measure 22–26 months after the index measure, and at least one measurement in-between. HbA1c measurements were analyzed at four different laboratories with standardized analyses and a coefficient of variation of 2.3%. Each general practitioner (GP; and clinical department) has an agreement with one specific laboratory (out of the four) as to why measurements for a single person most likely have been analyzed at the same laboratory. A total of 25 490 individuals were identified with type 2 diabetes. Of those, 22 466 had an HbA1c measurement in the same year as they were registered in the database, 11 487 had HbA1c measurements 22–26 months after the first measurement, and 11 205 had at least one HbA1c measurement in-between. These 11 205 individuals form the present study population.
Disease diagnoses included in Charlson's comorbidity index24 were obtained from record linkage with the Danish National Patient Register,25 ,26 which covers all hospitalizations and outpatient visits in Denmark. Information on mortality and individual migration history was obtained by record linkage with the nationwide Danish Civil Registration System,27 where all persons living in Denmark are registered for administrative purposes, using the national Civil Registration Number as the unique person identifier across registries. For all events, dates were available.
Statistical analysis
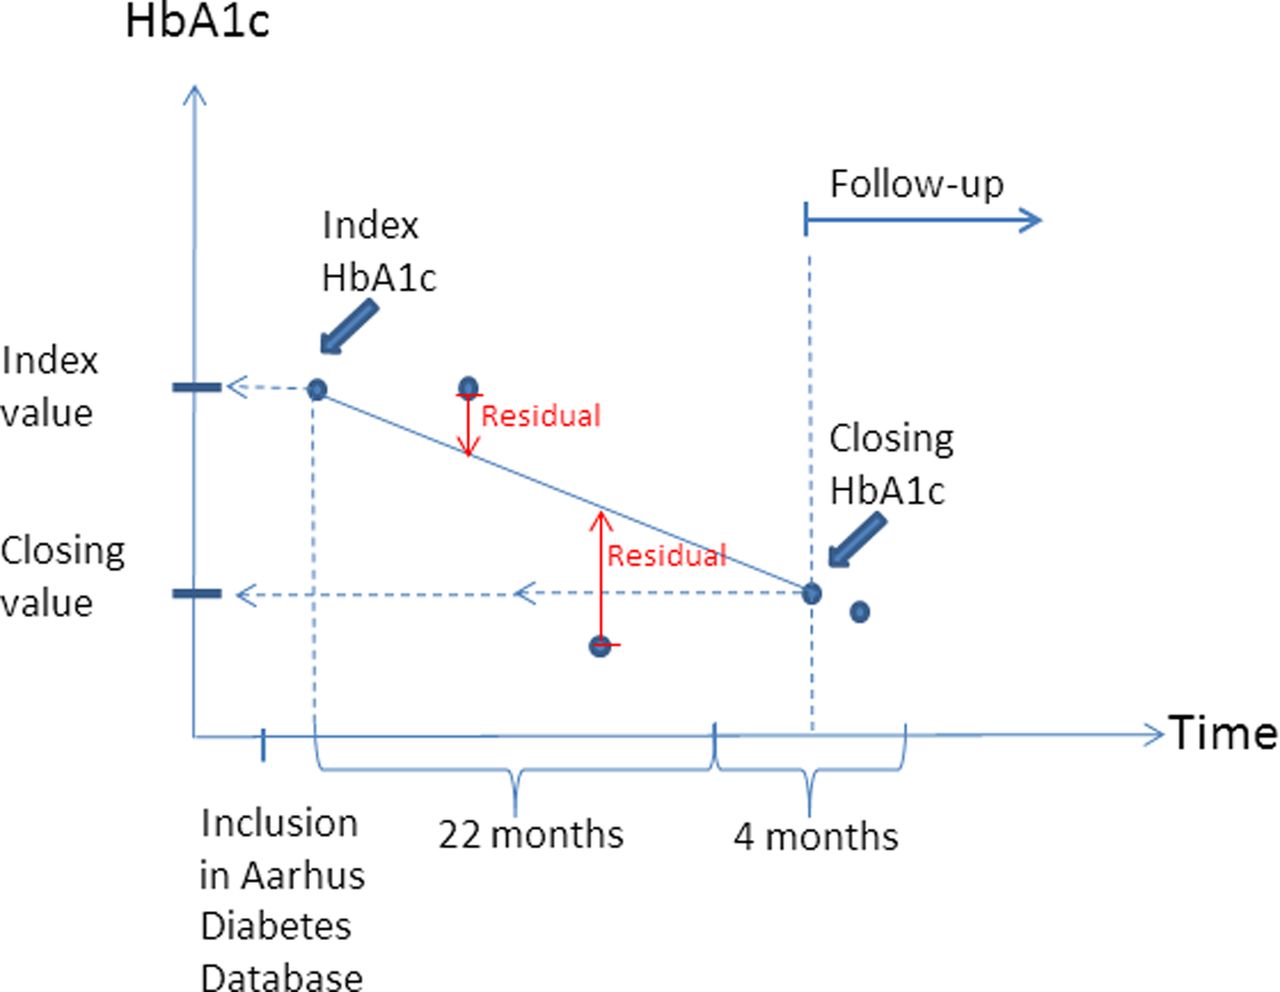
The first registered HbA1c measurement was used as index value, and the measurement within 22–26 months after the first measurement was used as closing HbA1c. If one individual had more than one measurement 22–26 months after the first measurement, the first registered measurement in the timespan was used. HbA1c variability was defined as the mean absolute residual of HbA1c measurements to the line connecting index HbA1c with closing HbA1c. Figure 1 illustrates how index HbA1c, closing HbA1c, and residual and follow-up time were defined for a single person. Absolute change in HbA1c was defined as the difference between closing HbA1c and index HbA1c. Prior cardiovascular disease and number of non-cardiovascular diseases were defined on the basis of diseases included in Charlson's comorbidity index: myocardial infarction, congestive heart failure, peripheral vascular disease, and cerebrovascular disease represented prior cardiovascular disease. The number of prior non-cardiovascular diseases was the number of different diseases each individual was hospitalized with from the list: dementia, chronic pulmonary disease, connective tissue disease, ulcer disease, mild liver disease, hemiplegia, moderate to severe renal disease, diabetes with end-organ damage, any tumor, leukemia, lymphoma, moderate or severe liver disease, metastatic solid tumor, and AIDS.

An example of how index HbA1c (glycated hemoglobin), closing HbA1c, and residual and follow-up time were defined. The blue dots represent all HbA1c measurements for a single person.
As studies have shown that both low and high HbA1c values might be associated with higher mortality, a specific absolute change in HbA1c might have a different impact depending on the index value. Therefore, we stratified analyses according to index HbA1c in five groups. The five groups were chosen to reflect values used in daily clinical practice and were: ≤6% (42 mmol/mol), 6.1–6.5% (43–48 mmol/mol), 6.6–7.4% (49–57 mmol/mol), 7.5–8% (58–64 mmol/mol), and ≥8.1% (65 mmol/mol).
In order to make efficient use of within-category information by allowing for different shapes of the underlying risk function within each category, we used restricted cubic splines,28 with four knots and an a priori reference point. For HbA1c variability, the reference point was set to 0.5 HbA1c percentage points, and to null for the absolute change in HbA1c. Unadjusted survival was estimated by the Kaplan-Meier method, and Cox proportional hazard models were used to adjust for covariates. The assumption of proportional hazards was examined by testing the equality of HRs within <1 year after start of follow-up and ≥1 year after. Adjustment was made for age, sex (male, female), preventive pharmacological treatment of cardiovascular diseases (yes, no), prior cardiovascular disease (yes, no), number of non-cardiovascular diseases, and index HbA1c. Analyses addressing either HbA1c variability or absolute change in HbA1c were adjusted for the other.
Secondary analyses exploring if the association patterns were different for different strata of sex (female, male), treatment modality (no glucose-lowering treatment, oral glucose-lowering treatment, insulin), and self-reported diabetes duration (≤1, ≥6 years) were performed, and adjustment for self-reported diabetes duration was made to the primary analyses. Likewise, analyses replacing HbA1c variability defined as the absolute mean residual, with SD and with the coefficient of variation (COV), were performed.
The time since closing HbA1c measurement was used as timescale. Each person was followed until death, emigration (censoring), or August 31, 2010, whichever came first. Restricted cubic splines with knots determined by Harrell's default percentiles (5th, 35th, 65th, and 95th) were calculated using Stata V.12.1 (StataCorpLP, College Station, Texas, USA). Estimates are presented with 95% CIs.
Results
Baseline characteristics are shown in table 1. The median follow-up time per individual was 6 years, varying across index HbA1c groups, and in total 2830 individuals died during follow-up. Mean absolute residuals to the line connecting index HbA1c with closing HbA1c increased with the increasing index HbA1c level. For individuals with an index HbA1c below 6.6% (49 mmol/mol), the median absolute change in HbA1c was above 0, indicating that more than half had higher HbA1c values at closing than at index. For individuals with index HbA1c above 6.6% (49 mmol/mol), this changed to a median absolute change below 0.
Characteristics of individuals included
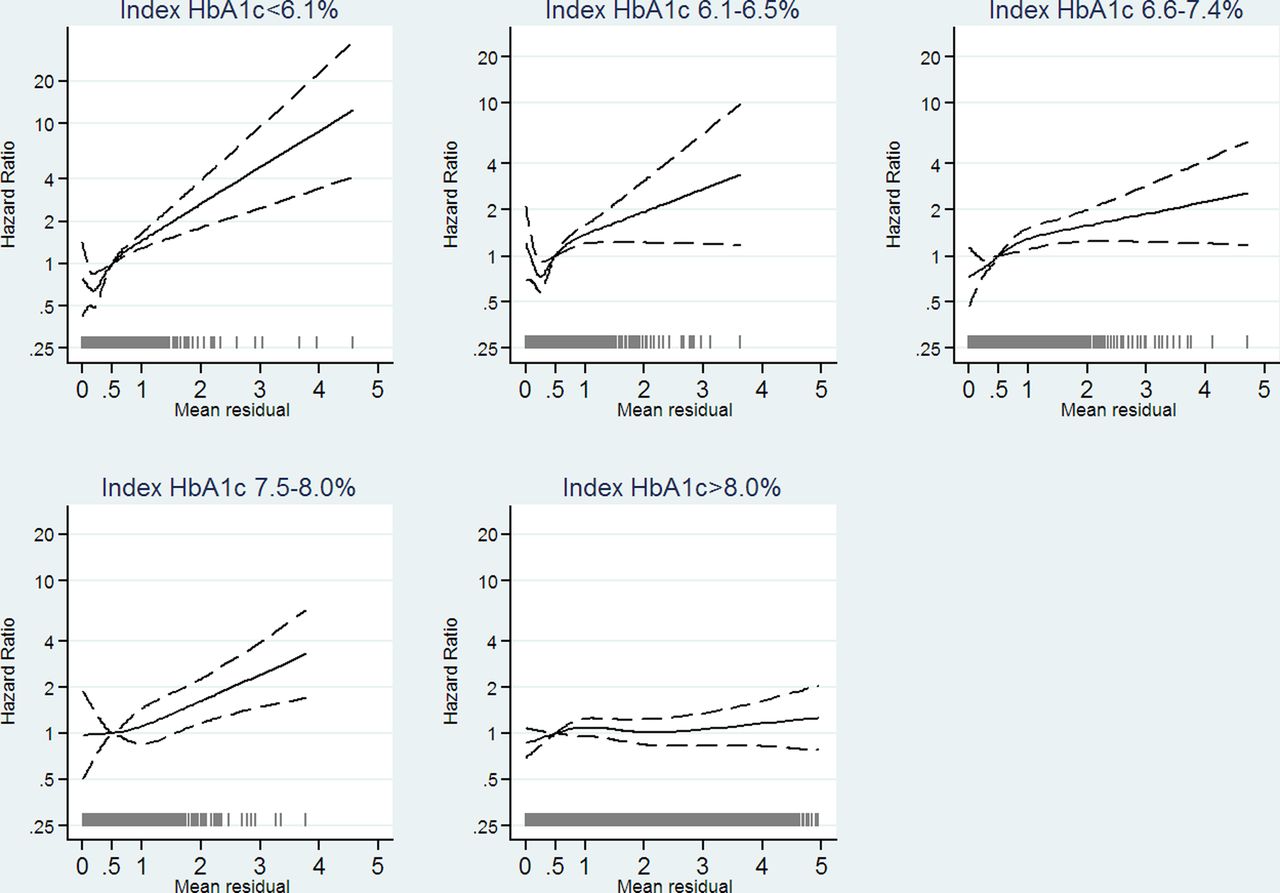
HbA1c variability between 0 HbA1c percentage point and the chosen reference point, 0.5 HbA1c percentage point, was not associated with mortality in all index HbA1c groups (figure 2), though with a tendency of lower mortality for HbA1c variability between 0.25 HbA1c percentage point and 0.5 HbA1c percentage point for those with index HbA1c≤7.4% (57 mmol/mol). HbA1c variability above 0.5 HbA1c percentage point was associated with increased mortality for individuals with index HbA1c≤8% (64 mmol/mol). For individuals with index HbA1c>8% (64 mmol/mol), no association between HbA1c variability and mortality could be identified. Figure 3 shows results from cubic splines analysis on absolute change in HbA1c. For individuals with an index HbA1c ≤8% (64 mmol/mol), mortality increased with degree of decline in HbA1c, though it was not statistically significant for individuals with index HbA1c above 6.5% (48 mmol/mol), and no statistically significant association between an increase in HbA1c and mortality was found. For individuals with index HbA1c>8% (64 mmol/mol), a tendency of a linear relationship between absolute change in HbA1c and mortality appeared, with the lowest mortality for greatest decline in HbA1c.

Estimated HR as a function of mean residual of glycated hemoglobin (HbA1c) measurements to the line connecting index HbA1c and HbA1c measurement 22–26 months after. Analysis stratified on index HbA1c in five categories. We adjusted for age, sex (male, female), preventive pharmacological treatment of cardiovascular diseases (yes, no), prior cardiovascular disease (yes, no), number of non-cardiovascular disease, index HbA1c, and absolute change in HbA1c. The solid curves indicating adjusted estimates and dashed curves indicating 95% confidence limits. The gray spikes showing the number of people with the given mean residual (N=11 205).

Estimated HR as a function of absolute change in glycated hemoglobin (HbA1c; from index to measurement 22–26 months after). Analysis stratified on index HbA1c in five categories. We adjusted for age, sex (male, female), preventive pharmacological treatment of cardiovascular diseases (yes, no), prior cardiovascular disease (yes, no), number of non-cardiovascular disease, index HbA1c, and HbA1c variability. The solid curves indicating adjusted estimates and dashed curves indicating 95% confidence limits. The gray spikes showing the number of people with the given absolute change in HbA1c (N=11 205).
Although few observations in some of the strata, associations were over-all similar for men and women, for the different treatment modalities, for self-reported diabetes duration of ≤1 and ≥6 years, and when replacing HbA1c variability defined as the absolute mean residual with the SD or with the COV (data not shown). Likewise, secondary analyses among those 7710 individuals where self-reported diabetes were available, with further adjustment for diabetes duration showed similar patterns of association (data not shown).
Discussion
The impact of HbA1c variability and of an absolute change in HbA1c during 22–26 months differed with the index HbA1c level. In this population-based observational study among Danish individuals with type 2 diabetes, we found that HbA1c variability was associated with mortality irrespective of the magnitude of absolute change in HbA1c and index HbA1c for those with an index HbA1c≤8%. In general, a higher HbA1c variability or a decrease in HbA1c level was associated with increased mortality for individuals with an index HbA1c≤8%. For individuals with an index HbA1c>8% we found no association between HbA1c variability and mortality, but a linear relationship was identified between absolute change in HbA1c and mortality, with the lowest mortality for greatest decline in HbA1c.
To the best of our knowledge, evidence with respect to associations between HbA1c variability and mortality is limited to one study among 881 participants revealing SD and CV of HbA1c measurements, assessed every 2–4 months, to be independently associated with all-cause mortality, and with a tendency of stronger associations in participants with a mean HbA1c below 7.3% (56 mmol/mol) (the median HbA1c value in the study).20 This contradicts our finding among individuals with index HbA1c>8% (64 mmol/mol) where no association between HbA1c variability and mortality could be identified. However, they analyzed independency of mean HbA1c while ignoring any trend in HbA1c, whereas we analyzed independency of index HbA1c and absolute change in HbA1c. A Korean study investigated associations between HbA1c variability and intima-media thickness.18 The predominant cause of death in type 2 diabetes is cardiovascular disease,29 ,30 and carotid intima-media thickness is a well-established index of early atherosclerosis, which is widely used as a surrogate marker of cardiovascular disease.31 Among individuals with an index HbA1c≤8% (64 mmol/mol), we found an association between HbA1c variability and mortality quite independent of index HbA1c and absolute change in HbA1c; this is in contrast to the Korean study,18 where no independent association between HbA1c variability and intima-media thickness was found. However, they analyzed independency of index HbA1c and mean HbA1c while ignoring any trend in HbA1c, whereas we analyzed independency of index HbA1c and absolute change in HbA1c. Likewise, they defined HbA1c variability in terms of SD to the mean HbA1c, whereas we defined HbA1c variability as absolute value residuals to the line connecting index HbA1c and closing HbA1c. When defining HbA1c variability as the SD to the mean HbA1c, a steady linear change in HbA1c will entail a high SD value, which we would suggest should not be considered as an indication of a high fluctuation in HbA1c. However, secondary analyses in our population replacing HbA1c variability with SD did not change the results of why a different definition of HbA1c variability is unlikely to be the cause of the dissimilar findings. For individuals with an index HbA1c>8% (64 mmol/mol), our results agreed with the Korean study, as we found no association between HbA1c variability and mortality. Recent studies13–17 of associations between HbA1c variability and development of microalbuminuria, progression of nephropathy, and incidence of cardiovascular disease demonstrated HbA1c variability to be an independent risk factor. However, the definition of HbA1c variability was similar to that of the Korean study, and not to the one used in our study. Their analyses also differed as they did not include index HbA1c and used the classic Cox proportional regression analysis in contrast to our modeling with restricted cubic splines. Restricted cubic splines modeling allows piecewise cubic polynomial shapes between knots, unlike the classic Cox proportional hazard regression in which linear relationships are assumed. Whether similar statistical modeling would have produced similar results is unknown. However, in our observational study, it is intriguing why the association between high variability in HbA1c and mortality only holds for individuals with an index HbA1c below a certain level. Perhaps a persistent high glycemic load outweighs the harm of high variability. Future research should address this and clarify the pathway.
Meta-analyses of randomized controlled trials have demonstrated no association between mortality and intensive glycemic control as measured by the HbA1c level,32 ,33 but as far as we know, studies investigating associations between individual absolute change in HbA1c and mortality are limited to a post hoc analysis of data from the ACCORD trial.34 The ACCORD study found no association between mortality and change in HbA1c in the standard treatment group, but demonstrated an increased mortality in the intensively treated group for participants whose HbA1c declined little or not at all. This contradicts our findings of an association between a decrease in HbA1c and increased mortality among people with an index HbA1c ≤8% (64 mmol/mol) and a linear relationship between absolute change in HbA1c and mortality for people with index HbA1c>8% (64 mmol/mol). However, only people with type 2 diabetes and either a prior cardiovascular event or other evidence of high cardiovascular risk were enrolled in the ACCORD study, and their analysis did not include information on HbA1c variability. For individuals with an index HbA1c≤8% (64 mmol/mol), we found HbA1c variability to have an association with mortality, independent of the index level, and absolute change in HbA1c, which may indicate that it is important to include this information in analyses of the impact of HbA1c on mortality.
Yet our results of an association between a decrease in HbA1c and increased mortality among people with an index HbA1c ≤8% (64 mmol/mol) is in line with a UK study demonstrating an association between low HbA1c and increased mortality10; results which were replicated in a study from our database.11 The finding of no association between an increase in HbA1c and mortality among people with an index HbA1c ≤8% (64 mmol/mol) is, however, not in agreement with previous studies,10–12 which identified HbA1c levels above 7% (53 mmol/mol) and 8% (64 mmol/mol), respectively, to be associated with increased mortality. Therefore, we expected to find increased mortality among those who had a high increase in HbA1c. Among people with an index HbA1c>8% (64 mmol/mol), we found a linear relationship between absolute change in HbA1c and mortality, which is in line with the previously mentioned studies.10–12
We used restricted cubic splines modeling with adjustment for HbA1c variability whereas the previously mentioned studies only addressed index HbA1c or mean HbA1c and mortality, ignoring trend and variability in HbA1c.
Significant strengths of this study are its large population-based design with full follow-up of all individuals and the possibility to adjust for comorbidities. Further, the statistical modeling with restricted cubic splines allows a flexible and robust modeling of the relationship between mortality and HbA1c variability or absolute change in HbA1c. Moreover, index HbA1c, HbA1c variability, and absolute change in HbA1c were included in the same model.
This study is an observational study, and we do not know the reasons for having HbA1c measured or the reasons behind the changes in HbA1c, which are the primary limitations. Most likely, the previously measured HbA1c level and the general condition of the person will have influenced when a new measurement was made. Those who did not have a measurement 22–26 months after the index HbA1c (n=10 979) and those who did not have at least one measurement in-between (n=282) have not been included. As in Denmark all healthcare visits and laboratory measurements addressing a person's type 2 diabetes are free of charge and individuals with type 2 diabetes are encouraged to have their HbA1c measured every 3 months and are offered a special annual diabetes control at the GP every 12 months, we believe the findings in our study to be representative of people attending their GP at least for their annual diabetes control. Whether individuals with type 2 diabetes, who do not attend their GP (or other healthcare professionals), or who choose not to have their HbA1c measured, experience a different impact on mortality of HbA1c variability or absolute changes in HbA1c is unknown. For some individuals, the reason behind having no HbA1c measurement is death. This might have induced immortal time bias to the results, and it is important to keep in mind that associations might look different for the unhealthiest individuals who die within 2 years after the first HbA1c measurement or who are too ill to undertake a new HbA1c measurement. HbA1c measurements were analyzed at four different laboratories with standardized analyses and a coefficient of variation of 2.3%. Any measurement error might lead to a false classification into the five HbA1c index groups. To investigate the robustness of our results, we have added random measurement noise to the index HbA1c accordingly to a coefficient of 2.3% and completed the analysis as before. For each analysis, we have cycled this procedure 100 times and estimated the average relative variance increase (RVI).35 It indicates the increase in variance of the estimates because of the added noise: the closer the number is to 0, the less effect the added noises have on the variance of the estimates. RVI due to the added noise was small: 0.077 and 0.073 for absolute change and variability analysis, respectively. We lacked information of diabetes duration in some of the included individuals and for those where we had this information, it was primarily self-reported, and therefore it might not be valid. The overall conclusion did not change significantly when including the available information on diabetes duration, so we consider it unlikely that omission of duration has introduced substantial bias. However, it is unknown whether duration would have affected the results if the “true” durations had been available for analysis.
We have no information regarding HbA1c after the closing HbA1c measurement, nor on treatment modality. Consequently the results of the analyses are solely based on changes in HbA1c, HbA1c variability, and treatment modality before start of follow-up, and do not take any associations between changes during follow-up and mortality into account. Further, we did not have access to information on smoking habits. The positive predictive value of the algorithm used to identify people with type 2 diabetes is estimated at 89%,23 and thus some of the included individuals in this study might not have type 2 diabetes. However, owing to the extra selection criteria of at least three HbA1c measurements during 2 years, this problem is likely negligible.
In summary, the associations of HbA1c variability and absolute changes in HbA1c with mortality differed across index HbA1c levels among individuals with type 2 diabetes. Increased HbA1c variability was associated with increased mortality for individuals with index HbA1c≤8% (64 mmol/mol), and no association could be identified for individuals with index HbA1c>8% (64 mmol/mol). For individuals with index HbA1c≤8% (64 mmol/mol), a decline in HbA1c was associated with increased mortality, whereas for individuals with index HbA1c>8% (64 mmol/mol) a decline in HbA1c was associated with decreased mortality. Thus, we have identified HbA1c variability and absolute changes in HbA1c to be associated with mortality independently of the index HbA1c level. However, results need to be confirmed in other study populations. Hopefully, in the long term, this can lead to a targeted prevention of complications by more individualized treatment, presumably by aiming at reducing HbA1c variability for individuals with HbA1c≤8% (64 mmol/mol).
References
Footnotes
Contributors All authors have approved the submitted version of the paper. MVS acquired the data, produced the analyses, participated substantially in the design and interpretation of the data, drafted the first version of the paper, and revised it critically. AS, JKK, and HS participated substantially in the design and interpretation of the data, and revised the paper critically. MVS is the guarantor and, as such, had full access to all the data in the study and takes responsibility for the integrity of the data and the accuracy of the data analysis.
Funding MVS was supported by an unrestricted grant from the Tryg Foundation, Denmark, J-nr 7-10-0787 and by a PhD fellowship from Aarhus University, Denmark.
Competing interests None.
Ethics approval Danish Data Protection Agency.
Provenance and peer review Not commissioned; externally peer reviewed.
Data sharing statement No additional data are available.