Article Text

Abstract
Objective Normal-weight abdominal obesity has been reported to be associated with poor mortality. We aimed to investigate the impact of increased visceral adiposity with normal weight (OB(−)VA(+)) on the progression of arterial stiffness in patients with type 2 diabetes.
Methods This was a cross-sectional study of 414 patients with type 2 diabetes (mean age 64±12 years; 40.3% female). Visceral fat area (VFA, cm2) was measured by a dual bioelectrical impedance analyzer. Arterial stiffness was assessed by brachial-ankle pulse wave velocity (baPWV, cm/s). Patients were divided into four groups by VFA and body mass index (BMI, kg/m2) as the following: BMI<25 kg/m2 and VFA<100 cm2 (obesity (OB)(−)visceral adiposity (VA)(−)), BMI≥25 kg/m2 and VFA<100 cm2 (OB(+)VA(−)), BMI<25 kg/m2 and VFA≥100 cm2 (OB(−)VA(+)), and BMI≥25 kg/m2 and VFA≥100 cm2 (OB(+)VA(+)). Multivariate linear regression analysis was done to determine the impact of OB(−)VA(+) on arterial stiffness.
Results Among the patients, 7.2% were OB(−)VA(+) with higher baPWV levels (1956±444 cm/s) than those with OB(+)VA(−) (1671±416 cm/s, p=0.014), those with OB(+)VA(+) (1744±317 cm/s, p=0.048), and those with OB(−)VA(−) (1620±397 cm/s, p=0.024). In multivariate linear regression analysis, OB(−)VA(+) remained independently associated with baPWV (standardized β 0.184, p=0.001).
Conclusions This study provides evidence for the burden of arterial stiffness in OB(−)VA(+) patients with type 2 diabetes; therefore, evaluation of visceral adiposity is of clinical relevance for the better management of non-obese individuals as well as obese populations.
- Atherosclerosis
- Body Mass Index
- Visceral Obesity
This is an Open Access article distributed in accordance with the Creative Commons Attribution Non Commercial (CC BY-NC 4.0) license, which permits others to distribute, remix, adapt, build upon this work non-commercially, and license their derivative works on different terms, provided the original work is properly cited and the use is non-commercial. See: http://creativecommons.org/licenses/by-nc/4.0/
Statistics from Altmetric.com
Key messages
Approximately 7% of Japanese patients with type 2 diabetes had a body mass index (BMI) <25 kg/m2 and a visceral fat area (VFA) ≥100 cm2 (OB(−)VA(+)).
OB(−)VA(+) patients had significantly higher pulse wave velocity (PWV) levels than those with BMI≥25 kg/m2 and VFA≥100 cm2, those with BMI≥25 kg/m2 and VFA<100 cm2, and those with BMI<25 kg/m2 and VFA<100 cm2.
In multivariate linear regression analysis, OB(−)VA(+) remained independently associated with PWV.
Introduction
Visceral obesity is strongly associated with insulin resistance, hypertension, dyslipidemia and systemic chronic low-grade inflammation, all of which play a pivotal role in the pathogenesis of atherosclerosis, thus increasing the risk of cardiovascular disease (CVD).1–3 Body mass index (BMI) is often used as an anthropometric tool for the assessment of relative weight and the degree of obesity.4 There is considerable evidence that higher BMI is closely associated with cardiovascular outcomes5 ,6 and mortality.7 The association of higher BMI with poor cardiovascular outcomes could be partly explained by the excess of body fat, or of abdominal fat. However, a previous epidemiological study pointed out the U-shaped or J-shaped association of BMI with clinical outcomes and mortality.8 This phenomenon of obesity assessed by BMI has been described as the ‘obesity paradox’, especially documented in elderly patients with chronic diseases such as coronary artery disease and chronic heart failure.9 ,10 Interestingly, among patients newly diagnosed with type 2 diabetes, those diagnosed as normal weight by BMI have had a higher mortality than those diagnosed as overweight or obese.11 It may be due in part to the inability of BMI to differentiate visceral and subcutaneous fat mass and even lean body mass. In addition, a previous report showed that BMI is a predictor of lean body mass rather than adiposity in patients with heart failure,12 suggesting that some patients with normal BMI represent increased visceral adiposity with decreased lean body mass. It is therefore conceivable that the disproportion of adiposity rather than BMI is critically associated with the accumulation of cardiovascular risk factors such as insulin resistance, hypertension, and systemic low-grade inflammation. That is, a person with increased visceral adiposity with normal BMI (OB(−)VA(+)) may have increased risk of CVD; however, little is known regarding the association between OB(−)VA(+) and progression of atherosclerosis, especially of arterial stiffening in patients with type 2 diabetes.
A previous report pointed to a striking difference in average BMI levels between Western and Japanese patients with type 2 diabetes.13 It is noteworthy that Japanese patients with type 2 diabetes (mean BMI; 23.1 kg/m2) have a much lower BMI than Western patients with type 2 diabetes (mean BMI; 29.4 kg/m2) and that half of the Japanese patients are classified as normal weight (BMI; 18.5–24.9 kg/m2) or underweight (BMI<18.5 kg/m2) by the definition of WHO and the International Obesity Task Force classification of obesity.14 ,15 Increased visceral fat has been recognized as an independent predictor of type 2 diabetes among multiracial individuals.16 ,17 Furthermore, the Japanese have been reported to have a greater amount of abdominal visceral fat relative to abdominal subcutaneous fat than Caucasians.18 The epidemiological data postulate that the prevalence of OB(−)VA(+) in patients with diabetes is expected to be much higher in the Japanese population than in the Western population. In this study, we investigated the prevalence of OB(−)VA(+) in Japanese patients with type 2 diabetes and whether OB(−)VA (+) increases the risk of arterial stiffness.
Methods
Patients
Our study population consisted of patients with type 2 diabetes who were admitted to the Tokyo Medical and Dental University Hospital for the purpose of glycemic control and/or evaluation of diabetic complications during the period from July 1, 2012 to August 31, 2014. Patients were eligible if they were aged ≥20 years. Patients with type 1 diabetes, those with severe renal impairment (estimated glomerular filtration rate (eGFR) <15 mL/min/1.73 m2 or undergoing renal replacement therapy), pregnant women, and those with infectious or malignant diseases were excluded. Type 2 diabetes was diagnosed according to the criteria of the Japan Diabetes Society (JDS).19
Clinical and biochemical analyses
Standardized questionnaires were used to obtain information on smoking and medication. Smoking history was classified as either current smoker or non-smoker. Glycated hemoglobin (HbA1c) was measured by the latex agglutination method. HbA1c levels were expressed in accordance with the National Glycohemoglobin Standardization Programs recommended by the Japanese Diabetes Society.19 Urinary albumin and creatinine excretion were measured by the turbidimetric immunoassay and enzymatic method, respectively, in a single 24 h urine collection. GFR was estimated using the following equation for the Japanese, as proposed by the Japanese Society of Nephrology;20 GFR=194×SCr−1.094×age−0.287 ((if female)×0.739), where SCr stands for serum creatinine in mg/dL, measured by an enzymatic method. BMI was calculated as weight divided by the square of height (kg/m2). Visceral fat area (VFA) and subcutaneous fat area (SFA) were measured by a dual bioelectrical impedance analyzer (DUALSCAN, Omron Healthcare Co., Kyoto, Japan). Previous studies demonstrated a good correlation between VFA measured by a dual bioelectrical impedance analyzer and that measured by an abdominal CT.21 ,22 According to the definition of obesity and visceral fat obesity in Japan,23 we used cut points of 25 kg/m2 in BMI for obesity and of 100 cm2 in VFA for visceral fat obesity. We classified the patients into four groups by these cut-off values of BMI and VFA as follows: BMI<25 and VFA<100 (OB(−)VA(−)), BMI≥25 and VFA<100 (OB(+)VA(−)), BMI<25 and VFA≥100 (OB(−)VA(+)), and BMI≥25 and VFA≥100 (OB(+)VA(+); figure 1). Brachial-ankle pulse wave velocity (baPWV) was measured using a volume-plethysmographic apparatus (BP-203RPE II form PWV/ABI, Omron Healthcare Co., Kyoto, Japan), with subjects in the supine position after at least 5 min of rest.24 ,25 The baPWV was calculated as reported previously.26 We simultaneously measured baPWV on the right and left sides and the averaged values from each individual were subjected to statistical analysis. This study complies with the principles laid down in the Declaration of Helsinki.
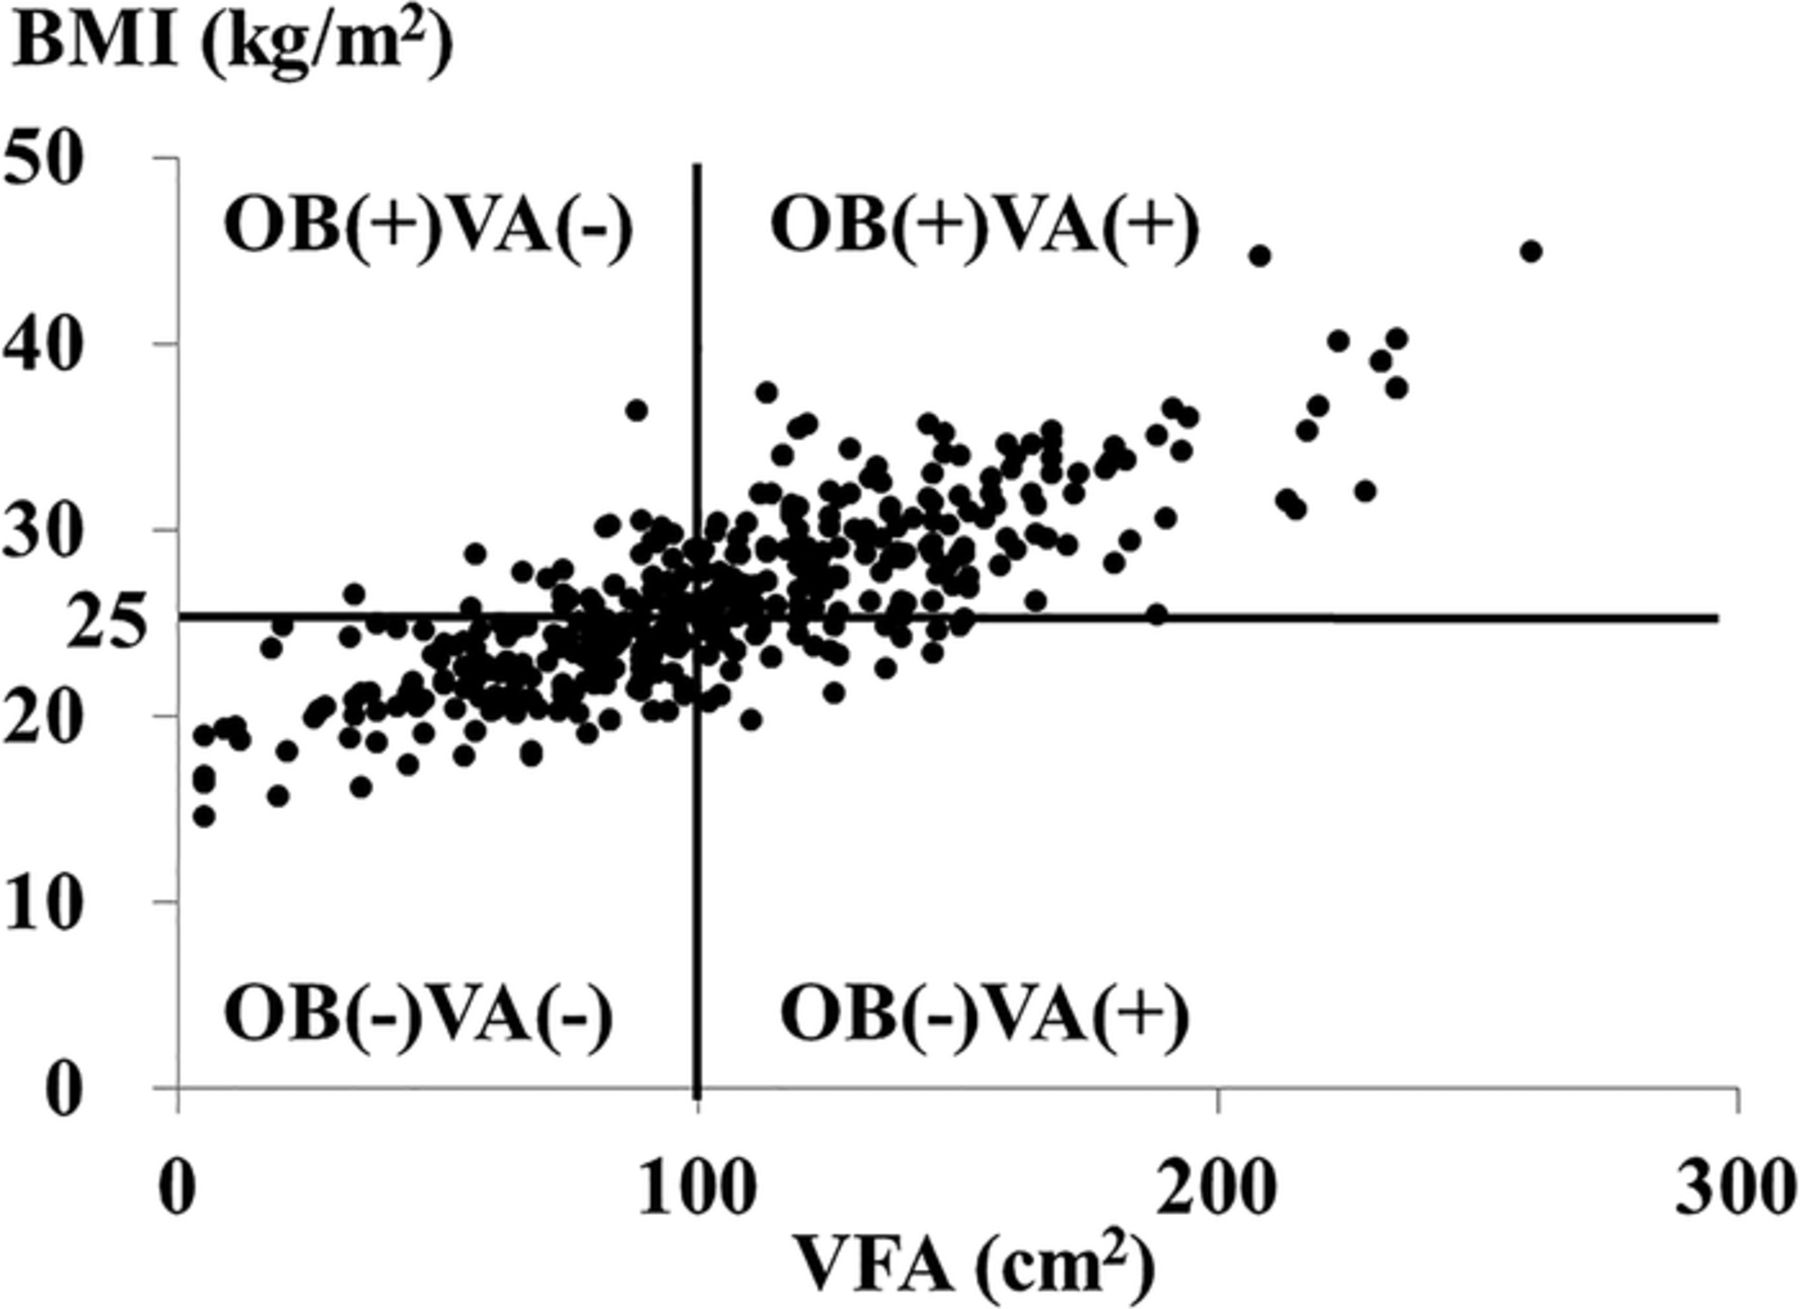
The correlation between visceral fat area (VFA) and body mass index (BMI) in patients with type 2 diabetes. OB(−)VA(−), patients with VFA<100 cm2 and BMI<25.0 kg/m2; OB(+)VA(−), those with VFA<100 cm2 and BMI≥25 kg/m2; OB(−)VA(+), those with VFA≥100 cm2 and BMI<25 kg/m2; OB(+)VA(+), those with VFA≥100 cm2 and BMI≥25 kg/m2.
Statistical analysis
Statistical analyses were performed using programs available in the SPSS V.21.0 statistical package (SPSS Inc., Chicago, Illinois, USA). Data are presented as the mean±SD or geometric mean with 95% CI as appropriate according to data distribution. Glucose, aspartate aminotransferase, alanine aminotransferase, triglycerides, C reactive protein (CRP), brain-type natriuretic peptide, and urinary albumin and C-peptide excretion were logarithmically transformed because of skewed distributions. Categorical variables are presented as a percentage. Differences among the 4 groups were tested with a one-way analysis of variance (continuous variables) or χ2 test (categorical variables) followed by Tukey-Kramer methods for the post hoc analysis. Linear regression analysis with a stepwise procedure was used to assess the cross-sectional association of each manifestation of abdominal (VFA) and entire body weight (BMI) with baPWV. The following covariates were incorporated in the analysis; age, gender, duration of diabetes, history of CVD, presence of proliferative diabetic retinopathy, smoking status, systolic blood pressure, triglycerides, high-density lipoprotein (HDL) cholesterol, low-density lipoprotein cholesterol, HbA1c, urinary albumin, eGFR, and the use of oral hypoglycemic agents, the use of calcium-channel blockers, angiotensin-converting enzyme inhibitors, angiotensin receptor blockers, statins, and antiplatelet agents. Differences were considered to be statistically significant at a p value less than 0.05.
Results
Characteristics of the study population
A total of 414 Japanese patients with type 2 diabetes (mean age 64±12 years; 40.3% female) were eligible for this study. As shown in figure 1, 7.2% of participants (N=30) were classified as OB(−)VA(+). In this study, 37.9% (N=157), 11.8% (N=49), and 43% (N=178) of patients were classified as OB(−)VA(−), OB(+)VA(−), and OB(+)VA(+), respectively. Table 1 shows demographic characteristics and laboratory data of the 414 patients with type 2 diabetes. Medications were listed in table 2. The OB(−)VA(+) patients were older (p=0.004), with higher diastolic blood pressure (p<0.001) and a shorter duration of diabetes (p=0.039) than OB(−)VA(−) patients. The OB(−)VA(+) patients had a significantly higher proportion of male patients than OB(+)VA(−) patients (p=0.003) as well as OB(+)VA(+) patients (p=0.010). The OB(−)VA(+) patients had a significantly higher VFA-to-SFA ratio (V/S ratio) than OB(−)VA(−) patients (p<0.001), OB(+)VA(−) patients (p<0.001), and OB(+)VA(+) patients (p=0.003). We found significant differences in urinary C-peptide excretion, triglycerides, HDL-cholesterol, albuminuria, and CRP among the four patient groups, with statistical significances in urinary C-peptide excretion (p=0.044), triglycerides (p=0.030), and CRP levels (p=0.043) between OB(−)VA(−) and OB(−)VA(+) and with no significant differences in urinary C-peptide excretion, triglycerides, HDL-cholesterol, albuminuria, and CRP between OB(−)VA(+) and OB(+)VA(+). In this study, there were no significant differences in the prevalence of retinopathy and coefficient of variation of R-R intervals among the four patient groups. The OB(+)VA(−) patients showed significantly higher BMI, waist circumference (WC), triglycerides, prevalence of fatty liver disease than OB(−)VA(−)patients; however, there were no significant differences in systolic and diastolic blood pressure, C reactive protein, and the prevalence of diabetic microvascular complications such as albuminuria between OB(+)VA(−) and OB(−)VA(−) patients (table 1).
Clinical data of patients with type 2 diabetes
Medications of patients with type 2 diabetes
baPWV levels
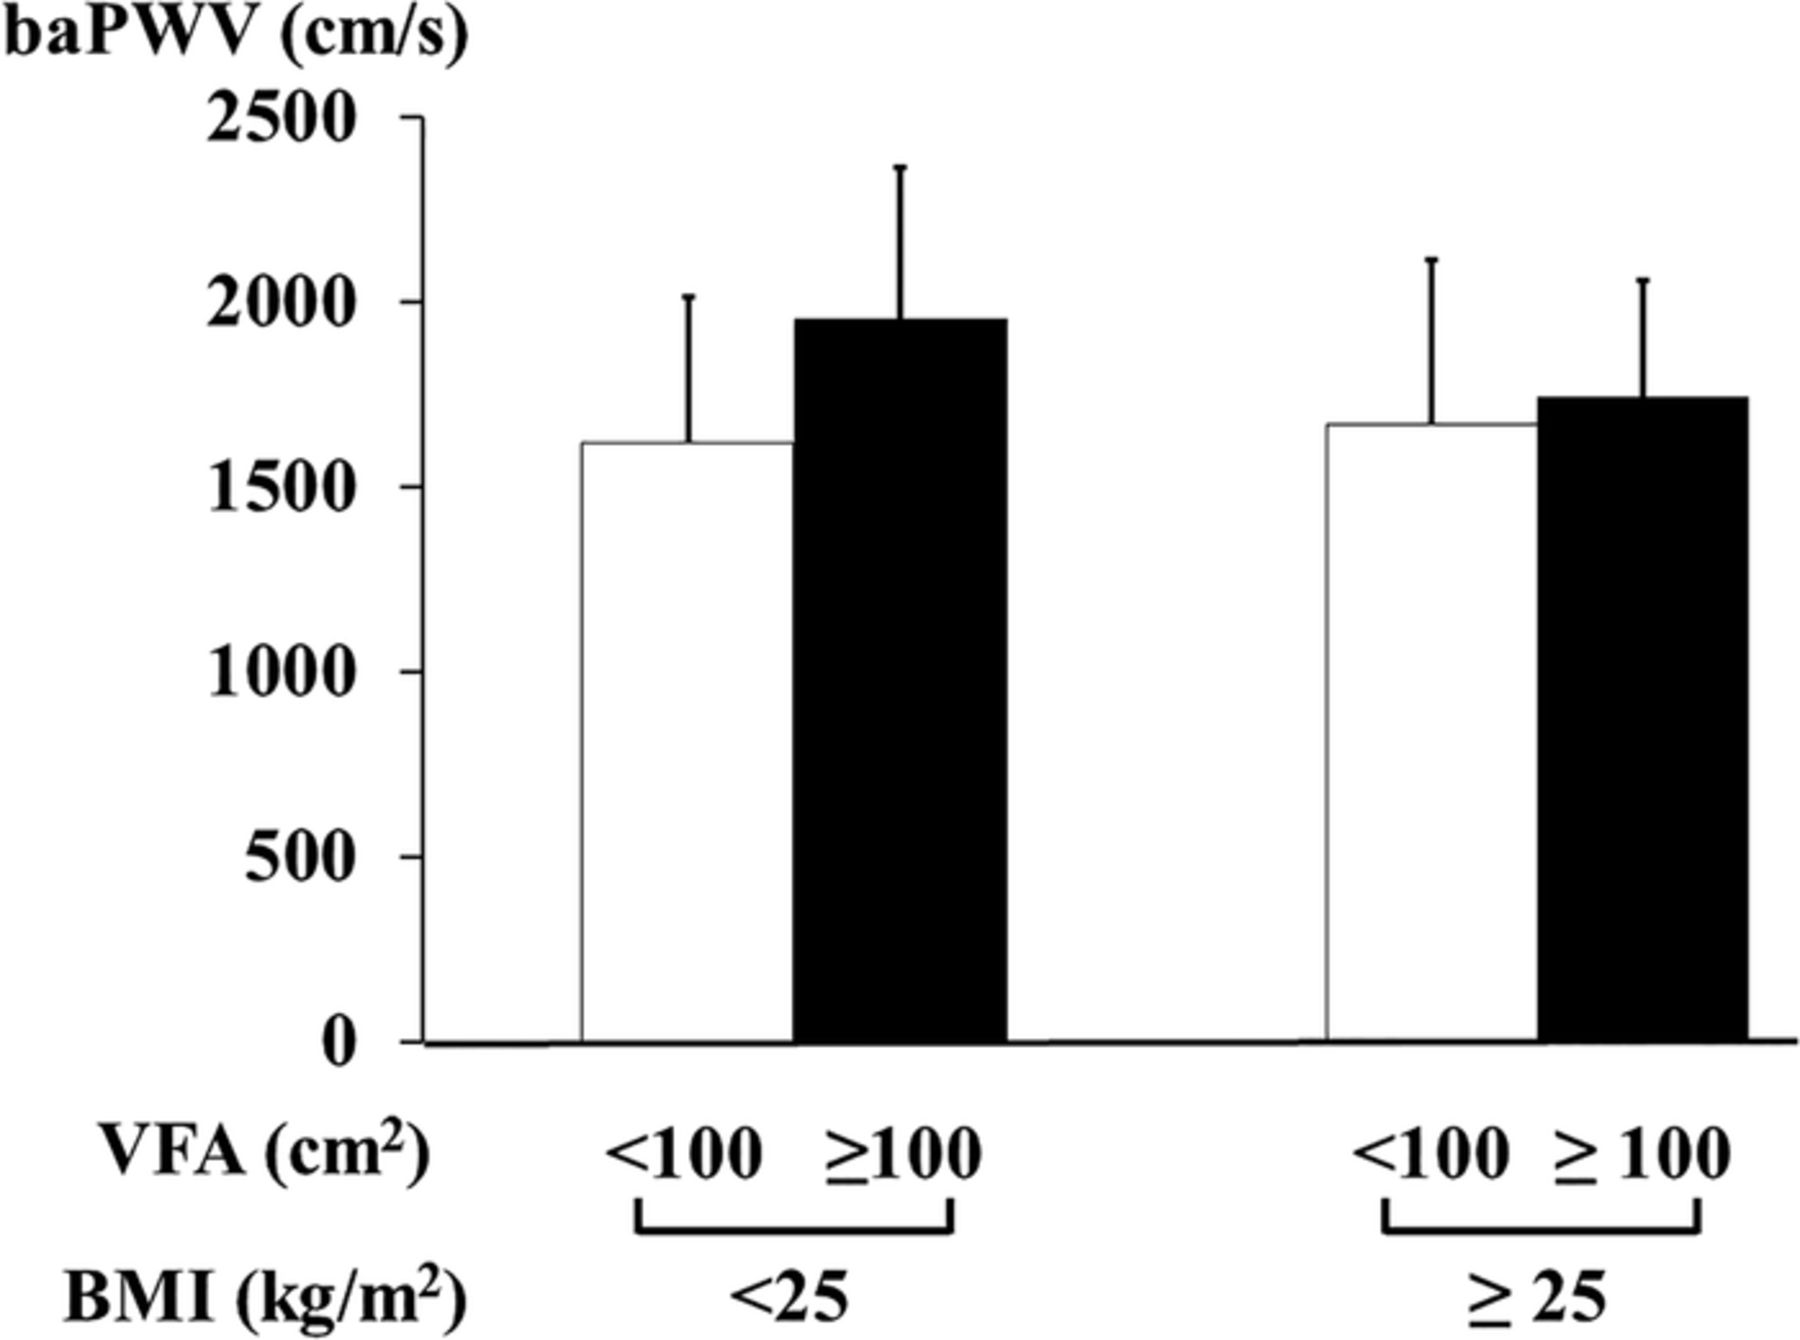
The OB(−)VA(+) patients had a significantly higher baPWV than OB(−)VA(−) (p=0.024) and OB(+)VA(−) patients (p=0.014) and also OB(+)VA(+) patients (p=0.048; figure 2).
The association of visceral adiposity and BMI with pulse wave velocity in patients with type 2 diabetes. White bars, patients with VFA<100 cm2; black bars, those with VFA≥100 cm2. BMI, body mass index; baPWV, brachial-ankle pulse wave velocity; VFA, visceral fat area.
Association of visceral adiposity and BMI with baPWV
The OB(−)VA(+) patients were at increased risk of arterial stiffness relative to OB(−)VA(−) patients even after adjustment for other covariates including age, blood pressure, and renal function, all of which could affect arterial stiffness (table 3). As expected, OB(+)VA(+) was also significantly associated with baPWV in the multivariate analysis, whereas no significant association between OB(+)VA(−) and increased baPWV was observed (table 3). To assess the robustness of the above data, we conducted a subgroup analysis excluding patients with a BMI less than 18.5 kg/m2 (N=10). None of the OB(−)VA(+) patients were eliminated. As in the whole cohort, OB(−)VA(+) was significantly associated with baPWV in the multivariate analysis (standardized β 0.181, p<0.001). In order to investigate whether smoking could confound the association between OB(−)VA(+) and increased PWV, smoking status was simultaneously included in the statistical model. In this study, OB(−)VA(+) remained associated with baPWV (standardized β 0.146, p=0.001). The WHO, the International Association for the Study of Obesity, and the International Obesity Task Force recommend that the BMI value to denote overweight in Asians should be ≥23 kg/m2,27 and the American Diabetes Association has recently proposed in its position statement that the specific BMI cut point for diabetes screening should be 23 kg/m2 in Asian Americans.28 In addition, a recent study clearly revealed that persons with a BMI in the range of 22.6 and 27.5 kg/m2 had the lowest risk of death among East Asians.2 ,29 Therefore, we further examined the association of BMI and VFA with baPWV using the cut-off of 23 and 27.5 kg/m2 in BMI and of 100 cm2 in VFA. As shown in the online supplementary figure, baPWV levels in patients with VFA≥100 cm2 were likely to be higher than those in patients with VFA<100 cm2 across all categories of BMI. In the multivariate linear regression analysis, compared to BMI<23.0 kg/m2 and VFA<100 cm2, BMI<23.0 kg/m2 and VFA≥100 cm2, BMI 23–27.5 kg/m2 and VFA≥100 cm2, BMI≥27.5 kg/m2 and VFA≥100 cm2 were significantly associated with baPWV, whereas patients with BMI 23–27.5 kg/m2 and VFA<100 cm2 and those with BMI≥27.5 kg/m2 and VFA<100 cm2 were not at significantly increased risk for arterial stiffness (online supplementary table).
Multivariate linear regression analysis for independent factors associated with pulse wave velocity in patients with type 2 diabetes
Discussion
This study demonstrates that the prevalence of increased visceral adiposity with normal weight (OB(−)VA(+)) was 7.2% among Japanese patients with type 2 diabetes and that those individuals have an increased risk for the progression of arterial stiffness defined by PWV. It is important to identify patients with type 2 diabetes with increased PWV, because increased PWV predicts fatal and non-fatal cardiovascular events30 ,31 and progression of diabetic kidney disease.32 To the best of our knowledge, this study is the first to demonstrate the impact of OB(−)VA(+) on the progression of arterial stiffness in patients with type 2 diabetes. A previous study revealed a positive association of visceral fat thickness assessed by abdominal ultrasonography with carotid intima-media thickness (IMT), a marker for early atherosclerosis and vascular remodeling, even in male patients with type 2 diabetes who had normal WC.33 A more recent study showed that IMT and baPWV synergistically increase the risks of developing cardiovascular events in patients with type 2 diabetes.26 IMT has been shown to be related to histopathologically verified atherosclerosis,34 whereas PWV has been recognized as a good measure for evaluating arterial stiffness,35 suggesting that baPWV and IMT reflect different aspects of cardiovascular risks. Therefore, this study suggests that in patients with type 2 diabetes even with normal weight, increased visceral adiposity promotes arterial stiffening in addition to the progression of morphological changes in arteries.33 In contrast, there is no significant difference in baPWV between OB(+)VA(−) and OB(−)VA(−) patients (table 1); OB(+)VA(−) is not significantly associated with the progression of arterial stiffness in the multivariate analysis (table 3). These observations suggest that the accumulation of subcutaneous adipose tissue is unlikely to affect the progression of arterial stiffness relative to visceral adipose tissue. Eventually, increased VFA per se rather than BMI may be related to atherogenic responses, thus leading to increased baPWV. Taken together, OB(−)VA(+), similar to OB(+)VA(+), is involved in the initiation and/or progression of arterial stiffness, and the strong association between OB(−)VA(+) and increased PWV can partly explain the ‘obesity paradox’, demonstrating that patients with chronic diseases such as diabetes and normal BMI have high all-cause mortality and cardiovascular mortality compared to patients with elevated BMI.9–11 Therefore, we should pay much more attention to OB(−)VA(+) patients with type 2 diabetes for the assessment of cardiovascular risks and longitudinally investigate the association of OB(-)VA(+) with the progression of arterial stiffness and cardiovascular outcomes in patients with type 2 diabetes.
It remains to be elucidated whether the findings regarding the association between OB(−)VA(+) and arterial stiffness could be observed in ethnic groups other than the Japanese, because ethnic-specific differences between visceral and subcutaneous adipose tissue distributions have been reported among multiracial individuals including the Japanese, Caucasians, African-Americans, Aboriginals, Chinese, and South Asians.18 ,36 ,37 The prevalence of non-obese individuals (BMI less than 25 kg/m2) with type 2 diabetes has been reported to be much lower in the Caucasians than in the Japanese.13 Among Western individuals with incident type 2 diabetes, patients with normal weight were only 11.2% (vs 45.2% in this study), suggesting that the prevalence of OB(−)VA(+) in Caucasian patients with type 2 diabetes is expected to be much lower than that in Japanese patients with type 2 diabetes. These observations imply that OB(−)VA(+) has a different responsibility for the progression of arterial stiffness among multiracial populations; the impact of OB(−)VA(+) on the progression of arterial stiffness might be greater in the Japanese than in the Caucasians. Therefore, further studies are required to understand whether OB(−)VA(+) is associated with the progression of arterial stiffness in populations other than the Japanese.
The mechanisms underlying the association between OB(−)VA(+) and progression of arterial stiffness are currently unknown. One possible explanation could be sarcopenic obesity, which has been recently proposed especially in elderly people.38 ,39 Patients with OB(−)VA(+) may exhibit decreased skeletal muscle mass and/or function which could promote peripheral insulin resistance. In this study, OB(−)VA(+) patients were significantly older than OB(+)VA(+) patients and this trend was observed when compared with OB(+)VA(−) patients as well. It is possible that age-related decrease in lean muscle mass results in a loss of body weight, exhibiting normal BMI with increased visceral adiposity in OB(−)VA(+) patients. Therefore, a combination of increased visceral adiposity and sarcopenia in OB(−)VA(+) patients may synergistically induce insulin resistance, thus leading to the progression of arterial stiffness. In addition, increased visceral adiposity can directly promote systemic microinflammation, which is directly responsible for the progression of arterial stiffness. Finally, increased visceral fat, decreased skeletal muscle mass, and also increased systemic microinflammation, all of which exacerbate arterial stiffening, may be the underlying mechanisms which can at least in part account for the obesity paradox as shown by the fact that normal-weight patients with diabetes had high total and cardiovascular mortality, compared with those with obesity based on BMI.11 Another explanation would be the effect of smoking as a potential confounding factor, since it has been reported that smokers have low BMI and increased abdominal adiposity relative to non-smokers.40 In this study, there was no significant difference in smoking status among the four groups. Importantly, the association between OB(−)VA(+) and baPWV remained significant even after adjusting for smoking status, when forced into the multivariate logistic regression analysis in which other significant covariates were age, systolic blood pressure, and GFR. Third, the accumulation of cardiovascular risk factors including hypertension, dyslipidemia, and systemic chronic microinflammation may also affect the association between OB(−)VA(+) and progression of arterial stiffness. In this study, OB(−)VA(+) patients had significantly higher blood pressure, triglycerides, and CRP than OB(−)VA(−) patients. However, the statistical significance between OB(−)VA(+) and baPWV was unchanged even after adjustment for the above covariates. Abnormality in coagulation, activation of platelets,41 and oxidative stress42 ,43 also could account for the association between OB(−)VA(+) and progression of arterial stiffness, although we were unable to examine the factors.
There are a couple of limitations to this study. First, we used baPWV for the assessment of arterial stiffness. Carotid-femoral PWV has been recognized as a ‘gold standard’ for evaluating arterial stiffness.35 Although baPWV is known to reflect the stiffness of larger-sized to middle-sized arteries rather than large arteries, a recent meta-analysis revealed the impact of baPWV on total cardiovascular events and mortality.44 Accordingly, we believe that the association between OB(−)VA(+) and arterial stiffness defined by baPWV would have enough power to predict future cardiovascular events. Second, we evaluated VFA by the dual bioelectrical impedance analyzer. The gold standard method to evaluate visceral adiposity is abdominal CT examination; however, a previous report showed a good correlation between VFA measured by CT and that measured by a dual bioelectrical impedance analyzer (r=0.821, p<0.001).21 In addition, it has several advantages over an abdominal CT scan such as no risk for exposure to ionized radiation. Therefore, we consider that dual bioelectrical impedance analysis could make us safely and precisely determine the effect of OB(−)VA(+) on the progression of arterial stiffness in a sufficient number of patients with type 2 diabetes and widely expect to perform the longitudinal analysis regarding the association between OB(−)VA(+) and arterial stiffness using this method. Third, the population in this study was ethnically and socially homogeneous, because this study was hospital-based; therefore, the generalization of our findings might be limited. Fourth, the distribution of body fat is different between women and men, and it would be of great interest to separately investigate the association of VFA and BMI with arterial stiffness. However, we were unfortunately unable to conduct the analysis because the sample size was small for the analysis. Fifth, individuals without diabetes were not enrolled in this study. Further studies are needed to clarify the impact of increased visceral adiposity with normal weight on the progression of arterial stiffness in individuals without diabetes.
It is critical to identify high-risk individuals for atherosclerosis among patients with type 2 diabetes because the burden for progression of arterial stiffness as shown by increased PWV is strongly associated with cardiovascular outcomes30 ,31 as well as diabetic kidney disease.32 This study sheds light on the importance of evaluating visceral adiposity even in individuals with normal BMI among patients with type 2 diabetes. The data of this study also suggest that the risk for progression of arterial stiffness in OB(−)VA(+) patients with type 2 diabetes is comparable with that in those with OB(+)VA(+). Since atherosclerosis can contribute to arterial stiffness, it is possible that the findings may be reflecting effects of visceral adiposity on atherosclerosis. We therefore propose that the evaluation of visceral adiposity is of clinical relevance for the better management of non-obese patients with type 2 diabetes as well as obese patients.
Acknowledgments
The authors thank all the staff of the Department of Molecular Endocrinology and Metabolism, Tokyo Medical and Dental University for their contributions.
References
Supplementary materials
Supplementary Data
This web only file has been produced by the BMJ Publishing Group from an electronic file supplied by the author(s) and has not been edited for content.
Files in this Data Supplement:
- Data supplement 1 - Online supplement
Footnotes
OB and VA mean obesity and visceral adiposity.
Contributors RB and YO designed the study, researched the data, and wrote and edited the manuscript. IM, TY, and YO contributed to the intellectual discussion and reviewed and edited the manuscript. MF, TF, MA, TT, MM, RN, YN, and NO researched the data. YO is the guarantor of this work.
Competing interests None.
Ethics approval This study has been approved by the ethical committee of the Tokyo Medical and Dental University (No. 1924).
Provenance and peer review Not commissioned; externally peer reviewed.
Data sharing statement No additional data are available.