Article Text

Abstract
Objective To describe the estimated prevalence and temporal trends of chronic kidney disease (CKD) treatment patterns, and the association between CKD and potential factors for type 2 diabetes mellitus (T2DM) in different demographic subgroups.
Research design and methods This was a cross-sectional analysis of adults with T2DM based on multiple US National Health and Nutrition Examination Survey (NHANES) datasets developed during 2007–2012. CKD severity was defined according to the Kidney Disease: Improving Global Outcomes (KDIGO) 2012 guidelines using the CKD Epidemiology Collaboration (CKD-EPI) equation: mild to moderate=stages 1–3a; moderate to kidney failure=stages 3b–5. Multivariable logistic regression analyses were performed to assess the associations between CKD and potential factors.
Results Of the adult individuals with T2DM (n=2006), age-adjusted CKD prevalence was 38.3% during 2007–2012; 77.5% were mild-to-moderate CKD. The overall age-adjusted prevalence of CKD was 40.2% in 2007–2008, 36.9% in 2009–2010, and 37.6% in 2011–2012. The prevalence of CKD in T2DM was 58.7% in patients aged ≥65 years, 25.7% in patients aged <65 years, 43.5% in African-Americans and Mexican-Americans, and 38.7% in non-Hispanic whites. The use of antidiabetes and antihypertensive medications generally followed treatment guideline recommendations. Older age, higher hemoglobin A1c (HbA1c), systolic blood pressure (SBP), and having hypertension were significantly associated with CKD presence but not increasing severity of CKD.
Conclusions CKD continued to be prevalent in the T2DM population; prevalence remained fairly consistent over time, suggesting that current efforts to prevent CKD could be improved overall, especially by monitoring certain populations more closely.
- Health Care Management
- Kidney Disorder
- Kidney Failure
- Kidney Function Test
This is an Open Access article distributed in accordance with the Creative Commons Attribution Non Commercial (CC BY-NC 4.0) license, which permits others to distribute, remix, adapt, build upon this work non-commercially, and license their derivative works on different terms, provided the original work is properly cited and the use is non-commercial. See: http://creativecommons.org/licenses/by-nc/4.0/
Statistics from Altmetric.com
Key messages
The prevalence of CKD in patients with T2DM in the US remained consistently high from 2007 to 2012.
CKD was more prevalent in Non-Hispanic and Mexican-American T2DM patients than in non-Hispanic white T2DM patients.
Presence of CKD and severity stage of CKD were associated with different demographic and clinical factors.
Introduction
Diabetes mellitus is the most common contributor to chronic kidney disease (CKD) in the USA and worldwide. Prior studies have estimated prevalence of CKD among non-institutionalized adults with type 2 diabetes mellitus (T2DM) at 34.5–42.3%, with most CKD cases identified as early stage (stage 1 or 2).1–7 Additionally, diabetes is present in approximately 30–40% of all cases of end-stage renal disease (ESRD) in the USA.8
The CKD staging system developed by the Kidney Disease Outcomes Quality Initiative (KDOQI) of the National Kidney Foundation (NKF) uses estimated glomerular filtration rates (eGFRs) to facilitate early identification and stage-specific diabetes treatment and dosing adjustment. Under this system, KDOQI recommended avoiding glyburide treatment in stages 3–5 of CKD, and initiating treatment with other agents, using appropriate dose adjustments, and urges special care with metformin. The Kidney Disease: Improving Global Outcomes (KDIGO) updated CKD staging in 2012, accounting for the presence of albuminuria, and subdividing stage 3 into 3a (eGFR 45–59) and 3b (eGFR 30–44).1
Traditionally, eGFR has been calculated with the well-established Modification of Diet in Renal Disease (MDRD) equation, which consists of four variables: age, sex, race/ethnicity, and serum creatinine concentration. A known limitation of this equation is that it underestimates eGFR for individuals with eGFR >60 mL/min/1.73 m2 because of the population sample that was used to derive the equation.9 A newer equation, developed in 2009, using the same four variables as the MDRD, and which has gained popularity in the scientific literature, is the CKD Epidemiology Collaboration (CKD-EPI) equation.10 Reports suggest that this approach is associated with improved performance and less bias in predicting renal and cardiovascular events, especially at higher eGFR values;11–13 however, the difference between the two estimates is minimal.14
Available literature suggests demographic and clinical factors are associated with development and progression of CKD among individuals with T2DM.12 ,13 ,15 ,16 Among the demographic factors are older age, African-American race, Hispanic ethnicities, and male sex. Clinical factors include family history of CKD, diabetes, hypertension, hyperlipidemia, cardiovascular disease, obesity, and smoking.12 ,13 ,15 ,16 Information is lacking, however, on the strength of the association between the presence and severity of CKD and these potential factors in T2DM. In addition, data currently available on temporal trends on the prevalence of CKD stages among individuals with T2DM and in key demographic subgroups based on the newer KDIGO classification, particularly for stages 3a and 3b, are limited. The availability of data on medication treatment patterns by CKD stages is also limited.
The objectives of this study were to describe current and temporal trends of CKD prevalence in patients with T2DM among demographic subgroups, the pharmacological treatment patterns in these patients by KDIGO classification, and to assess the association between the presence and severity of CKD and potential factors.
Research design and methods
Study design and data source
This study was designed as a cross-sectional analysis of adult patients with T2DM drawn from three different US National Health and Nutrition Examination Surveys (NHANES): 2007–2008, 2009–2010, and 2011–2012. The characteristics of NHANES data and cross-sectional analysis methodology have been described.17–19 The variables selected for this study included patient demographics, data from medical examinations (blood pressure (BP) and other vital signs), and laboratory data (fasting plasma glucose and insulin, hemoglobin A1c (HbA1c), standard biochemistry panel, urinary albumin and creatinine, triglycerides, low-density lipoprotein cholesterol, and high-density lipoprotein cholesterol). The study also used self-reported data (via a patient survey questionnaire) that included survey participants' history of diabetes and other medical conditions, prescription and other medication use, smoking status, and health insurance eligibility.
Inclusion and exclusion criteria
This analysis included adults (≥18 years) with self-reported diabetes. Patients' self-reported questionnaire responses were used to determine the presence of diabetes, which was based on (1) physicians informing participants about their diabetes status or (2) participants reporting any antidiabetes medication use. Participants with type 1 diabetes mellitus (T1DM), defined as a patient diagnosed at age <30 years and receiving insulin treatment only, were excluded. Participants without the requisite information to determine eGFR by the CKD-EPI equation (serum creatinine, age, gender, and/or race) were excluded. Pregnant participants were also excluded from the study because of the potential for distortions in their eGFR values.
KDIGO CKD stage classification
This study followed CKD categorization based on the 2012 KDIGO classification recommendations.20 CKD stages 1–3a were categorized as mild to moderate, while stages 3b–5 were categorized as moderate to kidney failure (see online supplementary table S1). Mean eGFR was calculated with the CKD-EPI and MDRD equations. As observed in prior literature, differences between the estimates calculated from the two equations were minimal.14 Therefore, this study focused on results derived from the CKD-EPI equation.
Supplementary tables
Comorbidity identification
Among the comorbid conditions assessed were retinopathy, nephropathy, congestive heart failure (CHF), coronary heart disease (CHD), angina, myocardial infarction (MI), stroke, and hypertension. All comorbidities were based on participants' self-reports. The presence of hypertension was further captured by readings of mean systolic BP (SBP)/diastolic BP (DBP) >140/90 mm Hg if available, participant-reported use of antihypertensive agents, and any evidence of antihypertensive medication use found in healthcare practitioner-led medication reviews.
Age adjustment
CKD prevalence estimates were weighted to reflect national age distributions. Age adjustment was based on the age distribution of diagnosed diabetes (all types) in US adults (aged ≥18 years), which was derived from the 2012 US Census,21 and 2012 National Health Interview Survey—Diagnosed Diabetes.22 Age-adjusted analyses were only performed on the overall cohort and not for any of the subanalyses (ie, analyses stratified by age, gender, and race/ethnicity).
Statistical analysis
Prevalence, projected means, corrected variance estimates, and 95% CIs were obtained and accounted for in the complex sampling design effect. Appropriate survey weights provided by NHANES were applied to account for non-response bias and oversampling.23 χ2 tests for categorical variables and analyses of variance (ANOVAs) for continuous variables were performed to compare demographic characteristics, comorbid conditions, laboratory values, and medication use between patients with T2DM with no CKD, mild-to-moderate CKD (stages 1–3a), and moderate-to-severe CKD (stages 3b–5). Two separate multivariable logistic regression models were developed to test the relationship between CKD presence (with vs without CKD) and the severity of CKD (moderate CKD to kidney failure vs mild-to-moderate CKD) with the demographic and clinical characteristics hypothesized to be associated with CKD. All analyses were performed using SAS V.9.4.
Results
Demographics and clinical characteristics
A total of 2006 adults with T2DM were identified during 2007–2012; mean age was 60.5 years, and the mean duration of T2DM was 10.1 years. Half of the participants (49.6%) were male; 60.7% were non-Hispanic white, 16.0% were non-Hispanic black, and 9.3% were Mexican-American. A majority (77.6%) had hypertension and 16.4% were active smokers. The average eGFR was 81.6 mL/min/1.73 m2 according to the CKD-EPI equation. In the total T2DM sample, 884 adults had both T2DM and CKD. Older age, female sex, longer diabetes duration, higher SBP, and greater prevalence of comorbid conditions were associated with declining kidney function. Likely driven by survivor bias, mean age was much lower in stage 5 than in stage 4 (59.7 vs 73.2 years), and the prevalence in stage 5 was lower than stage 4 for most of the reported comorbid conditions (table 1).
Demographic characteristics
CKD prevalence
Temporal age-adjusted trends (table 2) during 2007–2012 show overall CKD prevalence in the T2DM population to be 38.3%. Most cases were mild-to-moderate CKD, with 9.1% for stage 1, 9.4% for stage 2, and 11.2% for stage 3a. Fewer than 9% had moderate CKD to kidney failure: 5.5% for stage 3b, 2.4% for stage 4, and 0.7% for stage 5. The overall age-adjusted prevalence of CKD was 40.2% in 2007–2008, 36.9% in 2009–2010, and 37.6% in 2011–2012.
Age-adjusted prevalence of CKD in T2DM
Age (<65 vs 65+ years)
During 2007–2012, the prevalence of CKD in adults with T2DM was 58.7% among those aged ≥65 years and 25.7% among those aged 18–64 years. Most individuals with CKD who were aged <65 years were in early stages (stage 1 and 2), while most CKD cases in the elderly group were in stage 3a or higher (see online supplementary table S2).
Gender
The overall prevalence of CKD was 40.0% in men and 38.7% in women. Most men with CKD were in early stages, with 10.5%, 11.3%, and 12.1% for stages 1–3a, respectively, while most CKD cases in women were in stages 2–3b (8.7%, 11.7%, and 7.2%, respectively) (see online supplementary table S2).
Race and ethnicity
The prevalence of CKD was 43.5% in non-Hispanic blacks and Mexican-Americans, and 38.7% in non-Hispanic whites. Almost a quarter (22.5%) of Mexican-Americans with T2DM had stage 1 CKD, accounting for more than half of the CKD prevalence in this ethnic group. The prevalence of stage 5 CKD was 2.6% among non-Hispanic blacks and 1.1% among Mexican-Americans (table 3).
Prevalence of CKD in T2DM by race
Body mass index (BMI), BP, and glucose control
Blood pressure
Mean SBP was 129.7 mm Hg in the overall T2DM population, 125.9 mm Hg in T2DM without CKD, and between 132.9 and 144.5 mm Hg across CKD stages. Mean DBP was 68.6 mm Hg in the overall T2DM population, and between 60.4 and 75.0 mm Hg across all CKD stages (table 1).
BMI
BMI was 33.2 kg/m2 in the overall T2DM population, with 23.7% overweight (BMI: 25–29.9 kg/m2) and 64.4% obese (BMI: ≥30 kg/m2). Mean BMI was similar across CKD stages (table 1).
Hemoglobin A1c (HbA1c)
Mean HbA1c was 7.2% in the overall T2DM population, with 55.6% and 76.6% achieving the therapeutic targets of <7% and 8%, respectively, suggested by the 2015 American Diabetes Association (ADA) Standards of Medical Care depending on various patient and disease factors.24 The proportion of individuals attaining the goal <7% was 38.3% and 44.9% in stages 1 and 2, between 55.0% and 61.1% in stages 3a–4, and 70.2% in stage 5 (table 1).
Treatment patterns
Antidiabetes medications
Overall, 83.1% of individuals with T2DM received antidiabetes medications, including insulin (18.9%) and oral antidiabetes medication (75.1%) (table 4). The use of insulin, biguanide (metformin), and sulfonylurea (SU) was significantly different between patients without CKD, those with mild-to-moderate CKD, and those with moderate CKD to kidney failure (all p values <0.05), while the use of thiazolidinedione (TZD) and dipeptidyl peptidase-4 (DPP-4) inhibitors was similar (all p values >0.05). Descriptive trends showed that insulin use appeared to increase in stage 4 (38.2%) and stage 5 (62.8%) from earlier stages (ranging between 15.1% and 27.5%); metformin use dropped from 68.1% in stage 1 to 3.5% in stage 4 and 3% in stage 5; SU use increased to 52.9% in stage 3b and 55.6% in stage 4 from earlier stages (ranging between 30.5% and 43.6%).
Use of antidiabetes and antihypertensive medications in T2DM by CKD stages*
Antihypertensive medications
Overall, 75.7% of individuals with T2DM received antihypertensive medications. Use was extensive in those with CKD stage 2 or higher (ranging between 89.5% and 100.0%) (table 4). Less than two-thirds of this T2DM cohort were taking a medication associated with renin–angiotensin–aldosterone system (RAAS) inhibition, including ACE inhibitors (40.2%) and angiotensin II receptor blockers (ARBs; 21.8%). There was a difference in the use of ACE inhibitors and ARBs between patients without CKD, those with mild-to-moderate CKD, and those with moderate CKD to kidney failure (all p values >0.05), while the use of β-blockers, diuretics, and calcium channel blockers (CCBs) was statistically different (all p values <0.05). Descriptive trends showed that ARBs appeared to be more commonly used in stages 3a–4 (31.2–35.4%) than other individuals with T2DM; the use of β-blocker and CCBs trended upward with increasing CKD severity; diuretic use also increased from stage 1 through stage 4 (21.6–73.1%), but sharply fell in stage 5 (33.9%); thiazide diuretics were more commonly used by individuals without CKD or with mild-to-moderate CKD compared with other diuretic subclasses; in later CKD stages, the dominance of thiazide diuretics was replaced with loop diuretics.
Associated CKD factors
Older age (OR=1.58 per decade, p<0.0001), non-Hispanic black (OR=1.33 vs non-Hispanic white, p=0.0346) or Mexican-American (OR=1.85 vs non-Hispanic white, p=0.0082), hypertension (OR=1.78, p=0.0044), retinopathy (OR=1.69, p=0.0016), stroke (OR=1.84, p=0.0044), CHF (OR=2.41, p=0.0007), higher HbA1c (OR=1.18 per 1% increase, p=0.0001), higher SBP (OR=1.22 per 10 mm Hg increase, p<0.0001), and higher BMI (OR=1.14 per 5 kg/m2 increase, p=0.0266) conferred significantly greater odds for CKD in T2DM. Female sex (OR=2.26, p=0.0001), retinopathy (OR=2.64, p<0.0001), CHD (OR=2.75, p=0.0032), and CHF (OR=2.21, p=0.0096) signaled greater odds for moderate CKD to kidney failure versus mild-to-moderate CKD (figure 1).

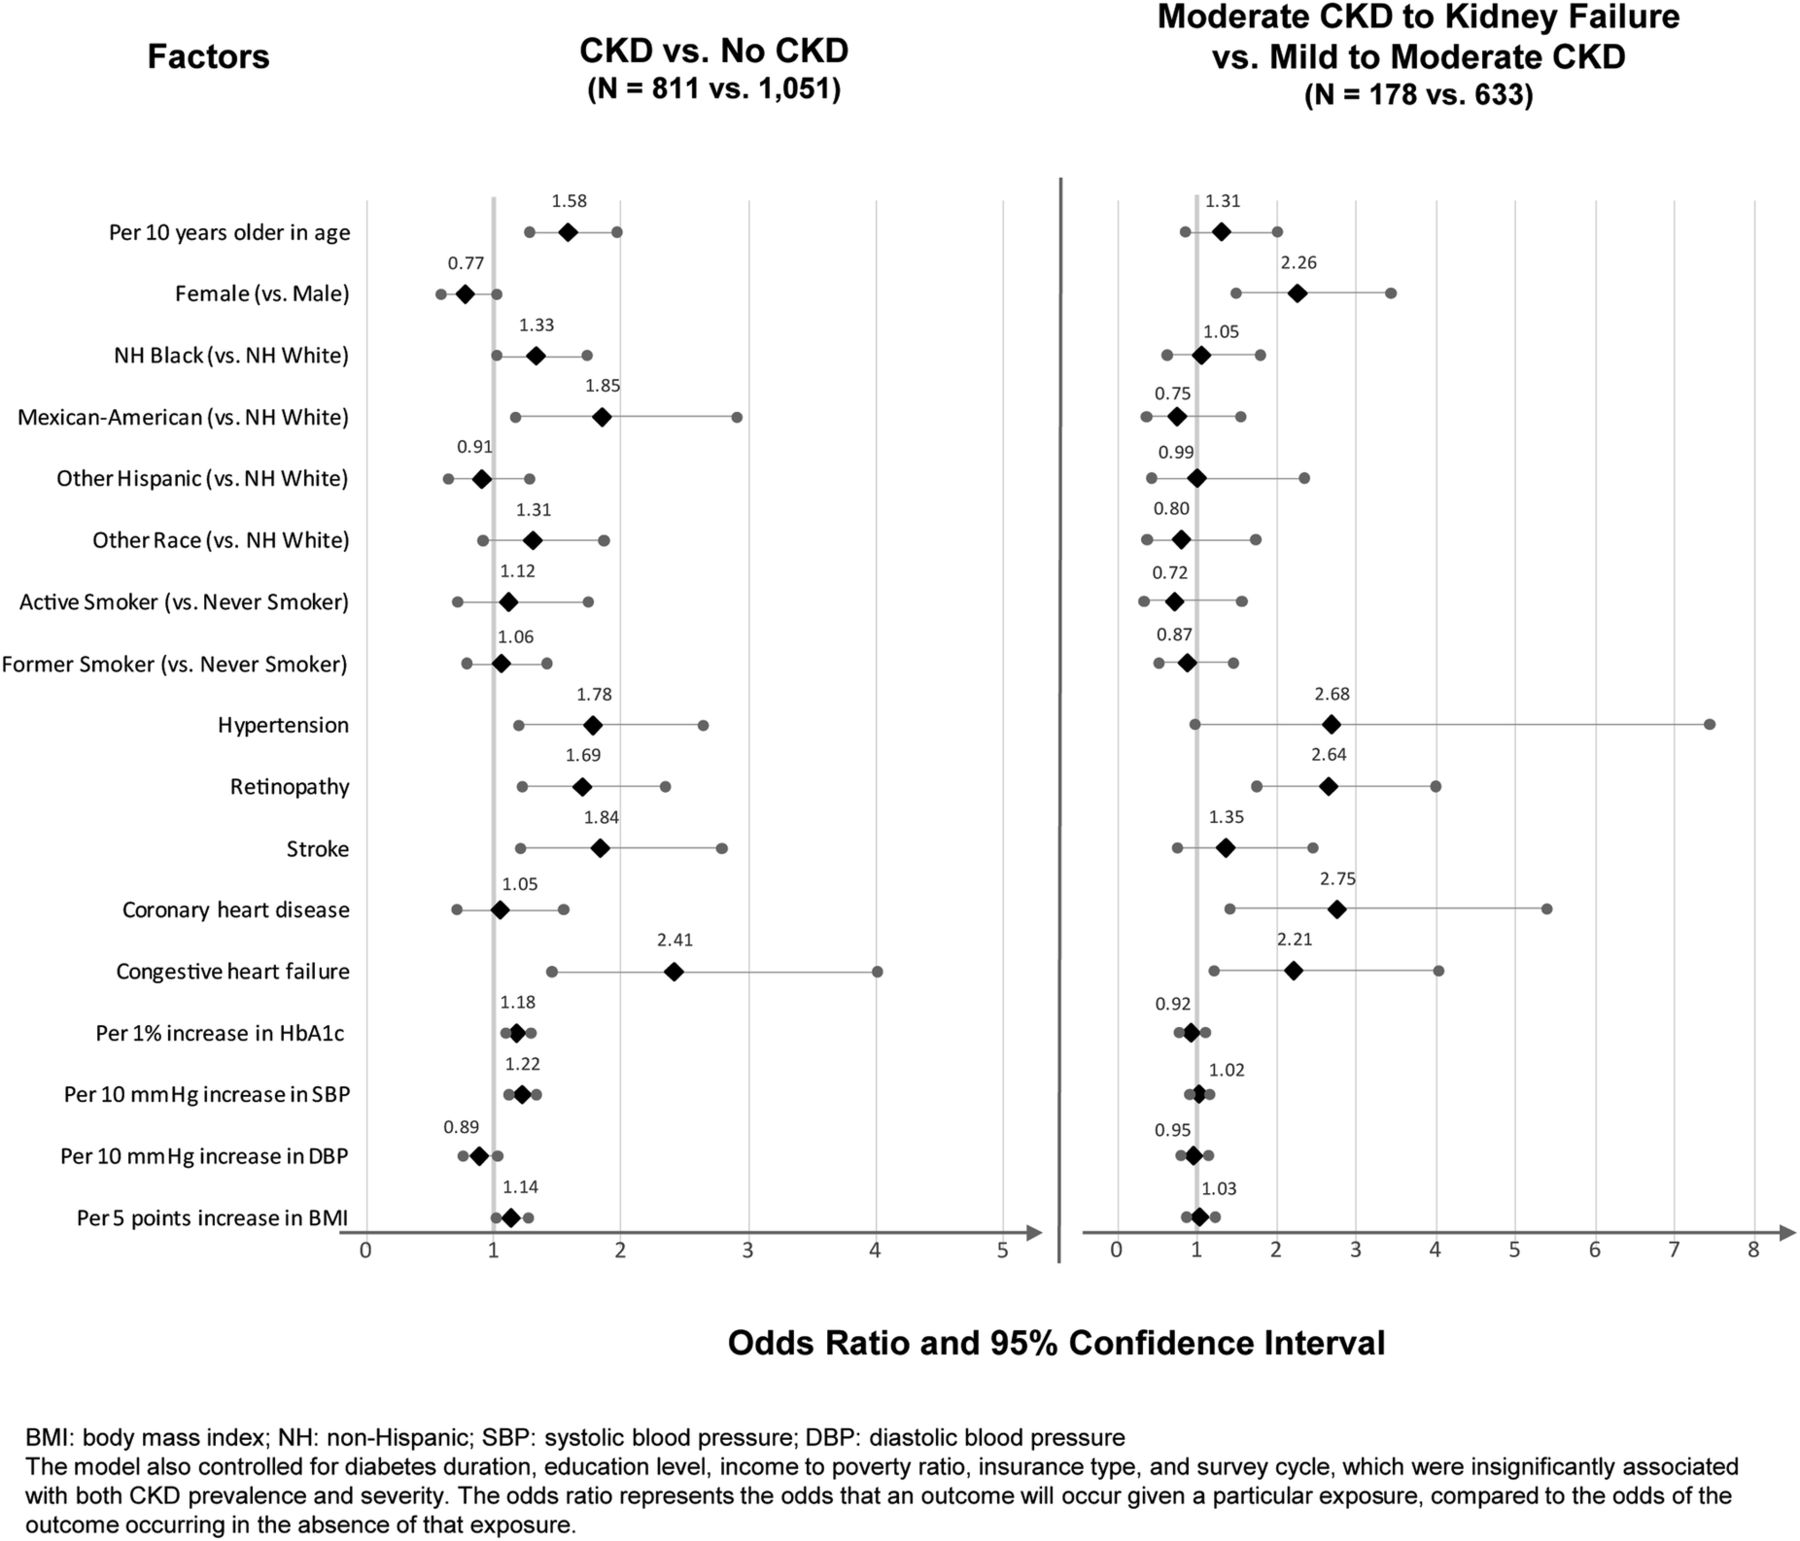
Potential factors associated with the presence and severity of CKD in T2DM.
Discussion
Prior literature has reported that the overall prevalence of CKD in patients with T2DM ranges between 34.5% and 42.3%, with stages 4 and 5 present in <3% of individuals with T2DM.1–6 Studies by Plantinga et al6 and Bailey et al3 have suggested that CKD stage 3a (10.0–12.9%) is more than twice as common as stage 3b (4.1–5.8%) in the general diagnosed T2DM population. Using the most recent data from NHANES during 2007–2012, this study found that the overall prevalence of CKD in individuals with T2DM was estimated to be 38.3%—with 11.2% for stage 3a, 5.5% for stage 3b, and 3.1% for stages 4 and 5 combined—and consistent with previously reported estimates. This study, however, contributes new information demonstrating that the prevalence of CKD among individuals with T2DM remained relatively constant from 2007 to 2012. This finding could be of relevance to policymakers, healthcare providers, and payers who have to allocate resources to manage the T2DM population, and support ongoing efforts to reduce the prevalence of CKD.
In a study that used NHANES data before 2008, no significant differences in the prevalence of CKD among whites (34.6–38.2%), blacks (33.5–37.5%), and Mexican-Americans (30.2–32.7%) were reported.4 However, our study found that CKD was more prevalent among blacks (48.8%) and Mexican-Americans (43.5%) compared with whites (38.7%) from 2007 to 2012. It was noteworthy that 73.6% of CKD cases in Mexican-Americans with T2DM and 47.4% of CKD cases in blacks with T2DM were at stages 1 and 2. ESRD was two to three times more prevalent among blacks compared with other races and ethnicities. This is consistent with a study by Burrows et al15 that reported incidence of ESRD in diabetes among blacks as four times higher than in whites, and two times higher than that in Hispanics. These results are important to understand in the context of the changing ethnic and racial makeup of the USA, especially as the Mexican-American population continues to grow.25 Culturally competent healthcare solutions are required to address this issue from the individual patients' perspective and a population basis. In addition, ample evidence suggests that racial and ethnic minorities, especially blacks and Mexican-Americans, have poorer access to quality healthcare than whites in the USA.26–37 These findings highlight the significant need to improve access to healthcare services for Mexican-Americans and blacks so that aggressively combining early detection strategies with delivery of evidence-based therapeutic interventions at early stages can help prevent CKD progression. However, caution must be used in the overall interpretation of the results stratified by race due to some small sample sizes, especially in CKD stages 3b–5. De Boer et al4 examined three NHANES datasets and found that the elderly (≥65 years) had a prevalence of diabetic nephropathy, defined as urinary albumin:creatinine ratio (UACR)≥30 mg/g and eGFR <60 mL/min/1.73 m2, roughly double that of adults aged 20 to <65 years (49.5–51.2% vs 24.6–28.0%). Our results are consistent with these findings, as we observed 58.7% of individuals with T2DM ≥65 years and 25.7% of those <65 years had CKD. This demonstrates the need for future research focusing on the management of this high-risk T2DM population given that oral antidiabetes treatment options become increasingly limited with reducing renal function.
Although CKD is less common in the younger T2DM population, it should be noted that one in four individuals with T2DM younger than 65 years has CKD. That 73.2% of CKD cases identified in this younger T2DM population were at early stages highlights a substantial opportunity for clinicians to employ aggressive early detection strategies coupled with evidence-based therapies for slowing the progression of CKD.
The prevalence of CKD in T2DM was similar for men and women (40.0% vs 38.7%), which to our knowledge has not been previously reported and a solid reminder about the needs to screen and allocate resources equitably among both sexes. This study also showed that women with T2DM tended to have slightly higher prevalence of more severe CKD compared with men with T2DM. This merits further study to examine whether this is a reflection of survivor bias or represents a true difference in the pathophysiology of CKD between sexes.
Appropriate control of hyperglycemia and BP is essential to prevent the development and progression of CKD in the T2DM population.38–40 The most commonly recommended therapeutic target for glycemic control during the study period was an HbA1C <7%, although less stringent goals such as <8% based on various patient and disease factors were also considered appropriate during the later time period of the study.41–43 In this study, we found 55.6% and 76.6% of the overall T2DM population achieved HbA1C <7% and <8%, respectively, and the rate of goal attainment was lower in CKD stages 1 and 2 compared with stages 3a–5. Notably, this disparity in HbA1c levels and goal attainment <7% was most appreciable between patients in stages 1 and 5. Given that HbA1c tends to underestimate glycemic control among individuals with diabetic hemodialysis, glycemic control may be even better in severe stages of CKD than what was seen in this study.44 This may well reflect that patients with T2DM with stage 5 CKD are more frequently accessing specialist-driven healthcare and for whom the importance of obtaining specific glycemic control is greatly stressed. Patient factors associated with stage 5 CKD such as decreased weight and appetite may also play a role. In addition, the less aggressive nature of the hyperglycemia treatment in patients with T2DM with stage 1 CKD may reflect an opportunity for more aggressive therapy earlier in the manifestation of CKD.
The suggested therapeutic goal for BP control was <140/80 mm Hg as per the ADA guidelines.24 ,41 The data showed that mean SBP was not well controlled in later stages of CKD. In contrast, mean DBP was lower than the 80 mm Hg target in all CKD stages. These data highlight that there is an opportunity for improved BP control in patients without CKD or in the early stages of CKD. Attainment of BP control during this time is of increased importance as these efforts become even more difficult in the face of the pathophysiological and biochemical changes associated with renal disease progression.24 ,41 ,45
To control hyperglycemia, antidiabetes medications were widely used in this population. The prescribing pattern for each antidiabetes medication class reflected treatment guideline recommendations for individuals with impaired renal function. For example, although there are some uncertainties regarding its use across the CKD spectrum,46 the use of metformin was significantly limited with increasing CKD severity, as metformin is contraindicated in patients with severe CKD (stage 4) or kidney failure (stage 5).47 The use of insulin increased sharply in severe CKD stages, consistent with the fact that the use of insulin is not restricted by renal function status and insulin may be titrated upward in efforts to attain glycemic goals.48 ,49 The use of SUs increased in later CKD stages (3b and 4), probably reflective of limited restrictions in light of worsening renal function on use of the most common agents in the class (glimepiride and glipizide) except for glyburide.50 SU use plummeted in CKD stage 5 which may reflect concerns regarding hypoglycemia in the presence of renal failure. These descriptive patterns suggest likely benefits of insulin therapy in this cohort of patients with T2DM and CKD, as those with stage 5 CKD had high insulin use and attained HbA1c below 7%. In view of the low rates of HbA1c target achievement in stages 1 and 2 CKD, consideration of different pharmacotherapeutic strategies incorporating additional antidiabetes medications in earlier stages of CKD may be warranted.
To manage their BP, antihypertensive medications were used extensively in this population, especially in those with moderate-to-severe renal function impairment. While concerns regarding hyperkalemia and other adverse effects may be observed more frequently in a CKD population as renal function worsens, the data for this diabetic cohort showed a consistent level of RAAS inhibitor (including ACE inhibitors and ARBs) use throughout, even in patients without CKD and with mild-to-moderate CKD. This usage pattern is consistent with NKF KDOQI guidelines, which indicate the ACE inhibitors and ARBs effectively slow the progression of kidney disease among hypertensive individuals who have T2DM.51 However, it is important to note that fewer than two-thirds (62%) of this T2DM cohort were taking some form of RAAS inhibitor, even though the benefits of RAAS inhibition are widely recognized in this population.52 β-Blocker use increased in individuals with stages 4 and 5 CKD, paralleling the rising prevalence of CAD and MI in patients with later-stage CKD. Use of thiazide diuretics was more prevalent than other diuretic agents among individuals with mild-to-moderate CKD, while it was replaced by loop diuretics among those with moderate CKD to kidney failure, consistent with guideline recommendations.51
The two multivariable logistic regression models examined the magnitude of associations between CKD presence and severity in individuals with T2DM and potential demographic and clinical factors. These findings support previous research identifying the potential demographic and clinical factors of CKD in the T2DM population, and importantly demonstrate that the presence and the severity of CKD are associated with different factors. Advanced age, black race, having hypertension, stroke, higher HbA1c, and higher SBP are factors for having CKD versus not having CKD but not factors of having more severe CKD in the subset of those who had CKD; on the other hand, female sex and the presence of retinopathy and CHD are factors associated with more severe CKD. These data may contribute to improved disease management by targeting corresponding associated factors based on whether the intervention goal is to reduce CKD incidence or slow CKD progression.
Strengths of this study include the use of nationally representative data that allowed us to reliably estimate disease prevalence. Additionally, the data included standardized laboratory tests, comprehensive data collection from respondents, and individual respondent response assessments. By drawing from the three most recent cycles of the NHANES data, this study had an adequate sample size to generate precise population estimates. Prescription and laboratory test data in NHANES also allowed us to assess prescription use patterns and laboratory values in populations of interest.
Limitations
The cross-sectional nature of the data limited our ability to capture CKD progression within individuals, which impacts the interpretation of the factors associated with CKD and severity of CKD. NHANES data do not differentiate T1DM and T2DM directly; thus, a proxy algorithm based on age at diagnosis, the medication questionnaire, and the physical medication assessment was used. However, the physical medication assessment information was not available for 2011 and 2012, thus limiting our sample size in these analyses. In addition, NHANES prescription data only contain drug information at the class level; thus, treatment-level information, such as dosing, was not available. Family history of CKD is not captured in the NHANES data; thus, it was not possible to examine the strength of its association with the presence and severity of CKD in T2DM in this study. Last, these results may only be generalized to non-institutionalized individuals.
Conclusion
In this nationally representative population, our findings highlight that CKD, primarily early stages, is prevalent among individuals with T2DM, and more so in blacks and Mexican-Americans, for whom interventions may be targeted to slow and/or prevent the progression of kidney function disease. The prevalence of CKD has remained fairly consistent over time, suggesting that current efforts to prevent CKD could be improved on overall, and that the aforementioned populations may warrant even closer targeting for intervention. Individuals not generally screened for CKD, such as younger individuals with T2DM, may also warrant attention. In addition, the results demonstrate that a more limited set of antidiabetes medications were used in later CKD stages and that glycemic control was suboptimal in early-stage CKD, which may lead to consideration of more aggressive treatment when renal function is better preserved and more therapeutic options are available. Finally, this study found that the presence and the severity of CKD were associated with different demographic and clinical factors.
Acknowledgments
Bernard B. Tulsi, MSc, provided writing and other editorial support for this manuscript, which was funded by AstraZeneca.
References
Footnotes
Contributors BW, DK, OT, SV, and VW were responsible for data sourcing, study concept or design, protocol development analysis or interpretation of data, statistical analysis, study supervision or coordination, and drafting/revising the manuscript for content, including medical writing and editing for content. KB, AS, and IK were responsible for drafting/revising the manuscript for content, including medical writing for content, and played central roles in study concept or design, analysis or interpretation of data, statistical analysis, study supervision, or coordination.
Funding This work was conducted by HealthCore, Inc., an independent consulting firm, and was supported by AstraZeneca Corporation.
Competing interests BW, DK, OT, SV (at the time of the study), and VW are salaried employees of HealthCore, Inc. They received no specific or additional compensation for their work on this project. KB and IK (at the time of the study) are full-time employees of AstraZeneca Corporation. AS (at the time of the study) is a consultant of Bristol-Myers Squibb Company.
Provenance and peer review Not commissioned; externally peer reviewed.
Data sharing statement The study's authors commit to full transparency in this work. To the extent allowed by their institutions' policies, they will be willing to provide applicable study data and cooperate on the acquisition of additional data, if needed. Wherever permitted by their organizations' policies, the authors will make every effort to provide the editors with additional details on the study protocol, research methodologies, and supplemental data as might be necessary to evaluate this work.