Article Text

Abstract
Background Adiponectin levels display ethnic disparities, and are inversely associated with the risk of type 2 diabetes (T2DM). However, the association of adiponectin with prediabetes risk in diverse populations has not been well-studied. Here, we assessed baseline adiponectin levels in relation to incident prediabetes in a longitudinal biracial cohort.
Research design and methods The Pathobiology of Prediabetes in A Biracial Cohort study followed non-diabetic offspring of parents with T2DM for the occurrence of prediabetes, defined as impaired fasting glucose and/or impaired glucose tolerance. Assessments at enrollment and during follow-up included a 75 g oral glucose tolerance test, anthropometry, biochemistries (including fasting insulin and adiponectin levels), insulin sensitivity and insulin secretion. Logistic regression was used to evaluate the contribution of adiponectin to risk of progression to prediabetes.
Results Among the 333 study participants (mean (SD) age 44.2 (10.6) year), 151(45.3%) were white and 182 (54.8%) were black. During approximately 5.5 (mean 2.62) years of follow-up, 110 participants (33%) progressed to prediabetes (N=100) or T2DM (N=10), and 223 participants (67%) were non-progressors. The mean cohort adiponectin level was 9.41+5.30 μg/mL (range 3.1–45.8 μg/mL); values were higher in women than men (10.3+5.67 μg/mL vs 7.27+3.41 μg/mL, p<0.0001) and in white than black offspring (10.7+5.44 μg/mL vs 8.34+4.95 μg/mL, p<0.0001). Adiponectin levels correlated inversely with adiposity and glycemia, and positively with insulin sensitivity and high-density lipoprotein cholesterol levels. Baseline adiponectin strongly predicted incident prediabetes: the HR for prediabetes per 1 SD (approximately 5 μg/mL) higher baseline adiponectin was 0.48 (95% CI 0.27 to 0.86, p=0.013).
Conclusions Among healthy white and black adults with parental history of T2DM, adiponectin level is a powerful risk marker of incident prediabetes. Thus, the well-known association of adiponectin with diabetes risk is evident at a much earlier stage in pathogenesis, during transition from normoglycemia to prediabetes.
- Adiponectin
- Insulin Sensitivity
- Impaired Fasting Glucose
- Impaired Glucose Tolerance
This is an Open Access article distributed in accordance with the Creative Commons Attribution Non Commercial (CC BY-NC 4.0) license, which permits others to distribute, remix, adapt, build upon this work non-commercially, and license their derivative works on different terms, provided the original work is properly cited and the use is non-commercial. See: http://creativecommons.org/licenses/by-nc/4.0/
Statistics from Altmetric.com
Key messages
In a large sample of healthy African-American and Caucasian offspring of parents with type 2 diabetes, higher adiponectin levels are associated with a favorable cardiometabolic profile, characterized by lower measures of adiposity and glycemia, lower triglyceride levels, and higher high-density lipoprotein cholesterol levels.
Using the rigorous methodologies of hyperinsulinemic euglycemic clamp and frequently sampled intravenous glucose tolerance test, this study demonstrates that plasma adiponectin levels are correlated directly with insulin sensitivity and inversely with insulin secretion in healthy African-Americans and Caucasians.
This study is the first to demonstrate that baseline plasma adiponectin levels predict progression from normoglycemia to prediabetes in African-Americans and Caucasians, despite the known ethnic differences in adiponectin levels.
Introduction
Adiponectin, the most abundant secreted product of adipocytes, is strongly correlated with cardiometabolic risk.1–4 Several previous studies have shown that adiponectin levels are positively associated with insulin sensitivity, and inversely associated with the development of diabetes and progression from prediabetes to type 2 diabetes (T2DM).1 ,5–11 The development of T2DM in individuals at genetic risk is punctuated by a variable interlude of prediabetes, defined as impaired fasting glucose (IFG) and/or impaired glucose tolerance (IGT).12–16 Persons with IGT or IFG develop T2DM at an annual rate of approximately 10%.17 Although the evidence linking adiponectin to diabetes risk is strong,1–11 the chronology of the association between adiponectin status and glucose homeostasis has not been fully determined. Specifically, the potential role of adiponectin in modulating early glucose abnormalities during transition from normoglycemia to prediabetes is a subject of significant interest. Since both the prevalence of T2DM and the distribution of plasma levels of adiponectin display significant racial/ethnic disparities,18–22 it is important to assess the fidelity of the interaction between adiponectin and dysglycemia in a diverse population.
The Pathobiology of Prediabetes in A Biracial Cohort (POP-ABC) study is a prospective, natural history study of incident prediabetes in African-Americans and European Americans who have one or both biological parents with T2DM.23–25 Subjects who qualified for this study were by definition at increased risk of future diabetes, on the basis of their parental history.26 Recently, we reported that the incidence of prediabetes among initially normoglycemic participants enrolled in the POP-ABC study was approximately 11%/year.27 However, it remains to be determined whether the association observed between adiponectin levels and the risk of T2DM extends to prediabetes as well. Here, we have tested the hypothesis that higher adiponectin levels at baseline are associated with decreased rates of progression to prediabetes in our biracial cohort.
Research design and methods
Study subjects
The study subjects were participants in the POP-ABC study.23–25 Eligibility criteria for the POP-ABC study included age 18–65 years; self-reported non-Hispanic white (European American) or non-Hispanic black (African-American) race/ethnicity status; one or both biological parents with T2DM; no evidence of diabetes; normal fasting plasma glucose (FPG) (<100 mg/dL(5.6 mmol/L)) and/or normal glucose tolerance (NGT) (2 h plasma glucose (2 hPG) <140 mg/dL (7.8 mmol/L) during a 75 g oral glucose tolerance test (OGTT)); and good overall health, as previously described.23–25
The exclusion criteria were prevalent diagnosis of diabetes; use of antidiabetes medications or medications known to alter blood glucose; enrollment in behavioral, pharmacological, or other active weight loss program; history of liposuction or bariatric surgery; current pregnancy or being within 12 months postpartum; and any recent hospitalization (within 6 weeks of the screening visit).23–25
Individuals self-reported their race/ethnicity, based on the 1990 U.S. Census questionnaire.28 Parental history of T2DM was documented using a diabetes-focused questionnaire that captured information on the number of affected biological parents, parent's gender and age at diagnosis, use of antidiabetes medications, diabetes complications and contact information of the parents’ physicians.23–25 ,27 The study protocol was approved by the Institutional Review Board; all participants gave written informed consent before initiation of the study, which was conducted at the University of Tennessee General Clinical Research Center (GCRC).
Assessments
Enrolled participants arrived at the GCRC after an overnight fast for baseline assessments, which included a structured medical interview and a general physical examination; measurement of weight, height, waist circumference and blood pressure; and a standard 75 g OGTT.23 ,25 ,27 The body-mass index (BMI) was calculated as the weight in kilogram divided by the height in meter squared. The OGTT was preceded by written instructions to consume a usual diet with adequate carbohydrates, refrain from strenuous exercise and alcohol consumption for 24 h, and avoid smoking in the morning of the test. The test was initiated between 07:00 and 11:00 in participants who had been fasting for approximately 10–14 h: venous blood specimens for glucose measurement were obtained before (0 min) and at 30 min and 120 min after ingestion of 75 g flavored glucose (Trutol 75; Custom Laboratories, Baltimore, Maryland, USA). Additional baseline measurements included glycated haemoglobin (HbA1c), fasting lipid profile, insulin and adiponectin levels. The homeostasis model of insulin resistance (HOMA-IR) was derived from fasting glucose and insulin values.29 Following the baseline visit, FPG was measured quarterly and OGTT annually, in addition to other prespecified assessments (including anthropometry, clinical examination, biochemistries, body composition, insulin secretion and insulin sensitivity by hyperinsulinemic euglycemic clamp), as previously described.23 ,25 ,27
Insulin sensitivity and insulin secretion
In brief, the hyperinsulinemic euglycemic clamp procedure was performed in participants who had fasted overnight for approximately 12 h. A primed, continuous intravenous infusion of regular insulin (2 mU/kg/min;14.4 pmol/kg/min) was administered for 180 min while blood glucose concentration was maintained at approximately 100 mg/dL (5.6 mmol/L) with a variable rate dextrose (20%) infusion. Arterialized blood specimens for measurement of glucose and insulin levels were obtained every 10 min. The rate of total insulin-stimulated glucose disposal (M) was calculated for the past 60 min of insulin infusion, and corrected for steady-state plasma insulin levels, to derive the insulin sensitivity index (Si-clamp).30 ,31
The frequently sampled intravenous glucose tolerance test (FSIVGTT) was used for the direct assessment of insulin secretion.13 ,27 After an overnight fast, participants received an intravenous bolus of dextrose (25 g). Arterialized blood samples for the measurement of glucose and insulin levels were collected 30 min before and at 2, 3, 4, 5, 7 and 10 min following the intravenous dextrose bolus.13 ,27 The acute insulin response (AIR) was computed as the mean incremental insulin concentration from 3 to 5 min after the dextrose bolus.13 ,27
Biochemical measurements
Plasma glucose was measured with a glucose oxidase method (Yellow Spring Instruments Co, Inc, Yellow Spring, Ohio, USA). Plasma levels of insulin and adiponectin were measured immunochemically in our Endocrine Research Laboratory, using commercial ELISA kits. The total adiponectin assay (ELISA kit EZHADP-61K, Millipore, St. Charles, Missouri, USA) captured all the multimeric forms of circulating adiponectin, with a sensitivity of 0.78 ng/mL and within-batch and between-batch coefficients of variation of 1.8% and 6.2%, respectively. HbA1c and fasting plasma lipid profiles were measured in a contract clinical laboratory.
Definition of outcome measures
The primary outcome was the occurrence of prediabetes (IFG and/or IGT) or diabetes.27 For all partiicipants, any occurrence of diabetes, as indicated by an FPG value of 126 mg/dL (7.0 mmol/L) or higher or 2 hPG of 200 mg/dL (11.1 mmol/L) or higher, or prescription of a diabetes medication, was an end point. Of the enrollees, 75% met the dual criteria of having normal FPG and NGT, and 25% had either normal FPG or NGT at baseline. For participants enrolled with normal FPG and NGT, the occurrence of IFG and/or IGT constituted an end point. For those enrolled with normal FPG (and isolated IGT), progression to IFG constituted an end point. For those enrolled with NGT (and isolated IFG), progression to IGT was an end point.27 A confirmatory test was performed within 6 weeks for each end point occurrence. The 75 g OGTT was the method of confirmation. All end points were independently adjudicated by the Institutional Data and Safety Officer (Murray Heimberg, MD, PhD).
Statistical analysis
Data were reported as means±SD. Differences between defined groups were analyzed using unpaired t tests for continuous variables and χ2 test for categorical variables. General linear regression models were used to compare anthropometric and metabolic characteristics between African-Americans and Caucasians and between participants who experienced glycemic progression and no-progressors. The relationship between log-transformed adiponectin concentrations (to achieve a more normal distribution) and anthropometric and metabolic variables was analyzed using Pearson correlation coefficients. Logistic regression models were used to analyze baseline adiponectin values as predictors of incident diabetes/prediabetes, after adjustments for age, sex and BMI. All statistical analyses were performed with the use of SAS statistical software, V.9.3 (SAS Institute Inc, Cary, North Carolina, USA).
Results
Cohort description
A total of 376 offspring of parents with T2DM (217 black, 159 white), who met all eligibility criteria, were enrolled in the main POP-ABC study.24 ,25 The 333 study offspring who had complete adiponectin values and evaluable follow-up data are included in the present report. Of the 333 participants, 151(45.3%) were white and 182 (54.8%) were black; their mean age was 44.2+10.6 years and BMI was 30.2+7.23 kg/m2. Baseline adiponectin levels were widely distributed among POP-ABC study participants; values ranged from 3.14 to 45.8 μg/mL, in a skewed distribution. The median adiponectin value was 7.96 μg/mL, and the mean value was 9.41 μg/mL. The previously reported gender and ethnic differences in adiponectin levels 20–22 were evident in our cohort: values were higher in women than men (10.3+5.67 μg/mL vs 7.27+3.41μg/mL, p<0.0001) and in white offspring than black offspring (10.7+5.44 μg/mL vs 8.34+4.95 μg/mL, p<0.0001). At enrollment, the black participants had higher BMI and HbA1c values, and lower age and FPG levels, compared to white participants (table 1).
Baseline characteristics and adiponectin levels in 333 offspring of parents with type 2 diabetes
Metabolic correlates of adiponectin
We observed significant univariate relationships between adiponectin and several metabolic variables in our biracial cohort. Plasma adiponectin concentration was negatively correlated with BMI, waist circumference, blood pressure, FPG, triglycerides, fasting insulin, HOMA-IR and insulin secretion, and positively correlated with age, HDL cholesterol and insulin sensitivity (table 2 and figure 1). These associations were nominally and directionally consistent, though of variable strengths, in black and white participants (table 2 and figure 1). The strongest associations that were concordant in both ethnic groups were between baseline adiponectin and waist circumference (Black r=−0.45, p<0.0001; White r=−0.28, p=0.0006), FPG (Black: r=−0.34, p=<0.0001; White r=−0.20, p=0.015), HDL cholesterol (Black r=0.53, p<0.0001; White r=0.50, p<0.0001), triglycerides (Black r=−0.37, p<0.0001; White r=−0.35, p<0.0001) and insulin secretion (AIR) (Black r=−0.17; p=0.024; White r=−0.21, p=0.011; table 2). The association of adiponectin levels with age was much stronger in white participants than black participants, whereas the association with measures of insulin sensitivity (fasting insulin, HOMA-IR and Si-clamp) was much stronger in African-American participants than European American participants (table 2).
Univariate associations of adiponectin with age and metabolic variables
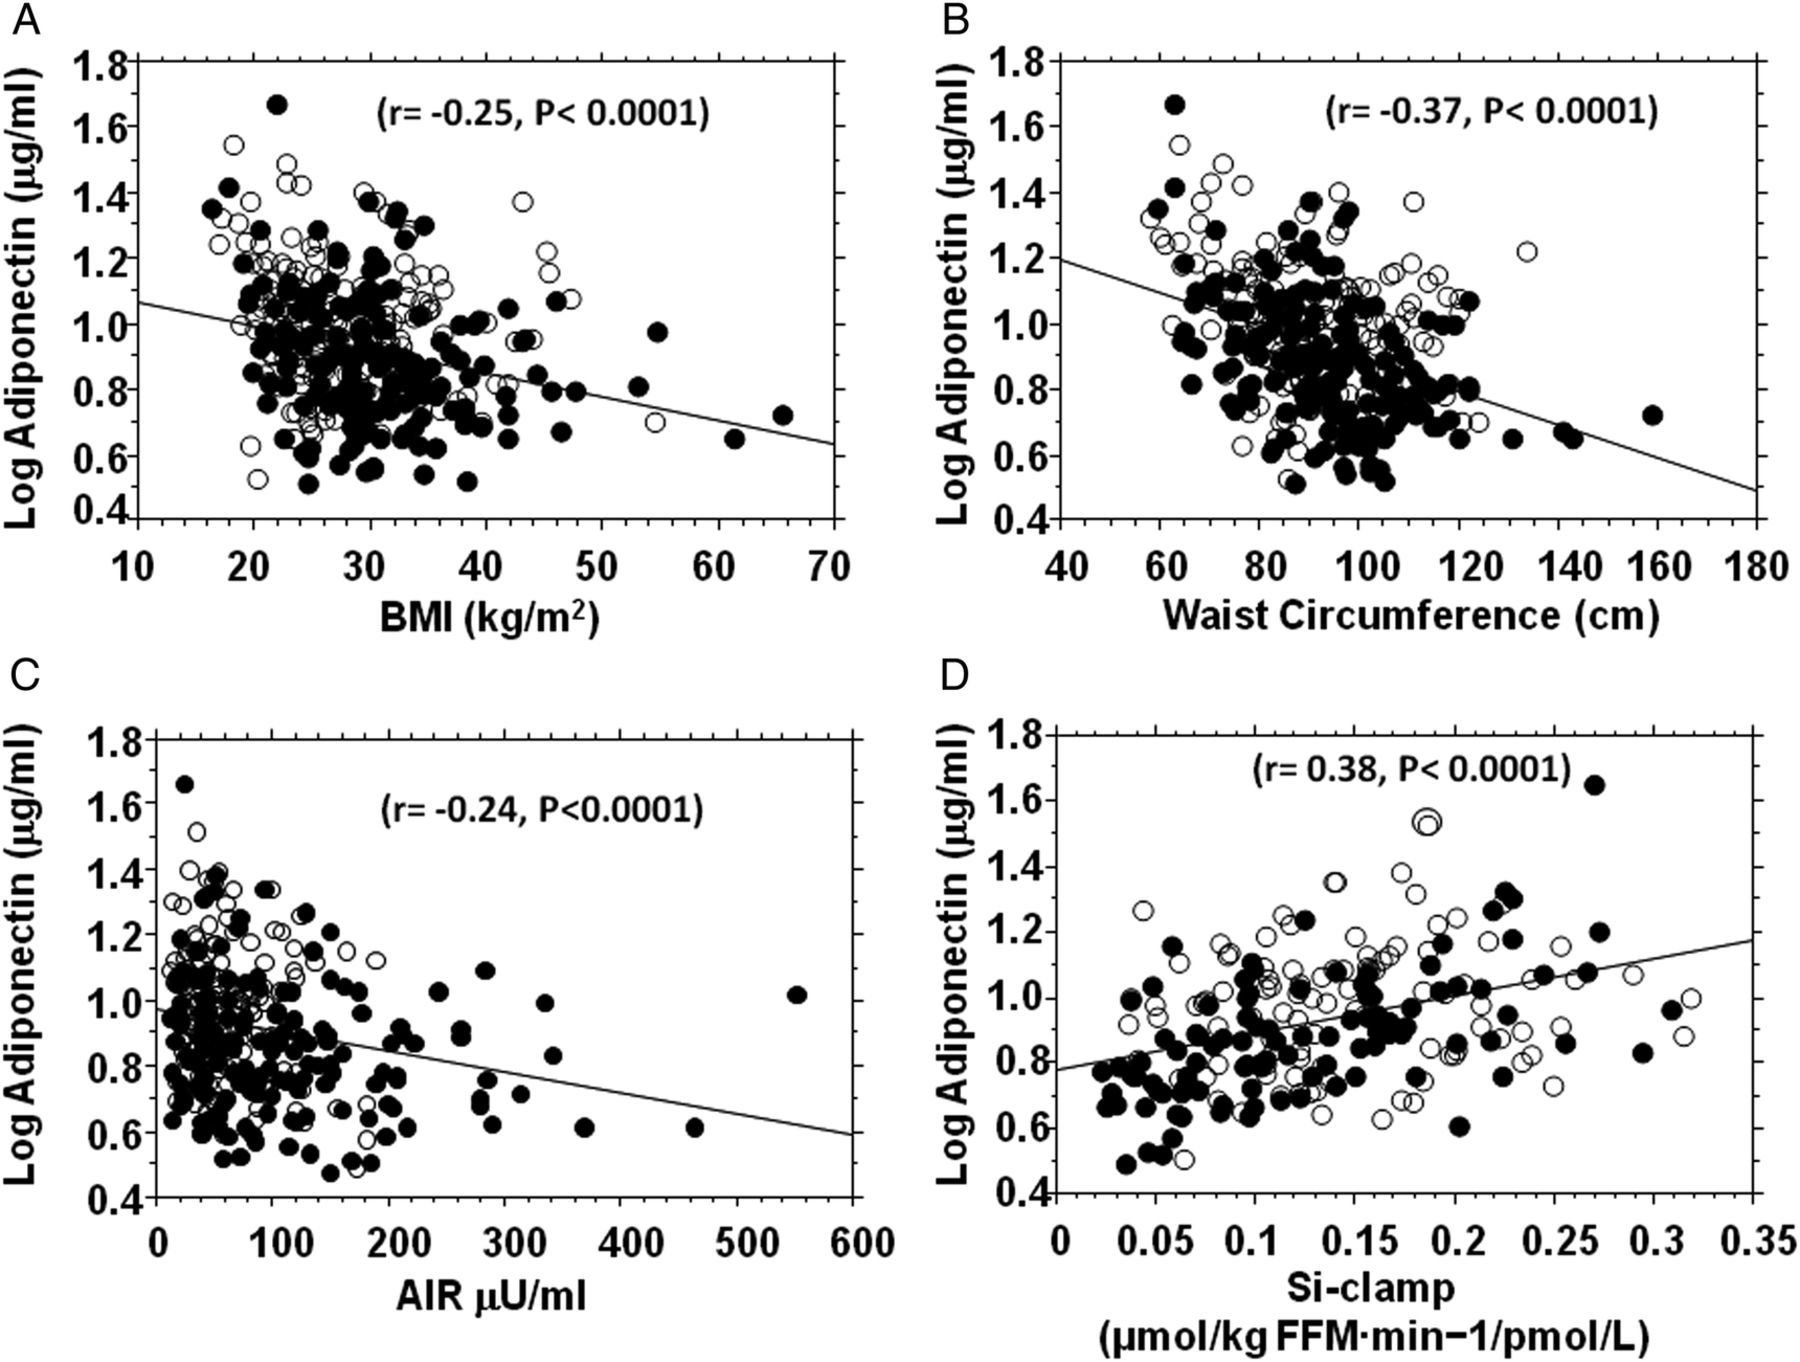
Fasting plasma adiponectin concentration in relation to body mass index (BMI) (A), waist circumference (B), acute insulin response (AIR) (C) and insulin sensitivity (Si-clamp) (D) in non-diabetic black (closed circles) and white (open circles) offspring of parents with type 2 diabetes. Acute insulin secretory response was assessed using the frequently sampled intravenous glucose tolerance test (N=300 (163 black, 137 white) and insulin sensitivity was measured by hyperinsulinemic euglycemic clamp (N=203(103 black, 100 white)).
Adiponectin and progression to prediabetes
During approximately 5.5 years of follow-up (mean 2.62 years), 110 participants (33%, ‘Progressors’) developed prediabetes (N=100) or diabetes (N=10), and 223 participants (67%) remained free of incident prediabetes/diabetes (‘Non-progressors’). In our previous report, it was noted that POP-ABC participants who progressed to prediabetes/diabetes had higher age, BMI and FPG at baseline, and were more likely to be male, but self-reported race/ethnicity was not a predictor of glycemic progression.27 In the present report, participants who progressed to prediabetes/diabetes had a lower mean plasma adiponectin level at baseline, compared with non-progressors, (8.37+4.02 μg/mL vs 9.92+5.77 μg/mL, p=0.012). The median value for adiponectin was 7.13 μg/mL (range 3.14–23.1) in progressors and 8.54 μg/mL (range 3.18–45.8) in non-progressors. To account for the gender and ethnic differences in adiponectin levels, we examined the relationship between adiponectin and glycemic progression status separately in men and women, and in black and white participants. Our analysis showed that the pattern of lower plasma adiponectin levels in progressors compared to non-progressors was consistent across ethnicity and gender (figure 2). In logistic regression models, adiponectin levels (adjusted for age and sex) were inversely associated with progression to prediabetes/diabetes: the OR (95% CI) was 0.48 (95% CI 0.27 to 0.86), p=0.013 (table 3). After additional adjustment for BMI, the OR was 0. 61(95% CI 0.32 to 1.14), p=0.12 (table 3). Thus, a 1-SD (approximately 5 μg/mL) higher baseline adiponectin level was associated with approximately 40% lower rate of progression to prediabetes.
Logistic regression models of adiponectin as a predictor of prediabetes*

Plasma adiponectin levels by race/ethnicity (1A) and gender (1B) among study participants who developed prediabetes/diabetes (Progressors, P) compared to those who remained free of incident prediabetes (Non-Progressors, NP) *p=0.012, Progressor versus Non-progressor groups.
Discussion
In our biracial cohort study of healthy offspring of patients with diabetes, we found an inverse association between adiponectinemia and the risk of incident prediabetes/diabetes during longitudinal follow-up. Among initially normoglycemic persons, an approximately 5 μg/dL higher baseline plasma adiponectin level corresponded to approximately 40% lower rate of progression to prediabetes/diabetes during a mean follow-up period of 2.6 years. Among the 110 participants who reached an end point, only 10 participants progressed directly to T2DM, whereas the vast majority (100 participants) progressed to prediabetes. Thus, our findings are particularly germane to the pathobiology of prediabetes. Despite the well-known ethnic and gender differences in plasma adiponectin levels,20–22 which were evident in the present study, the association of adiponectin status with incident prediabetes was quite consistent across gender and ethnicity in our cohort of African-Americans and European Americans with parental history of T2DM. The point estimates of decreased risk for prediabetes were of the same order of magnitude in black and white offspring (0.44 and 0.48, respectively), although the 95% CI was wider among the latter. Notably, adjustment for BMI increased the adiponectin-associated OR for prediabetes from 0.48 to 0.61, with a wider 95% CI. However, the observation of a nominal reduction (approximately 40%) in the risk of incident prediabetes, despite adjustment for BMI, suggests that the decreased prediabetes risk associated with higher baseline adiponectin levels is partly but not entirely mediated by adiposity-related mechanisms.
Several previous cross-sectional and longitudinal studies have established that low adiponectin levels are associated with increased risk of T2DM.5–11 In the prospective Diabetes Prevention Programme (DPP), which enrolled participants with prediabetes, an approximately 3 μg/mL higher baseline adiponectin level predicted a 20–40% lower risk of progression to T2DM during approximately 3 years of follow-up.11 In the present report, we found that an approximately 5 μg/mL (1 SD) higher baseline adiponectin levels predicted a 40% lower risk of progression from normoglycemia to prediabetes. The latter finding indicates that the association of adiponectin with diabetes risk is evident at a much earlier stage in the pathogenesis of dysglycemia. Thus, the ability to maintain high adiponectin production might be protective of dysglycemia in persons at high risk for T2DM, whereas hypoadiponectinemia could be a risk factor for the initiation of early glucose abnormalities leading to prediabetes and diabetes.
These notions are consistent with the favorable cardiometabolic profile of adiponectin that has emerged since its discovery.1–11 ,32 ,33 The mechanisms whereby adiponectin exerts its favorable cardiometabolic effects are not fully understood, but could involve improvement in insulin action, decreased inflammatory tone, interaction with fibroblast growth factor (FGF)-21 and amelioration of lipotoxicity, among others.34–39 In rodent models, overexpression of adiponectin is associated with several beneficial effects, including improved metabolic flexibility, decreased inflammatory markers, decreased steatosis, improved insulin sensitivity, decreased apoptosis and preservation of β cell function.35 ,36 An interaction between adiponectin and FGF21, a potent regulator of metabolism and energy utilization, has also been reported.38 ,39 The administration of FGF-21 decreases blood glucose levels and increases insulin sensitivity in mouse models of obesity and insulin resistance, through upregulation of adiponectin expression.39 Furthermore, FGF-21 is involved in the clearance of toxic ceramides in obese animals, and adiponectin-knockout mice appear to be refractory to the ceramide-lowering effects of FGF-21.39 These data indicate that adiponectin may be a critical mediator of the favorable metabolic and insulin-sensitizing effects FGF-21.39 ,40 At the clinical level, the improvement in insulin sensitivity following treatment with PPAR-γ agonists has been shown to be mediated, at least in part, by upregulation of adiponectin expression.41 ,42
From the foregoing, interventions that increase adiponectin levels would be attractive candidates for clinical trials, with the goal of diabetes prevention and improvement in cardiometabolic health. Interventions that have been reported to increase adiponectin levels include exercise,43 weight loss,44 smoking cessation45 and treatment with PPAR-γ agonists,41 ,42 ,46 ,47 PPAR-α agonists,48 ACE inhibitors 49 and angiotensin II receptor blockers.50 In clinical trials, many of the aforementioned interventions have been associated with favorable glucoregulatory outcomes. Indeed, prediabetic participants randomized to the lifestyle intervention arm in the DPP experienced an increase in circulating adiponectin levels, and showed a 58% relative risk reduction in incident diabetes, compared to the placebo group.11
Cross-sectional and longitudinal studies have previously reported a consistent association between low adiponectin levels and prevalent T2DM, impaired glucose homeostasis and an unfavorable cardiometabolic profile.2–11 The present report has several strengths, by extending the previous observations in important directions. First, we demonstrate in a prospective study that the previously reported association of lower adiponectin levels with increased risk of T2DM manifests at a more proximal stage, and is evident during transition from normoglycemia to prediabetes. Second, our findings suggest that the putative mechanisms whereby adiponectinemia interacts with glucose homeostasis to confer protection against dysglycemia are operative even in persons who are among the highest risk groups for diabetes, namely, offspring of parents with T2DM. Third, our findings were obtained from a biracial cohort and were consistent in men and women, indicating that the known gender and ethnic differences in adiponectin expression do not abrogate the interaction between adiponectinemia and glucose homeostasis. Finally, we have used rigorous methods (including hyperinsulinemic euglycemic clamp and FSIVGTT) to acquire novel biracial data on the associations between adiponectinemia and insulin action, insulin secretion and dyslipidemia in otherwise healthy African-Americans and European Americans. Our data indicate that the association of adiponectin with insulin sensitivity is particularly robust among African-Americans (table 2), which suggests that interventions that increase adiponectin secretion may have enhanced insulin-sensitizing potency in African-Americans.
The present report has some limitations related to the population studied: our findings were obtained from offspring of parents with T2DM. As these participants represent a selected group at high risk for diabetes, the strong association between baseline adiponectin levels and incident prediabetes may not be exactly applicable to individuals without a family history of diabetes, or the general population. Also, our analyses focused on baseline adiponectin levels; thus, our assessment did not include the potential effects of changes in adiponectin secretion that may have occurred during the course of the POP-ABC study.
In conclusion, among healthy African Americans and European Americans with parental history of T2DM enrolled in the POP-ABC study, baseline adiponectin levels were inversely related to the risk of incident prediabetes. This predictive relationship was evident, despite gender and ethnic differences in baseline adiponectin levels. Based on our finding, it can be predicted that interventions that boost adiponectin levels may offer protection against the risk of dysglycemia, regardless of gender or ethnicity.
Acknowledgments
The POP-ABC study was supported by Grants R01 DK067269 and R01 DK067269-04S1 from the National Institutes of Health and Grant 7-07-MN-13 from the American Diabetes Association. The authors are indebted to the participants who volunteered for this study.
References
Footnotes
Collaborators Current Samuel Dagogo-Jack, MD (Principal Investigator), Ann Ammons, BS, Fatoumatta Ceesay, BS, Sotonte Ebenibo, MBBS, MPH, Ibiye Owei, MBBS, MPH, Nkiru Umekwe, MBBS, Jim Wan, PhD. Past members: Emmanuel Chapp-Jumbo, MBBS (2009–2011), Chimaroke Edeoga, MBBS, MPH (2007–2013), Ruben Cuervo, MD (2006–2007), Nonso Egbuonu, MBBS (2007–2010), Nicoleta Ionica, MD (2007–2008), Dorota Malinowski, MD (2007–2008). Consultant Steven Haffner, MD; Data and Safety Officer: Murray Heimberg, MD, PhD.
Contributors SE collected data, reviewed and revised the manuscript. YJ and IO collected data, reviewed and revised the manuscript. JW performed statistical analysis, reviewed and revised the manuscript. SD-J is the guarantor.
Funding The funding sources (National Institutes of Health, American Diabetes Association) had no role in the design and execution of the POP-ABC study, or analysis and publication of the data obtained from the study.
Competing interests None declared.
Ethics approval University of Tennessee Institutional Review Board.
Provenance and peer review Not commissioned; externally peer reviewed.
Data sharing statement No additional data are available.