Article Text

Abstract
Background Diabetes mellitus (DM) is a chronic-degenerative disease associated with a high risk of chronic complications and comorbidities. The aim of this study is to estimate the average annual cost incurred by the Italian National Health Service (NHS) for the treatment of DM stratified by patients' comorbidities. Moreover, the model estimates the economic impact of implementing good clinical practice for the management of patients with DM.
Methods Data were extrapolated from administrative database of the Marche Region and specific inclusion and exclusion criteria were developed from a clinical board in order to estimate patients with DM only, DM+1, DM+2, DM+3 and DM+4 comorbidities (cardiovascular disease, neuropathy, nephropathy and retinopathy). Regional data were considered a good proxy for implementing a previously developed cost-of-illness (COI) model from Italian NHS perspective already published. A scenario analysis was considered to estimate the economic impact of good clinical practice implementation in the treatment of DM and its comorbidities in Italy.
Results The model estimated an average number of patients with DM per year in the Marche region of 85.909 (5.5% of population) from 2008 to 2011. The mean costs per patients with DM only, DM+1, DM+2, DM+3 and DM+4 comorbidities were €341, €1,335, €2,287, €5,231 and €7,085 respectively. From the Italian NHS perspective, the total economic burden of DM in Italy amounted to €8.1. billion/year (22% for drugs, 74% for hospitalization and 4% for visits). Scenario analysis demonstrates that the implementation of good clinical practice could save over €700 million per year.
Conclusions This model is the first study that considers real world data and COI model to estimate the economic burden of DM and its comorbidities from the Italian NHS perspective. Integrated management of the patients with DM could be a good driver for the reduction of the costs of this disease in Italy.
- Cost Analysis
- Economic Analysis
- Economic Impact
- Inpatient Diabetes Management
This is an Open Access article distributed in accordance with the Creative Commons Attribution Non Commercial (CC BY-NC 4.0) license, which permits others to distribute, remix, adapt, build upon this work non-commercially, and license their derivative works on different terms, provided the original work is properly cited and the use is non-commercial. See: http://creativecommons.org/licenses/by-nc/4.0/
Statistics from Altmetric.com
Key messages
This study has tried to estimate the economic burden of the patients affected from diabetes in Italy, reporting the data recorded in a central Italy region at national level, and breaking down the results by type and number of comorbidities associated with the diabetic patients.
The cost of hospitalization was the main item of health care costs for the treatment of diabetes in Italy. However, pursuing a policy of appropriate drug treatment and diabetes monitoring could allow a better allocation of resources and potential savings from the NHS perspective.
Applying the scenario analyses, that assume an improvement on the therapeutic management, early diagnosis, appropriate therapy and care, the italian NHS could reduce direct costs between €340 and €980 million each year.
Introduction
Diabetes, mainly type 2 diabetes, is a major health problem with global estimates exceeding 387 million people.1 The mortality rate, particularly for cardiovascular events, in patients with DM is about twice as high as in non-diabetic individuals of similar age.2 Diabetes is also strongly associated with microvascular complications, particularly retinopathy, nephropathy and neuropathy. This makes diabetes a leading worldwide risk factor for morbidity and mortality which accounts for 5.1 million deaths yearly and a cost of US$548 billion in healthcare spending.1 This scenario is expected to worsen with the increasing prevalence of diabetes worldwide.
According to the ARNO observatory (an Italian Network System for the Epidemiological and Economic Surveillance), which identifies individuals with DM through record linkage among prescriptions, hospital admissions, and local diabetes registries, 5.8% of the Italian population live with diabetes, with a progressive and constant increase in the last few years.3
Milestone studies have shown that an intensive glycemic treatment significantly reduces microvascular complications4 ,5 with a moderate positive long-term effect on macrovascular complications.6
Interventions aiming to reduce macrovascular complications (ie, cardiac heart diseases, stroke and peripheral artery disease (PAD)) include an aggressive blood pressure control and the reduction in serum cholesterol (low-density lipoprotein in particular) level.7 ,8
Despite international9 and Italian guidelines for standard medical care of patients with diabetes10 suggesting stringent glycemic control, through measurement of HbA1c and other cardiovascular risk factors such as blood pressure, lipids and microalbuminuria, there is a disappointing accomplishment to such stringent indications11 with negative effects also on the costs of the disease. Diabetes is expensive, mainly for its complications, such as cardiovascular events, blindness, kidney failure, amputation and hospital admissions. However, an early and active prevention of the complications can limit their impact on the person's life, reducing the cost amount with positive impact on the Health system.
A European study published in 2010,12 aimed at comparing the national cost of DM among five European countries, indicates that the direct health costs incurred for drugs, hospitalizations and specialist care amounted to about €7.92 billion. Moreover, it reported an estimate of indirect costs incurred by Italy in 2010 due to the absence from work (€5.36 billion), early retirement (€7.19 billion) and social benefits (€0.97 billion), a total of about €12.64 billion. On the basis of literature data and using a probabilistic model to estimate direct and indirect costs of diabetes, a recent study by Marcellusi et al13 has estimated a yearly average expense of over €20.3 billion, half of which is related to indirect costs.
The implementation of strategies aimed at improving the treatment of diabetes, as indicated in the National Diabetes Plan, is key to guarantee the efficiency and sustainability of the Italian National Health Service (NHS; guidelines of SID—Italian Diabetology Society—and AMD—Italian Association of Diabetologists14).
This work is aimed at implementing the cost-of-illness (COI) study conducted by the research group EEHTA of CEIS,13 using administrative data and breaking down the population with DM by a number of comorbidities. Indeed, the main objective of the study is to obtain an epidemiological estimate of the patients treated and managed by the Marche region over the period 2008–2011, along with the distribution of patients with DM and the comorbidities, which are associated with DM. Assuming inference estimates from regional data, the study has tried to parameterize a probabilistic COI model at national level. Finally, its secondary aim was to model estimates of the economic impact, resulting from improving the efficiency in the management of diabetes by the sociohealth system, on the economic burden of disease in terms of direct health costs.
Methods
Data source
Data were extracted from healthcare administrative databases of the Marche region, a central Italian region with a population of about 1.54 million people (2.5% of the Italian population), which has not statistically significant differences compared with the general Italian population.15 The study was based on administrative databases: Territorial Pharmacy Database, Hospital Discharge Database and Outpatient Service Registry. Using the Territorial Pharmacy Database, local health units routinely measure the volume of expenditure generated by dispensing of drugs to enrolees.16 Specifically, the prescriptions were extracted from the information system of the pharmaceutical prescriptions of the Marche region, containing all the prescriptions received from regional private and municipal pharmacies, reimbursed by the NHS (class A drugs). In the Italian Pharmaceutical System, the drugs are registered with the marketing authorization code (AIC) that allows to identify the active ingredient (ATC code—anatomical-therapeutic-chemical classification) and the exact quantity distributed. For each prescription, the shipment date of the drug, the price and the patient's data are indicated.
The Outpatient Service Registry is the information system of the specialist services, containing all the outpatient visits for diagnostic or therapeutic services of a local unit, which includes all laboratory investigations, instrumental tests and specialist check-up requests.
The Hospital Discharge Database includes all hospitalization data, with the principal and secondary discharge diagnosis codes classified according to the International Classification of Diseases, Ninth Revision (ICD9CM), and the diagnosis-related group (DRG) code.
In this study, a deterministic record linkage among different administrative databases of the Marche region was carried out to individuate subjects with DM and main comorbidities associated with this disease. The linkage among the different administrative sources took place through an anonymous identification code, on the data related to the 4-year period 2008–2011, where the selection of comorbidities per patient can be deepened in online supplementary appendix A.
Supplementary appendix A
In order to be compared with the COI model, already used in the literature, the national prevalence data of diabetes were extracted from the most recent literature available nationally (6.3%; 5.5–7.3% range3 ,17–19). Later, it was assumed that the estimated population with DM in Italy (3 483 860 subjects), which had the same distribution and the same costs, was identified through linkage of the Marche region databases (see online supplementary appendix B).
Supplementary appendix B
Cohort definition
For the identification of the patients' cohort with DM, three types of inclusion criteria were used for each year of analysis (see online supplementary appendix A). In order to be defined subjects with DM, one of the following criteria had to be met:
a primary or secondary diagnosis (code ICD9CM 250), associated with a hospital discharge form;
a medical exemption certificate (013)—any type of diabetes;
an ATC A10 prescription—hypoglycemic drugs.
Once the cohort of patients with DM was identified, the breakdown criteria of the population with DM were determined with the support of a board of clinical experts, according to the comorbidities treated during the year of recruitment within the Marche region. Specifically, the patients with DM were broken down by cardiovascular, kidney, neuropathic (specifically the diabetic foot) and retinal diseases. Essentially, a patient selected in each year of analysis (2008–2011) was identified with one or more comorbidities if he/she had used at least one of the considered services in the reference year.
For the selected subjects, the health costs related to each year of analysis were calculated in terms of
cost of diabetic therapy (ATC A10)
cost of concurrent drugs per comorbidity treatment (ATC reported in see online supplementary appendix A)
cost of potentially associated outpatient specialist services
cost of potential diabetes-related hospitalization
cost of potential comorbidity-related hospitalization
The cost of the pharmacological therapy was calculated as the sum of the prescriptions made during the reference year, based on the prices identified by the information system of the Marche region.
The cost of outpatient specialist services was calculated selecting from the information system of the specialist service of the Marche region the services potentially associated with the therapy during the reference year (see online supplementary appendix A). These were valued through the regional tariffs in force. The selection was made taking into account the expert opinion of the clinical board.
The cost of hospitalizations was calculated selecting from the hospital information system of the Marche region the hospitalizations of the identified cohort of patients with DM and breaking down the results by potentially associated hospitalization considering the main diagnostic groups (major diagnostic category, MDC),20 potentially associated hospitalizations (even if not included in MDC groups) with at least one of the considered diseases (diabetes or comorbidities) in the main or secondary diagnosis and other hospitalizations. In particular, the following classes were included: MDC 2 (ear diseases and disorders), 5 (cardiovascular diseases and disorders), 10 (endocrine, metabolic and nutrition diseases and disorders), 11 (kidney and urinary tract diseases and disorders) and ICD 9-CM. Specialist care and hospitalizations were associated with the single subject through a record linkage procedure, as described previously.
Once the costs of each patient were estimated and broken down according to the comorbidity, the average costs per patient treated in the Marche region were calculated according to the number of comorbidities: Diabetes+1, Diabetes+2, Diabetes+3 and Diabetes+4 comorbidity. The total costs were broken down into
Costs associated with diabetes: cost of diabetes drugs (ATC A10), cost of hospitalisations per MDC 10 and cost of specialist care.
Costs associated with diabetes + comorbidities: total costs of drugs for diabetes and comorbidities, total costs of specialist care and costs of hospitalisations due to comorbidities (MDC 2, 5 and 11+hospitalisations with diagnosis of at least one comorbidity).
Total costs of patients with DM: total costs of drugs for diabetes and comorbidities, total costs of specialist care and costs of hospitalisations of patients with DM.
COI model
A COI study aims to determine the total economic impact of disease or a health condition on NHS and the society through the identification, measurement and valuation of all direct and indirect costs.21 A comprehensive COI study includes direct and indirect costs, although the specific focus of a study may make one or the other unnecessary.22
This approach is widely used in health economics, where the choice of any specific methodology used is often determined by data available (Real World Data, systematic literature review (SLR), etc).21
With the aim of estimating the annual costs caused by DM in Italy, a new COI model was developed. This model was based on the publications of Marcellusi et al13 in 2013. The 2013 analysis estimated only the costs of patients under pharmacological treatment, broken down by type of therapy (Oral, basal supported oral therapy (BOT) and basal bolus therapy (BBT) therapies). In particular, the analysis used cost data deriving from a SLR. The model developed in this study breaks down the patients with DM according to the comorbidities, using the epidemiological and cost parameters resulting from the administrative database analysis of the Marche region.
Starting from prevalence data estimated by the SLR conducted by the study of COI in 201313 and updated with recent sources, the current model assumes that the breakdown of patients according to the comorbidities is the same as the one identified for the Marche region. Furthermore, the model assumes that no high variability exists in the other Italian regions (people residing in the Marche region represent about 3% of total Italian population13).
The same estimation method of comorbidity prevalence was used to estimate costs associated with patients nationwide. The national COI model assumes that the costs for the treatment and care of diabetes at national level are the same as those of the Marche region and applies the same costs per patient estimated in the region to the national model. The variability ranges were estimated according to the SDs of the regional database.
The use of administrative databases of the Marche region allowed at determining only the direct healthcare costs, while direct non-medical costs, indirect costs and out-of-pocket costs were not included.
Scenario analysis
Finally, on the basis of the analyses discussed with the board (see online supplementary appendices Band C) and as reported in published data on the correct management of the patient with DM,14 ,23–27 a scenario analysis was built in order to modify the epidemiological and cost parameters of the COI model. The base case scenario represents the actual cost sustained by NHS for the treatment of diabetes. So as to identify the potential saving deriving from a correct management of the patient, the model performed different simulations, considering an improvement in the management of patients with DM. For example, in order to observe what happens in the hypothesis of alternative intervention scenarios, the identified parameters (table 1) were modified by 10% (sensitivity analysis 5–20%) to try evaluating the costs of the disease in Italy resulting from an improvement of diabetes management. This allows an early diagnosis and a slower progression of the disease and its complications.
Supplementary appendix C
Scenario analysis: how could the improvement of the general recommended monitoring parameters condition the progression of diabetic complications? (hypothesis based on Expert Opinion Evidence)
Specifically, table 1 reports the analysis scenarios in which it is assumed that increasing the monitoring of glycated hemoglobin (1.4 visits a year estimated in the Marche region vs 3 optimal visits23), complications and hospitalizations could be reduced by 10%. This depends on a better monitoring of non-target patients and modifying the treatment accordingly. The changes were made on the primary parameters estimated in the Marche region and by modifying the average costs per patient based on his/her comorbidities accordingly.
Statistical analysis
In order to evaluate the robustness of the data used in the analysis, a probabilistic approach (probabilistic sensitivity analysis) was used, where each parameter was assigned a statistical distribution and the results were re-calculated using 5000 Monte Carlo simulations to obtain interval estimates (95% CI) of the main epidemiological and economic data. The probabilistic distribution was made applying the probabilistic models used in the economic evaluations, distinguishing between costs (gamma distribution) and epidemiological parameters (β distribution).28 The parameters and distributions that generated the results may be examined in online supplementary appendix B.
Results
Database analysis of the Marche region
In the Marche region, 84 330 diabetic patients were estimated totally in 2008, 85 207 in 2009, 85 881 in 2010 and 88 216 in 2011 (table 2). Between 2008 and 2011 on average, 85 909 subjects a year corresponding to about 5.5% of total residents in the Marche region were treated (mean of the four considered years). Of these, about 56% were enrolled exclusively through the ATC A10 prescription, 28% had an A10 prescription and the medical exemption certificate for diabetes and over 7% had a prescription and hospitalization in the same year of analysis. Over 90% of the subjects with DM were recruited in the cohort as they had at least one prescription of antidiabetic drugs during the year.
Enrolled patients with DM per year from 2008 to 2011
The number of subjects with only DM is equal to 13% (no comorbidity). Over 78% of the diabetic population had at least one cardiac comorbidity, over 55% at least one neuropathic comorbidity, about 8% a kidney comorbidity and about 3% a retinal comorbidity. The detailed breakdown according to the concurrent comorbidities is reported in table 3. It indicates that the subjects with DM plus heart and neuropathic diseases are over 34% of the diabetic population while 27% had diabetes and only cardiac comorbidities.
Enrolled patients with DM per kind of comorbidities, percentage distribution and mean cost per patient—average patients 2008–2011
Table 4 shows that the average age of the patients is around 67, and it increases with the number of comorbidities. On average, women seem to have a lower number of comorbidities in comparison to men.
Distribution of patients, average age and sex of the diabetic population by number of comorbidities
Finally, the costs associated with each group of patients were estimated. Figure 1 shows that a patient having only diabetes costs on average €341 annually (red line of the chart) to the regional health system of the Marche region. The cost increases exponentially with associated comorbidities, reaching a yearly average cost of over €7000 when four comorbidities are treated in the same year. Moreover, figure 1A clearly shows that the cost variables grow with the increase in comorbidities. The increase is exponential in terms of pharmaceutical expense for diabetes and comorbidities and, especially, in terms of hospitalization.
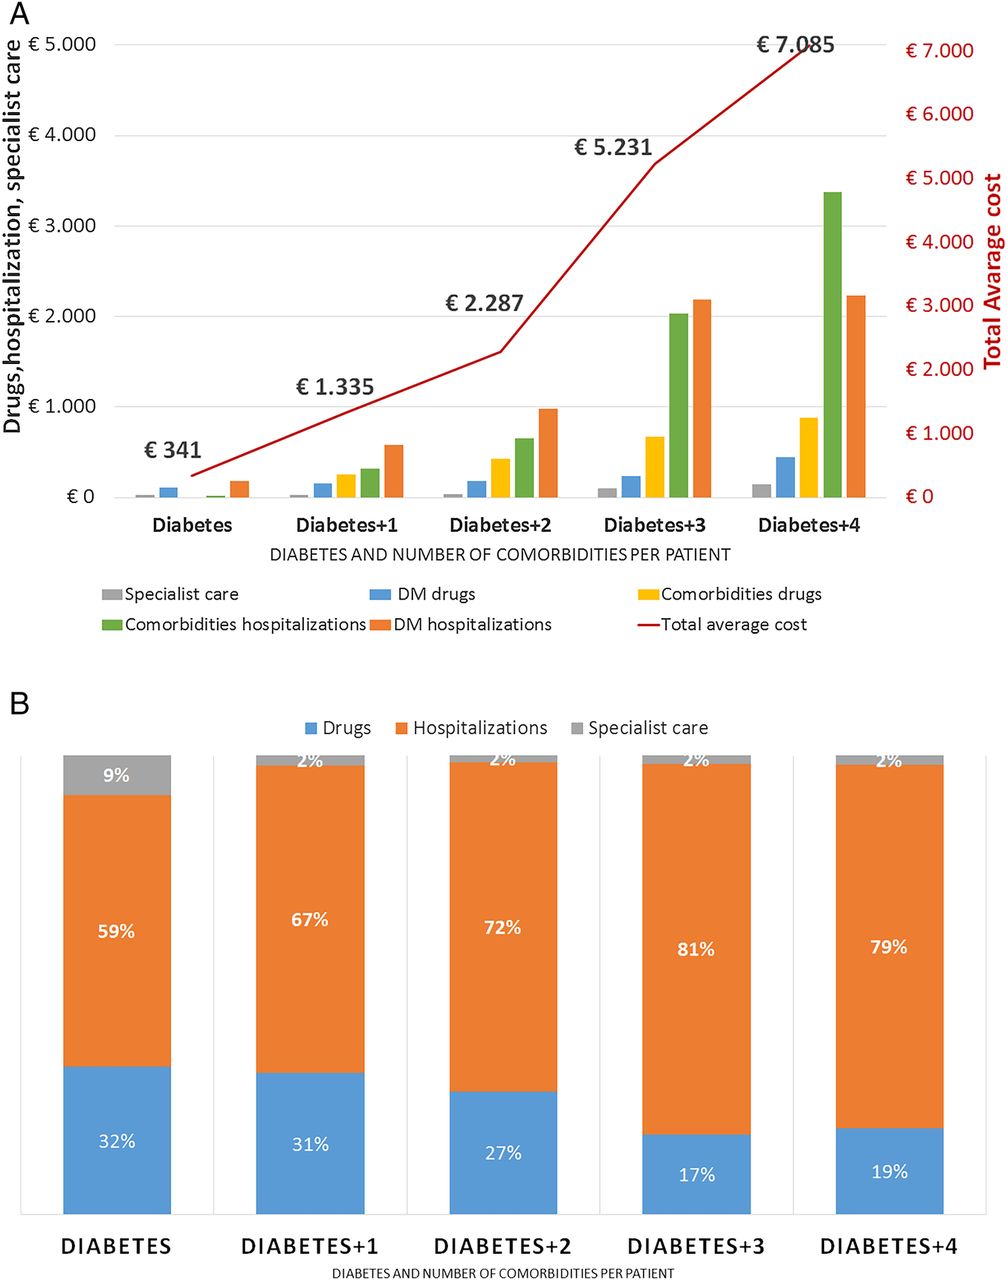
Direct medical costs per patient according to comorbidity and cost item (excluding the item other hospitalizations)—Marche region 2008–2011. (A) Average yearly costs per patient. (B) % distribution. DM, diabetes mellitus.
Figure 1B once again demonstrates that as the comorbidities increase, hospitalizations represent the higher cost item. The main cost item of a patient having only diabetes is the drug treatment (59% of total expense). In the event of a comorbidity, the drug expense represents only 31% of total expense, while hospitalization is over 67% of the direct health cost required to manage these patients. Hospital expense grows as the comorbidities associated with the patient's diseases increase, reaching up to 72–80% of the expense for a patient with diabetes plus three or four comorbidities.
National COI results
Reporting the regional results to a national-scale COI probabilistic model, the total number of subjects with DM estimated in Italy was 3 483 860 (95% CI 2 962 053 to 4 032 448) (table 5). Projecting the distribution of patients per comorbidity estimated in the Marche region on the total number of patients estimated in Italy, it is expected that about 462.1 thousand (95% CI 383.6 to 547.8) patients have only diabetes and over 3.0 million (95% CI 2.6 to 3.5 million) patients have one or more comorbidities. In particular, 1.2 million (95% CI 1.0 to 1.4 million) patients with DM have one comorbidity, 1.4 million (95% CI 1.2 to 1.7 million) have two comorbidities, 317 thousand (95% CI 268.9 to 368.2 thousand) and just over 14 thousand (95% CI 11.7 to 17.0 thousand) subjects have three and four comorbidities, respectively (table 5).
Distribution of patients per comorbidity and associated costs (€ billion)
Assuming at national level the same cost estimate per patient identified in the Marche region, the COI model estimates a total expense of €8.1 billion (95% CI €6.91 to €9.36 billion) for the treatment of patients with DM in Italy (table 5). Of these, about 46% of total expense (3.7 billion; 95% CI 3.15 to €4.27 billion) are closely associated with the treatment of diabetes, and over 86% of total expense (€6.9 billion; 95% CI €5.9 to €8.02) are associated with the treatment of diabetes and its comorbidities.
Taking into account only the costs associated with diabetes (figure 2B), subjects having only diabetes (13% of total diabetic population, figure 2A) absorb only 4% of total expense. Despite representing a small share of total patients with DM (about 10%), the patients with a higher number of comorbidities (+3 or +4 comorbidities) represent no less than 23% of total expense. This indicates that the expenses of subjects with multicomorbidities are disproportionately high, even if only the costs of diabetes are considered (table 5).

Distribution of patients and costs by number of comorbidities. (A) Distribution of diabetic patients. (B) Distribution of diabetes costs. (C) Costs of diabetes+comorbidity. (D) Total costs of diabetic patients.
Analyzing the costs for diabetes and its comorbidities (figure 2C), it may be observed that patients with two or three comorbidities, making up about 50% of the patients with DM, account for over 73% on total expense, demonstrating once again that a higher number of comorbidities is a more than proportional economic burden. The same analysis may be conducted observing the total expense for patients with DM (figure 2D).
Results of scenario analysis
Assuming the scenarios described in table 1 with a static situation in which the new approach is consolidated, the model estimates that increasing the monitoring of glycated hemoglobin to three visits a year (−10% of complications, −10% hospitalizations for diabetes and +10% of drug expense due to increased adherence), the total cost of the patients with DM is reduced by 4.2% compared to the base case (−€0.34 billion; 95% CI −€0.44 to −€0.24 billion). Adding a close monitoring of microalbuminuria, total expense would be reduced by 9.2% compared to the base case (−€0.74 billion; 95% CI −€0.88 to −€0.6 billion). At the same time, considering also a higher number of accesses for cholesterol checks, the saving would be over €0.98 million (95% CI €−1.16 to €−0.81), −12.2% compared to the base case. Finally, considering also a further check of blood pressure, the overall reduction of total cost of patients with DM would decrease to €0.38 billion (95% CI −€0.5 to −€0.25 billion) equal to 4.7% compared to the base case (table 5).
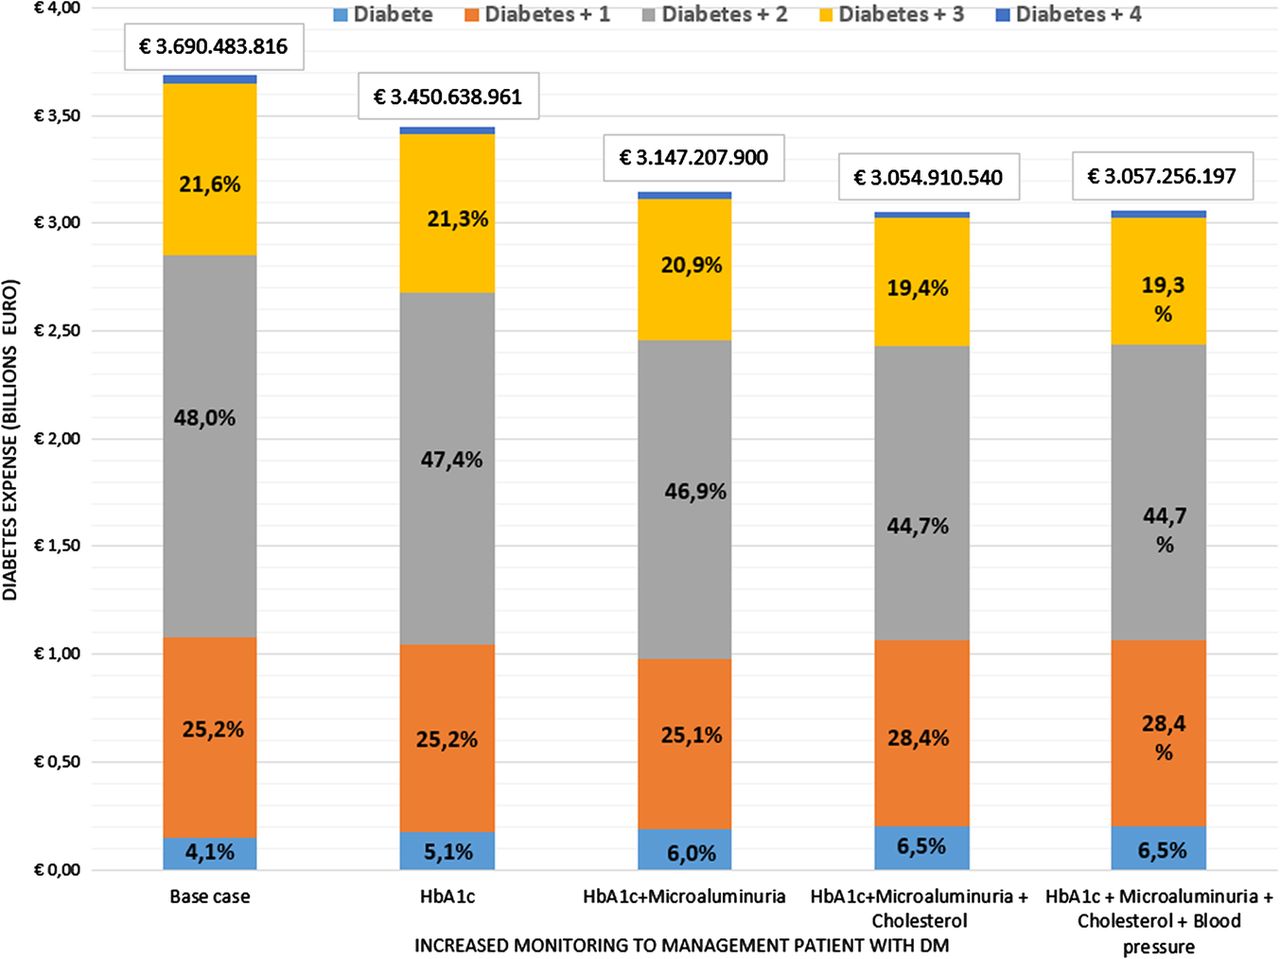
Observing only the specific costs of diabetes (A10 ATC drugs, associated specialist care, hospitalizations with MDC10 or with ICD among the hospital discharge diagnoses), the cost reduction is significant in the considered scenarios, moving from €3.7 billion in the base case to just over €3 billion in the last scenario (figure 3). The close monitoring of the four considered parameters would allow an expense reduction of over 17% (−€633 million taking into account only the services closely linked to diabetes).
Scenario analysis of only costs associated with diabetes.
Finally, assuming different scenarios with changes in the analysis parameters, table 6 reports the cost results according to the different hypotheses of analysis. In particular, table 6 shows the total cost estimates of patients with DM when the analysis scenario changes, increasing or decreasing the improvement percentage of comorbidities, hospitalizations and expense estimates for drugs (table 1). The results show that in all the analyzed scenarios the diabetes cost would be reduced, from a minimum of estimated €207 million (−2.6% compared to current expense) for the S1 scenario (−5% impact on comorbidities and hospitalizations and +10% impact on drugs) to a maximum of estimated €2.9 billion (−36.5% with reference to the expense in the base case) in the S4 scenario (−30% impact on comorbidities and hospitalizations and +10% impact on drugs).
Scenario analysis change in total diabetic patient costs (base case change 10%)
With reference to the S0 base case analysis (−10% impact on comorbidities and hospitalizations and +10% on drugs), in which an expense of €7.2 billion was estimated, the other six scenarios estimate a much lower total expense for patients with DM in the scenarios 4 and 6, where it is assumed that the impact on adherence and subsequent increase of the drugs is lower than the variations on comorbidities and hospitalizations. The remaining scenarios seem not to have a considerable impact with respect to S0, showing lower variations.
Discussion and conclusions
As of today, many national studies have been conducted with the aim of identifying the epidemiological and social weight of diabetes in Italy.3 ,12 ,13 ,29 However, no study has ever used data from administrative databases, re-adjusting them inferentially at national level. Our work has tried to estimate the economic burden of the patients affected by diabetes in Italy, reporting the data recorded in a region of central Italy at national level and breaking down the results by type and number of comorbidities associated with the patients with DM. Moreover, applying scenario analyses discussed with a board of experts, the model has simulated the expense impacts deriving from an improvement of diabetes management indicators, so as to guarantee an improvement of the therapeutic management or early diagnosis, therapy and care and, consequently, effectiveness (reduction of comorbidities and hospitalizations).
The model has estimated that the expense of the direct health costs incurred by the Italian NHS is about €8.1 billion. This is consistent with the estimates of Kanavos et al,12 who estimated an expense of €8.5 billion in 2010, and Marcellusi et al,13 who estimated €9.6 billion (95% CI €8.1 to €11.1). The differences are due to the fact that our model has not estimated the glycemic monitoring (equal to €1.31 billion according to Marcellusi et al). With respect to already published studies, our model supplies additional information on costs closely linked to diabetes (€3.7 billion) and to diabetes and its comorbidities (€6.9 billion). Furthermore, real world data produced lower uncertainty over the estimated epidemiological and cost stratification. Consequently, the new COI estimations provide lower 95% CI if compared to the original literature-based model.13
The results show that the yearly average cost per single patient with DM, in terms of direct health costs, amounts on average to €2318. This is in line with the estimates of the 2011 ARNO report3 used in the models of Marcellusi et al13 and Kanavos et al.12 Also in this case, our model supplies additional detailed information, breaking down the average costs per patient with DM and number of comorbidities. It estimates that, with the increase of the comorbidities, the costs grow from €437 a year for subjects with diabetes only to €7574 for subjects with diabetes plus four comorbidities.
A recently published study concerning the specific regional context of Lombardia29 estimated the average costs per patient managed within the region through administrative databases similar to those used in this work. Considering a sample of 312 223 patients with DM, the authors estimated an annual average cost of €3315. This amount is about €1000 higher than our study's estimates (average annual 2008–2011 cost of €2318 calculated on 343 634 patients). These differences are partly due to a different historical period (the study conducted in Lombardia analyzed only data of 2000), but also to a different distribution of total costs. In fact, in the year 2000, the annual average expense in Lombardia was 54.2% for hospitalization, 31.5% for drugs and 14.3% for specialist services. No more than 64% of the annual average cost is due to hospitalizations, only 25% to drugs and just over 11% to specialist services.
As in all these types of analyses, the model and especially the scenario analysis are characterized by the specific limits of these kinds of approaches. The first limit is related to the inferential assumption. The Marche region data are not necessarily applicable to the national context (the Marche region represents only 3% of total patients in Italy). However, this assumption confirms a consistent management of the patient with DM at national level, along with a compliance with national guidelines.23
A second limit consists in the association of specialist visits and hospitalizations related to the diseases being analyzed. However, it has not been possible to associate them differently, as each patient and related access cannot be considered in detail. The consultation with the board of experts has been the only way to identify the services potentially associated with the care and treatment of the patients with DM in Italy. Finally, the last limit concerns the estimates of the scenarios in the management of the patients with DM. The scenarios are not supported by scientific literature supporting the methodological decisions used. However, for explanatory purposes, a constant rate of increase and decrease in the cost items is based on the scenarios designated by the board of clinical experts. These scenarios only aim at observing the expense impact for the NHS that an integrated management of the patient and a correct monitoring would have on the economic burden of diabetes.
In conclusion, this is the first COI model based on administrative data referring to the patient, including a national inference that highlights the economic opportunity deriving from the improvement of management of DM. It is based on the importance of early diagnosis and recruiting, limiting its evolution and reducing related complications.
As of today, no study has been able to provide a breakdown and detail of the costs associated with the treatment of diabetes, demonstrating that the comorbidities are the clinical parameters most able to predict the cost increase of the patient with DM.
As indicated in the SID-AMD treatment standards of 2014, all diabetology services should be able to demonstrate their compliance with the best scientific knowledge and include the planning and implementation of measurement, analysis and monitoring tools (table 7).
Costs of diabetes per scenario analysis and reduction of total expense with reference to the base case
Therefore, the implementation of health indicators, predicting the onset of complications, in the regional strategic plans and in the diabetology services, would be useful to understand in the long/medium run if the implemented strategies can actually give results.
Acknowledgments
This work was supported by an unconditional grant from AstraZeneca Italia.
References
Footnotes
Contributors AM, FSM and RV wrote the manuscript, performed analysis, analyzed and discussed the results. PS researched data and analyzed the results. GA, SDC, VP and GT reviewed/edited the manuscript and contributed to discussion. AM (PhD) and Professor FSM are the guarantors of the article.
Competing interests None declared.
Patient consent Obtained.
Provenance and peer review Not commissioned; externally peer reviewed.
Data sharing statement No additional data are available.