Article Text

Abstract
Objective Increasing parity may be a risk factor for the development of type 2 diabetes mellitus and the metabolic alterations during a normal pregnancy induces a prediabetic state; thus, multiple pregnancies may act as a risk factor for development of type 2 diabetes if these physiological alterations in glucose homeostasis are not reversed postpartum. We hypothesize that multiple pregnancies may lead to β-cell exhaustion and that the insulin resistance that occurs during pregnancy may persist after multiple births.
Research design and measures A total of 28 healthy premenopausal women were recruited: 15 high parity women (≥4 children) and 13 body mass index (BMI)-matched and age-matched low parity women (1 and 2 children). The study consisted of an intravenous glucose tolerance test for assessment of β-cell function followed by a hyperinsulinemic euglycemic clamp for assessment of insulin sensitivity. Dual-energy X-ray absorptiometry was performed to assess body composition.
Results All anthropometric measures, measures of body composition and baseline blood samples were comparable between the 2 groups. Neither first phase insulin release (0–10 min, p=0.92) nor second phase insulin release (10–60 min, p=0.62), both measured as area under the curve, differed between the 2 groups. The M-value, calculated as the mean glucose infusion rate during the last 30 min of the clamp period, was 8.66 (7.70 to 9.63) mg/kg/min in the high parity group compared with 8.41 (7.43 to 9.39) mg/kg/min in the low parity group (p=0.69).
Conclusions We did not detect any effects of increasing parity on insulin sensitivity or β-cell function.
- Type 2 Diabetes
- Insulin Sensitivity
- Beta Cell Function
- Parity
This is an Open Access article distributed in accordance with the Creative Commons Attribution Non Commercial (CC BY-NC 4.0) license, which permits others to distribute, remix, adapt, build upon this work non-commercially, and license their derivative works on different terms, provided the original work is properly cited and the use is non-commercial. See: http://creativecommons.org/licenses/by-nc/4.0/
Statistics from Altmetric.com
Key messages
No effects were detected on insulin secretion in high parity women (≥4 children) when compared with age-matched and body mass index (BMI)-matched low parity women (1 and 2 children).
We did not detect any significant difference in insulin sensitivity between parity groups.
The possible increased risk of type 2 diabetes in multiparous women may be due to a higher BMI after multiple pregnancies.
Introduction
The prevalence of diabetes mellitus is increasing rapidly worldwide, and the number of people with this metabolic disease is projected to increase from 285 million in 2010 to 439 million in 2030. Type 2 diabetes accounts for 90% of these cases.1 A number of risk factors have been associated with the risk of developing type 2 diabetes, including adiposity, age and gestational diabetes mellitus.
We have previously shown that increasing parity may be a risk factor for the development of type 2 diabetes.2 Results from studies testing a potential association between parity and the risk for type 2 diabetes are conflicting and it has been suggested that the possible association detected in some studies could be a result of a positive correlation between body mass index (BMI) and parity.2–6
The complex pathogenesis of type 2 diabetes has been studied intensively. Accumulating evidence suggests that pretype 2 diabetes is characterized by decreased insulin sensitivity in skeletal muscle, adipose tissue and the liver. Hyperglycemia is prevented as β cells have the ability to compensate for the developing insulin resistance by increasing the secretion of insulin.7–9 This prediabetic state can proceed to overt type 2 diabetes when β-cell function starts to decline. A reduction in insulin sensitivity and discrete abnormalities in β-cell performance may be found in otherwise healthy subjects years before they develop hyperglycemia and type 2 diabetes.10
During a normal pregnancy, the placenta produces metabolic hormones, such as placental growth hormone, placental leptin, human placental lactogen and insulin-like growth factor-I, which induce temporary changes in the glucose homeostasis.11 ,12 Some of these hormones have a negative effect on peripheral insulin sensitivity. The reduced insulin action is compensated for by proliferation and growth of the β cells in the endocrine pancreas, ultimately leading to increased insulin secretion.13 ,14 The adaptations during pregnancy are essential as they ensure an appropriate energy supply across the placenta for the developing fetus. The physiological changes are thought to be reversed in the first weeks postpartum.13
The metabolic alterations during a normal pregnancy can, as described, resemble a prediabetic state. The present protocol was designed to test whether discrete pregnancy-induced changes in β-cell function may persist postpartum and whether peripheral insulin sensitivity postpartum remains impaired in multiparous women and by this pose a risk factor for development of type 2 diabetes. With the present study, we aimed at exploring the effect of increasing parity on postpartum β-cell function and insulin sensitivity.
Participants and methods
Participants
A total of 28 healthy Caucasian premenopausal women were recruited: 15 high parity women (≥4 children) and 13 BMI-matched and age-matched low parity women (1 or 2 children). The participants were recruited through the perinatal database containing information on all women who had given birth at Aarhus University Hospital, Denmark, from 1990 and until 2014.15 ,16 Potential participants were contacted by letter. Exclusion criteria included a diagnosis of type 1/2 diabetes, a diagnosis of gestational diabetes, a first-degree relative with type 1 or 2 diabetes, high-intensity workout more than four times a week, <1 year since last birth and finally a competing chronic disease or malignancy. The study day was conducted between the days 1 and 14 in the menstrual cycle of the subjects. None of the participants used oral contraceptives. Clinical characteristics of all participants are presented in table 1.
Anthropometrics and fasting biochemical profile on the 28 study subjects by parity groups
Ethical approval
The study was conducted in accordance with the Helsinki Declaration and the protocol was approved by the Local Ethics Committee of Central Denmark Region (M-1-10-72-300-13) and the Danish Data Protection Agency. Written informed consent was obtained before participation in the study.
Experimental design
The study was conducted after an overnight fast and subjects had abstained from physical exercise for 48 hours. The study day started with a physical examination including measurement of blood pressure, height and weight. In addition, a dual-energy X-ray absorptiometry (DXA scan) was performed for assessment of body composition. During the rest of the day, the subjects were in a supine position in a quiet, thermoneutral room. For the purpose of infusions, a catheter was inserted into an antecubital vein. A second catheter was inserted in a heated dorsal hand vein for sampling of arterialized venous blood. Screening blood samples were drawn for detection of subclinical disease and for safety purposes at time 15 min (coagulation status). The study day included a ‘Botnia clamp’17 consisting of a 60 min intravenous glucose tolerance test (IVGTT) followed by a 120 min euglycemic hyperinsulinemic clamp.
Dual-energy X-ray absorptiometry
Whole-body bone mineral density and body composition were assessed by DXA scan using a Hologic Discovery scanner S/N 80027 (Hologic, Waltham, Massachusetts, USA).
Intravenous glucose tolerance test
A standard dose of 50 mL of a 50% glucose solution (25 g glucose) was administered over 2 min from time 0 min. Blood samples for the measurements of plasma glucose, serum insulin and C peptide were drawn at time 0, 2, 4, 6, 8, 10, 20, 40 and 60 min. First phase insulin release (FPIR) and second phase insulin release (SPIR) were assessed by calculating the insulin concentration area under the curve (AUC). The FPIR was estimated as the insulin AUC from time 0 to 10 min after glucose administration and the SPIR as the insulin AUC from time 10 to 60 min.
Hyperinsulinemic euglycemic clamp
The hyperinsulinemic euglycemic clamp began at time 60 min. Insulin (1.0 mU/kg/min; Actrapid, Novo Nordisk A/S, Denmark) was mixed in 19 mL of isotonic saline and 1 mL of the participant’s own blood to prevent insulin adsorption to plastic surfaces. The insulin infusion rate was 5.0 mL/hour. Plasma glucose was measured every 10 min and clamped at 5 mmol/L by adjusting an intravenous infusion of 20% glucose.18 Ten milliliter of KCl (1 mmol/mL) was added to the 20% glucose infusates to prevent hypokalemia during the clamp. Glucose was infused with a carrier infusion of 0.9% NaCl to avoid local venous inflammation. Insulin-stimulated glucose disposal (M-value) was estimated as the mean steady-state glucose infusion rate (GIR: mg/kg/min) during the last 30 min of the clamp.
HOMA scores
HOMA scores (homeostatic model assessment) were calculated for estimation of β-cell function (HOMA-B) and insulin sensitivity (HOMA-IR) as percentages of a normal reference population.19 The scores were calculated as HOMA-IR=([glucose]mmol/L×[insulin]mU/L)/22.5 and HOMA-B=(20×[insulin]mU/L)/([glucose]mmol/L−3.5) %.
Disposition index
The disposition index (DI) is a measure of insulin secretion adjusted for insulin sensitivity and was calculated from the product of FPIR and the M-value. The FPIR was calculated as the sum of the insulin concentrations at time 2, 4 and 6 min during the IVGTT.17
Biochemical analyses
Plasma glucose was measured instantly after sampling on an YSI 2300 STAT Plus glucose analyzer (YSI, Hampshire, England). Additional serum samples were frozen immediately and stored at −80°C for subsequent analysis. Insulin and cortisol were analyzed using commercial time-resolved immunofluorometric assays (AutoDELFIA, PerkinElmer, Turku, Finland). C peptide was analyzed by ELISA-kit (DakoCytomation, Cambridgeshire, UK), and glucagon was measured by an in-house radioimmunoassay.20
Statistical analyses
Between-group comparisons were performed by Student's unpaired t-test. Comparison of data that were not normally distributed was performed by the non-parametric Mann-Whitney U test. Unless stated otherwise, results are presented as mean (95% CI) and a p value <0.05 was considered statistically significant. Normality was checked by QQ-plots and histograms. If data deviated from normality, a logarithmic transformation was performed before applying further analysis. Adjustments for M-value and lean body mass are performed by a linear regression analysis. All statistical analysis was carried out using STATA/IC V.13.1 for Windows.
Results
Participants
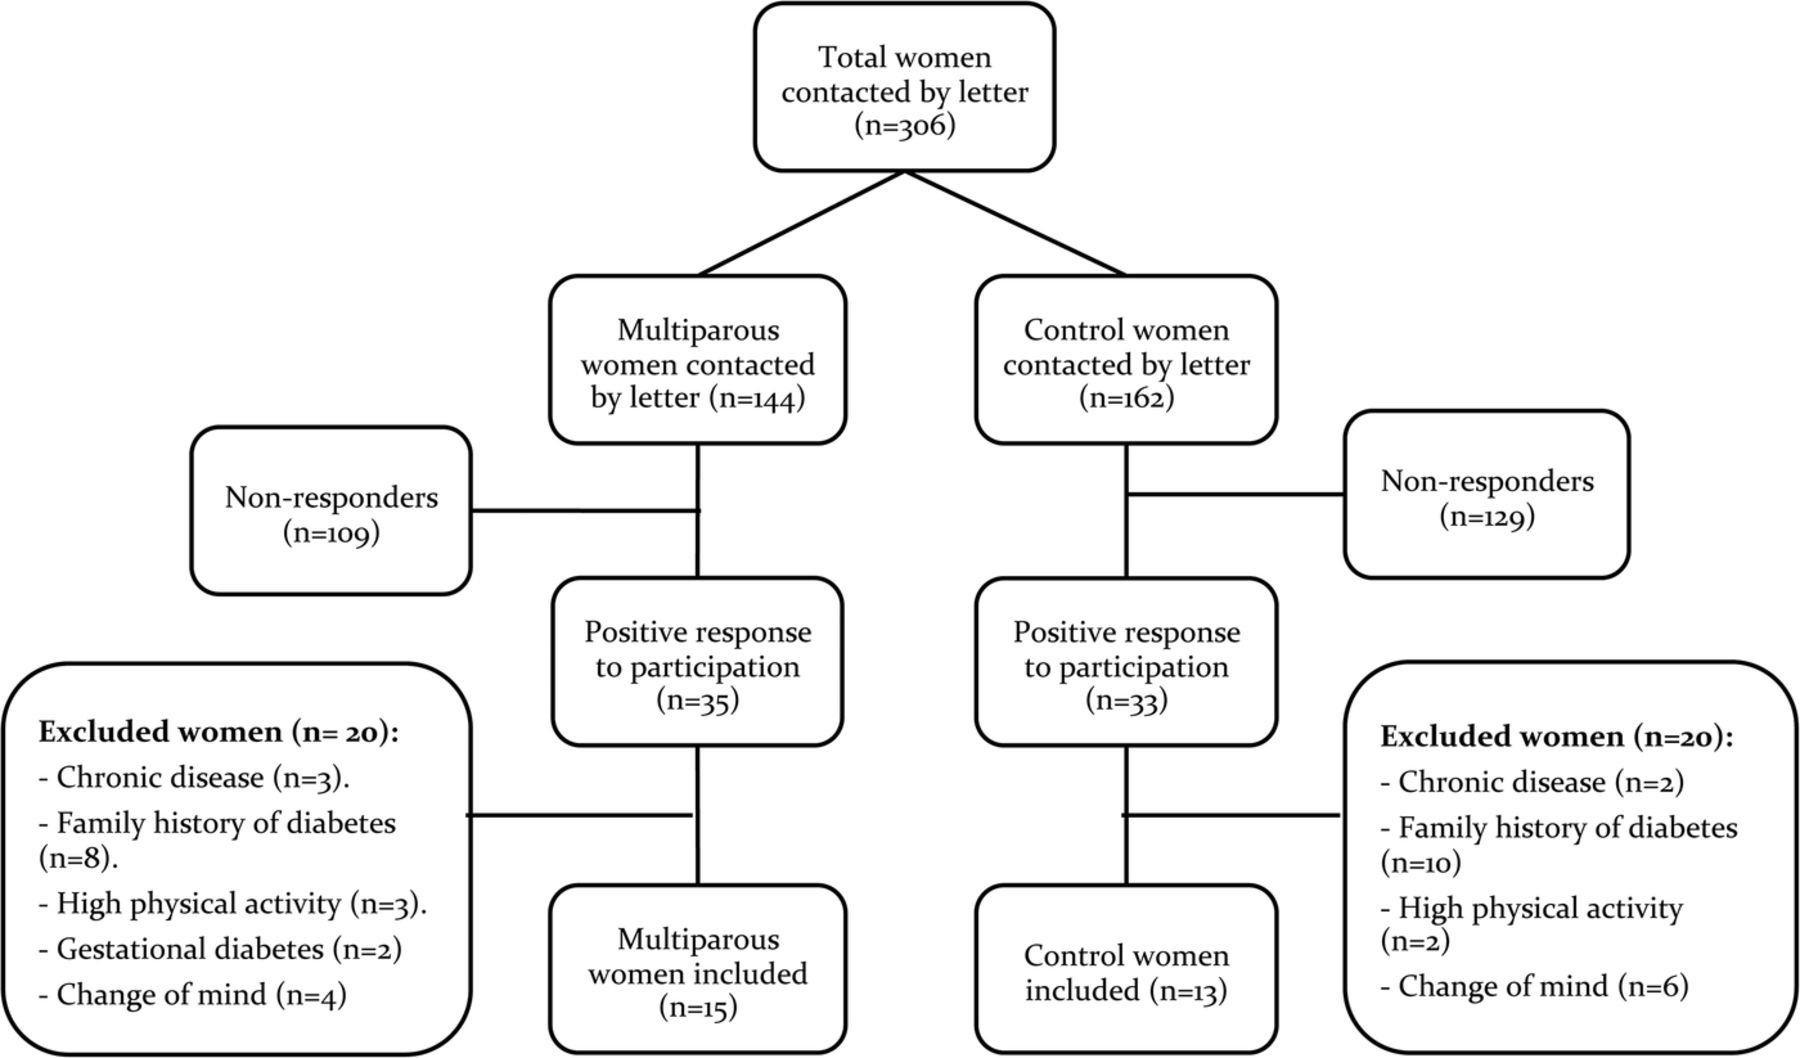
In the high parity group, 24.3% (35/144) of the invited women volunteered to participate compared with 20.4% (33/162) in the low parity group. However, 57.1% (20/35) in the high parity group and 60.6% (20/33) in the low parity group were excluded due to the exclusion criteria, primarily due to a family history of diabetes. A total of 28 participants were enrolled (figure 1).

Flow chart representing the inclusion of participants.
Baseline data
Table 1 presents anthropometric data and fasting biochemical profile for the two parity groups. The two groups did not differ significantly in any of the anthropometric measures and measures of body composition from the DXA scan were also comparable. All baseline blood samples were comparable between the two groups. The screening blood samples were all within the reference interval and no difference between the two groups was detected, indicating that only healthy women participated in the study (data not shown).
β-Cell function
We did not detect any effect of parity on β-cell function as assessed by the insulin release during an IVGTT (figure 2). In addition, neither plasma glucose AUC (0–10 min, p=0.38; 10–60 min, p=0.49) nor C peptide AUC (0–10 min, p=0.68; 10–60 min, p=0.81) differed between groups during the two time intervals (data not shown). Adjusting FPIR and SPIR for M-value (p=0.96 and p=0.57) and adjusting plasma glucose AUC for lean body mass (p=0.51 and p=0.99) did not affect the results. This is also shown by the DI, which did not differ between the groups.
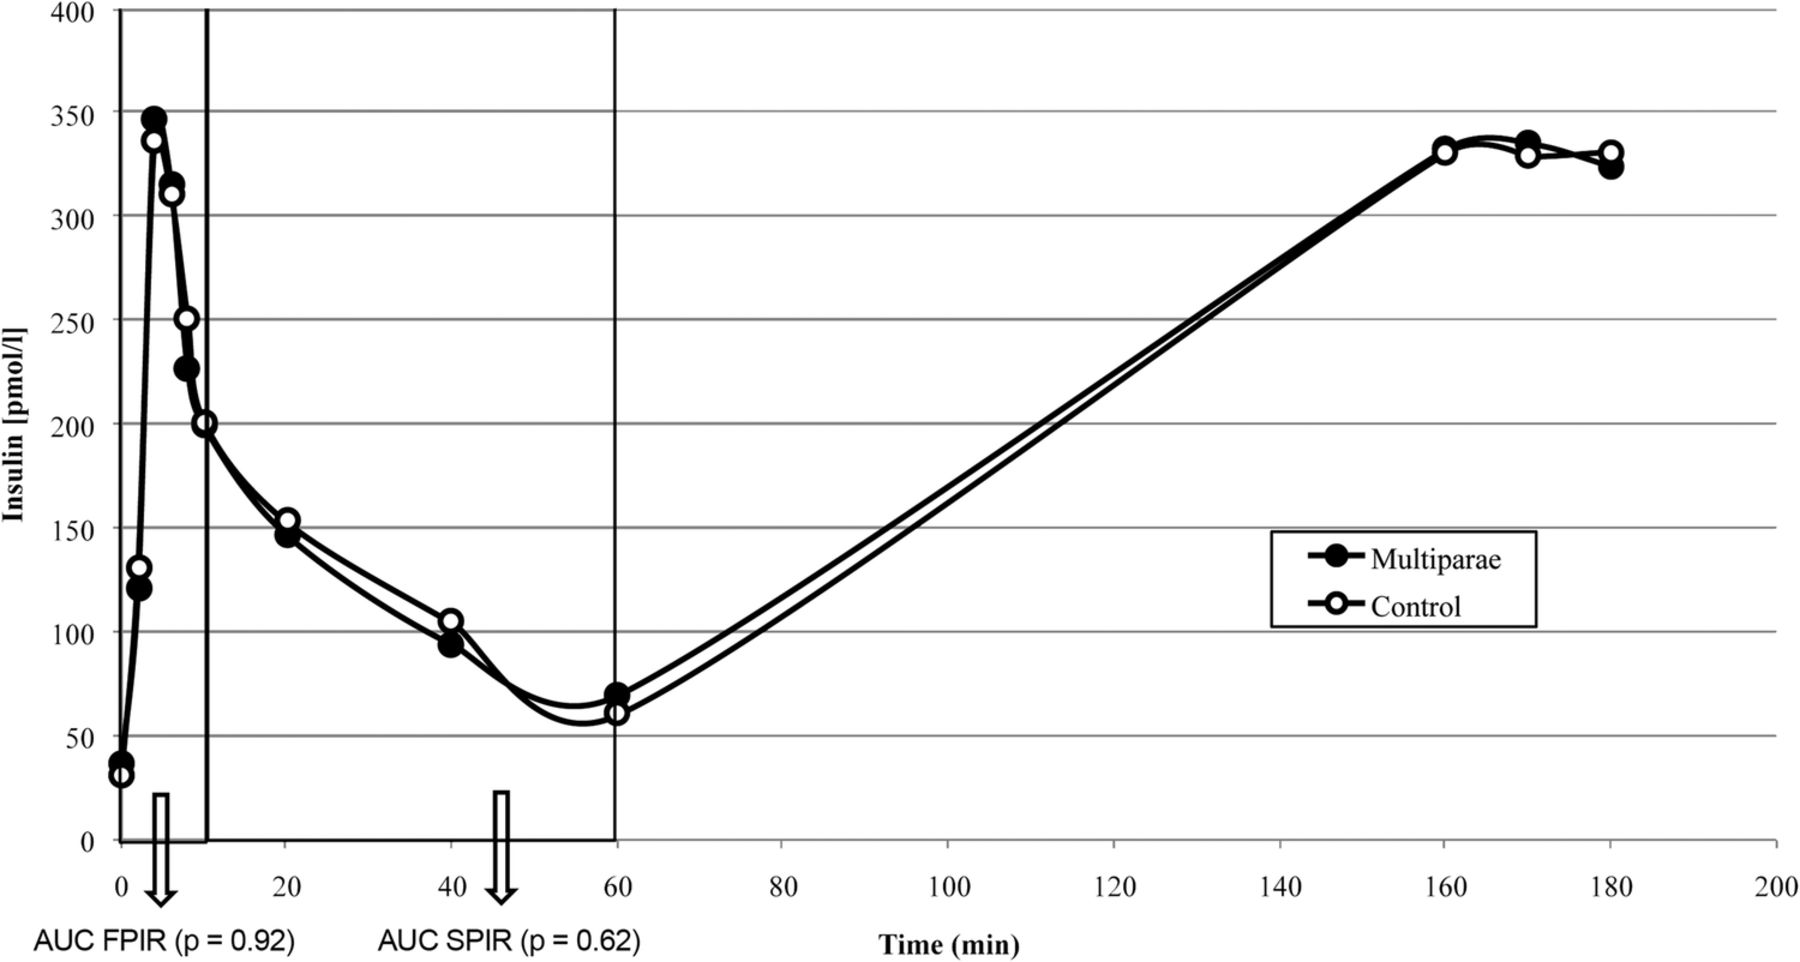
FPIR and SPIR by parity group after intravenous administration of 25 g glucose. AUC, area under the curve; FPIR, first phase insulin release; SPIR, second phase insulin release.
Insulin sensitivity
The mean insulin level for both groups increased from 36.1 pmol/L (28.2 to 44.1) for high parity women and 30.5 pmol/L (27.0 to 33.9) for low parity women in the fasting state to, that is, 70.4 pmol/L (44.7 to 96.2) and 60.5 pmol/L (45.4 to 75.7) after the IVGTT and at last to 324.5 pmol/L (289.6 to 359.4) and 331.7 pmol/L (301.9 to 361.5) at the end of the clamp. Insulin levels were comparable between parity groups (p=0.20, p=0.49 and p=0.74, respectively). As depicted, GIRs increased during the clamp and reached a plateau toward the end. No significant difference was found when comparing GIR in the two groups (figure 3).

GIRs (20% glucose) by parity group during the clamp period (60–180 min). Insulin infusion: 1.0 mU/kg/min. GIR, glucose infusion rate.
The M-value, calculated as the mean GIR during the last 30 min of the clamp period, was 8.66 (7.70; 9.63) mg/kg/min in the high parity group compared with 8.41 (7.43 to 9.39) mg/kg/min in the low parity group (p=0.69).
An M-value calculated from the last 60 min of the clamp was also comparable between parity groups (data not shown). Adjusting the M-value for lean body mass did not affect the results (p=0.75).
HOMA scores (HOMA-B and HOMA-IR) were comparable between parity groups (table 1).
Discussion
We hypothesize that the increased risk of developing type 2 diabetes in high parity women may be a consequence of postpartum persistence of the metabolic changes developed during pregnancy. We addressed our hypothesis by testing insulin secretory capacity in response to a glucose stimulus during an IVGTT and insulin sensitivity by the use of a hyperinsulinemic euglycemic clamp in two groups of age-matched and BMI-matched women with a parity difference of at least two children. We were unable to confirm our hypothesis in this study, as we did not detect an effect of parity on either insulin sensitivity or β-cell function. Consequently, the possible susceptibility to type 2 diabetes mellitus in high parity women may relate to other factors such as increased BMI and body fat content.
Previous studies of the possible association between increasing parity and the risk for type 2 diabetes are conflicting and it has been suggested that the possible association detected in some studies could be a result of a positive correlation between BMI and parity.2–6 This study is, to the best of our knowledge, the first to evaluate insulin secretion and insulin sensitivity in high parity women in comparison with age-matched and BMI-matched low parity and to test the hypothesis that a possible association between parity and type 2 diabetes may be due to persistence of metabolic changes in glucose homeostasis after several pregnancies.
We used the Botnia clamp as it represents a well-validated model for combined assessment of β-cell function and insulin sensitivity on a single study day.17 Several studies have shown an inverse and hyperbolic relationship between insulin secretion and insulin sensitivity. Therefore, it is essential to have an estimate of the insulin sensitivity of an individual to be able to interpret results from the IVGTT with regard to β-cell function.21
The hyperinsulinemic euglycemic clamp technique is widely acknowledged as the gold standard for assessment of insulin sensitivity and is both reproducible and sensitive.18 The use of the M-value as a measure of insulin sensitivity relies on the assumption that the insulin infusion during the clamp suppresses endogenous glucose production (EGP) completely. Previous studies have shown that an insulin infusion rate of 1 mU/kg/min in healthy subjects suppresses more than 95% of the EGP.22 With an insulin infusion rate of 1 mU/kg/min, an M-value at <4.7 mg/kg/min is a conservative definition of insulin resistance in normal subjects.22 In our study, the mean M-value was >8 in both groups, suggesting that the study participants were highly insulin sensitive. We adjusted the M-value for lean body mass, to account for the variation in insulin sensitivity along with the individual amount of muscle tissue, but the M-values were still comparable between groups.
No gold standard for the estimation of β-cell function exists. The use of an IVGTT induces a non-physiological β-cell response due to the intravenous administration of glucose.21 The results from the IVGTT showed equal FPIR and SPIR in the two groups. We adjusted FPIR and SPIR for M-value by a linear regression model, to subtract the impact of insulin sensitivity on insulin secretion. The glucose excursions after administration of intravenous glucose may vary according to body weight and due to variation in the body composition. Plasma glucose AUC during the IVGTT was adjusted for lean body mass, as a fixed dose of 25 g glucose was used. The adjustments did not affect the result. To account for the hepatic clearance of insulin, we measured C peptide levels which were comparable between groups.
In this study, a comparison was performed between two well-matched and homogeneous groups of women with equal age, BMI and body composition. All women were healthy according to the fasting biochemical profile and previous medical history. None of the participants had any other typical risk factors for development of diabetes and all women were Caucasians. Altogether, the two groups seemed to have a comparable general health status. We decided not to include nulliparous women in the control group as potentially a proportion of these women may have metabolic alterations associated with subfecundity such as polycistic ovary syndrome (PCOS). None of the participants used oral contraceptives.
The response rate was equally low in both parity groups and a potential bias from self-selection in both groups of women may affect the results of the study. Biologically, not all women are physically able to conceive and complete multiple pregnancies. High fecundity may represent a marker of above-average general health. Consequently, this may induce a positive biological selection favoring the women in the multiparous group.
The 28 participants of the study had no additional risk factors for development of type 2 diabetes. It is, however, a distinct possibility that the observed increase in risk for type 2 diabetes in high parity women is only present in predisposed individuals. As an example, women with previous gestational diabetes have a persistent reduction in β-cell function postpartum,23 and studies provide evidence that gestational diabetes increase the risk of fulminant type 2 diabetes.24 ,25 Gestational diabetes combined with another risk factor, such as high BMI or a family history of diabetes, is suggested to further increase the risk of type 2 diabetes when comparing with women without additional risk factors.25
Another potential weakness is that several pregnancies have led to a possible increased contact with the healthcare system and thereby to an early detection of diabetes or a prediabetic state. Also, the screening for diabetes during pregnancy may increase the detection rate.
Some studies suggest that for increasing parity to affect the risk for type 2 diabetes, a woman must give birth to five or more children.4 ,26 We were unable to reliably test the effect of having more than four children as only three women in this study had more than four children.
Finally, as with all studies of this nature, a type 2 error, due to the limited number of subjects studied cannot entirely be excluded. On the other hand, we did not detect any prediabetic metabolic abnormalities, nor even trends, in women after multiple pregnancies.
Conclusively, no effects were detected on insulin sensitivity or insulin secretion in high parity women when compared with age-matched and BMI-matched women in a lower parity group. The possible increased risk for type 2 diabetes in high parity women may therefore result from a positive correlation between BMI and parity. On the basis of our results, we do not recommend informing multiparous women that they are at increased risk of developing type 2 diabetes, but guidance on weight loss postpartum may be beneficial. It would be of great interest to perform a follow-up study in the same study participants using the identical protocol in 10–15 years to investigate potential changes in the metabolic parameters over time.
Acknowledgments
The biomedical laboratory technologists Annette Mengel, Lisa Buus and Inge Merete Møller (Department of Endocrinology, Aarhus University Hospital, Denmark) are thanked for excellent technical assistance.
References
Footnotes
Contributors PGO and NM designed the study. DSI and PGO researched the data and included the participants. TSV, DSI, UK, LRM and JS performed the experimental trials. DSI and JS wrote the manuscript. NM, PGO and TSV edited the manuscript.
Funding The study was supported by a grant from the Danish council for independent research, by Aase and Ejner Danielsens fund, by Sister and Verner Lipperts fund and by the NOVO Nordisk Foundation.
Competing interests None declared.
Ethics approval The Local Ethics Committee of Central Denmark Region (M-1-10-72-300-13) and the Danish Data Protection Agency.
Provenance and peer review Not commissioned; externally peer reviewed.
Data sharing statement No additional data are available.