Article Text

Abstract
Objective To evaluate the gene expression profile of whole blood cells in pregnant women without diabetes (with positive screening and negative diagnosis for gestational diabetes mellitus (GDM)) compared with pregnant women with negative screening for GDM.
Research design and methods Pregnant women were recruited in the Diabetes Perinatal Research Centre—Botucatu Medical School-UNESP and Botucatuense Mercy Hospital (UNIMED). Distributed into 2 groups: control (n=8), women with negative screening and non-diabetic (ND, n=13), with positive screening and negative diagnosis of GDM. A peripheral blood sample was collected for glucose, glycated hemoglobin, and microarray gene expression analyses.
Results The evaluation of gene expression profiles showed significant differences between the control group and the ND group, with 22 differentially expressed gene sequences. Gene networks and interaction tables were generated to evaluate the biological processes associated with differentially expressed genes of interest.
Conclusions In the group with positive screening, there is an apparent regulatory balance between the functions of the differentially expressed genes related to the pathogenesis of diabetes and a compensatory attempt to mitigate the possible etiology. These results support the ‘two-step Carpenter-Coustan’ strategy because pregnant women with negative screening do not need to continue on diagnostic investigation of gestational diabetes, thus reducing the cost of healthcare and the medicalization of pregnancy. Although not diabetic, they do have risk factors, and thus attention to these genes is important when considering disease evolution because this pregnant women are a step toward developing diabetes compared with women without these risk factors.
- Hyperglycemia
- Screening
- Microarray Analysis
- Diagnostic Criteria
This is an Open Access article distributed in accordance with the Creative Commons Attribution Non Commercial (CC BY-NC 4.0) license, which permits others to distribute, remix, adapt, build upon this work non-commercially, and license their derivative works on different terms, provided the original work is properly cited and the use is non-commercial. See: http://creativecommons.org/licenses/by-nc/4.0/
Statistics from Altmetric.com
Key messages
What are the new findings?
The gene expression profile shows that the screening for gestational diabetes is enough to separate two populations.
What is already known about this subject?
Our findings provide a guide for the new ‘two-step’ diagnosis that includes screening, followed by a positive diagnosis.
How might these results change the focus of research or clinical practice?
The genetic separation of two populations can influence the current issue of global discussion about the best diagnostic method of gestational diabetes screening.
Introduction
Hyperglycemia is one of the most common medical conditions that women face during pregnancy. The occurrence of gestational diabetes mellitus (GDM) is increasing globally in parallel with the increased prevalence of impaired glucose tolerance, obesity, and type 2 diabetes mellitus (T2DM).1
Despite the high prevalence of hyperglycemic disorders in pregnancy and long-term maternal effects, the most appropriate diagnostic criteria to be used to diagnose GDM are still under discussion.2 The ‘Pragmatic guide for diagnosis, management, and care’ (2015), International Federation of Gynecology and Obstetrics (FIGO), shows that, despite the efforts of numerous health organizations, including national and international associations in the areas of diabetes, endocrinology, and gynecology, to establish protocols, cut-offs, and algorithms for the diagnosis of GDM, current evidence is still lacking. These recommendations are criticized because of their lack of validation and because the expert opinions are often biased due to economic considerations or convenience,3 creating confusion and uncertainty among users. An underlying problem is that the cut-offs considered in the diagnosis of GDM take into account the risk of future development of T2DM; the results of a Hyperglycemia and Adverse Pregnancy Outcome (HAPO) Study showed that the risk of maternal and perinatal adverse outcomes is associated with continuous hyperglycemia, without clear inflection points.4 ,5
The American Diabetes Association (ADA)2 provides two strategies for GDM diagnosis, namely a ‘one-step’ strategy using a 75 g oral glucose tolerance test (OGTT) and a ‘two-step’ strategy using a 50 g screening followed by a 100 g OGTT, and presents the recommendations with the respective evidence levels. The ‘one-step’ strategy assesses the fasting glucose 1 and 2 hours after glucose overload in pregnant women who are between 24 and 28 weeks of gestation without previous diagnosis of overt diabetes. Threshold values for blood glucose levels are as follows: fasting (92 mg/dL), 1 hour (180 mg/dL), and 2 hours (153 mg/dL). Any value equal to or above these values confirms the GDM diagnosis. In the ‘two-step’ strategy, a pregnant woman first takes 50 g of OGTT between 24 and 28 weeks of gestation with a limit value of 140 mg/dL, provided she has not previously been diagnosed with diabetes. Pregnant women with blood glucose levels that equal or exceed the 140 mg/dL limit during the first test go onto the second step involving 100 g of OGTT with the following limit values: fasting (95 mg/dL), 1 hour (180 mg/dL), 2 hours (155 mg/dL), and 3 hours (140 mg/dL), as defined by Carpenter-Coustan,6 or fasting (105 mg/dL), 1 hour (190 mg/dL), 2 hours (165 mg/dL), and 3 hours (145 mg/dL), as defined by National Diabetes Data Group (NDDG).7 During the second test, two or more values that are equal to or above the threshold values confirm the GDM diagnosis. The ADA concludes that different diagnostic criteria identified different degrees of maternal hyperglycemia and maternal and fetal risks, intensifying the debate about the best criteria to be used.
The Diabetes Perinatal Research Centre—Botucatu Medical School—UNESP diagnoses hyperglycemia in pregnancy using screening, with fasting blood glucose ≥90 mg/dL, and risk factors (personal, obstetric and family). Women positive for the screening diagnostic phase with 75 g OGTT and glycemic profile. Classifying the pregnant women in four groups identified by Rudge,8 including pregnant women with GDM and mild gestational hyperglycemia (MGH).
The literature describes that there are several genes related to diabetes. Moreover, it is known that the pathophysiology of GDM and T2DM is also related to genetic abnormalities, which are widely studied. In healthy individuals, as well as non-diabetic (ND) and non-pregnant populations, one-third of the variation in fasting glucose is genetic, and common genetic variants in multiple loci are robustly associated with fasting glucose, type 2 diabetes, and glycemic traits. Thus, genetic factors are likely contributing to the variation in glucose levels during pregnancy. However, these variants were not analyzed extensively in large studies with pregnant women.9 Genomics approaches have changed the way we do research in biology and medicine. It is possible to measure the majority of mRNAs, proteins, metabolites, protein–protein interactions, genomic mutations, polymorphisms, epigenetic alterations, and micro-RNAs in a single experiment.10 Developed molecular biology techniques lend themselves to the study of both normal physiology and pathophysiology,11 which brought great contributions of studies involving diabetes, pregnancies, and their complications. The study of gene expression on a large scale (microarray) makes it possible to monitor thousands of genes using a single test.12 The gene expression profile can capture daily changes caused by environmental factors and lifestyle, as well as permanent changes caused by structural variations in DNA.
In the current discussion about the best strategy for the diagnosis of GDM, particularly the strategy proposed by the ADA, which includes the ‘one-step’ and ‘two-step’ tests, one of the discussion points is whether pregnant women with positive screening results for GDM present important differences compared with pregnant women with negative screening results, a subject that is scarce in the literature. Knowing that GDM has been correlated with genetic alterations and changes in gene expression, the evaluation of the gene expression profile in pregnant women with positive screening results for GDM compared with pregnant women with negative screening results is extremely important. This information can separate two populations, where only the results of the screening have changed, and contribute to the current discussion focused on evaluating the best criteria for GDM diagnosis. Thus, the aim of this study is to evaluate the gene expression profile in whole blood cells of pregnant women without diabetes (with positive screening results and negative diagnosis for GDM) compared with pregnant women with negative screening results for GDM.
Research design and methods
Study design and study populations
This study was approved by the Research Ethics Committee—Brazil Platform (CAAE: 14489013.0.0000.5411, number 291638). All patients were informed about the purpose of the study and signed a consent form before recruitment. Pregnant women were recruited between 2012 and 2015 at 34 weeks of gestation in the Diabetes Perinatal Research Centre—Botucatu Medical School-UNESP and Botucatuense Mercy Hospital (UNIMED). The women were divided into two groups: group 1—control (n=8), women with negative screening; group 2—ND (n=13), women with positive screening and negative diagnosis of GDM (normal OGTT and glycemic profile).
A questionnaire about personal information (age, smoking, alcohol consumption, contact with chemicals, radiation exposure) and medical history (intercurrent diseases, habitual use of drugs) was applied to all study participants. The risk factors present in groups with positive screening were as follows: ND group must have one or more risk factors for diabetes such as: fasting glucose levels >90 mg/dL, prior obesity, family history of diabetes, maternal age over 25 years, obstetric history of previous GDM, fetal macrosomia, previous perinatal death and prior fetal malformation.
The inclusion criteria in the study were as follows: (a) pregnant woman classified into one of the study groups; (b) the ND group needs to present one or more risk factors for diabetes; (c) prenatal care and childbirth received at Botucatuense Mercy Hospital—UNIMED or the Diabetes Perinatal Research Centre—Botucatu Medical School-UNESP; (d) signed consent form; (e) fasting at the time of blood collection; (F) OGTT and glycemic profile between 24 and 28 weeks and (g) not in labor at the time of collection. Criteria for non-inclusion were as follows: (a) multiple pregnancies; (b) smoking; (c) alcoholic, (d) diabetes type 1 and (e) mental retardation. The exclusion criteria were as follows: (a) pregnant women with chronic and infectious diseases; (b) fetal malformations and (c) delivery before the 34th week.
Anthropometric and biochemical measurements
A peripheral blood sample was collected for glucose, glycated hemoglobin, and gene expression analyses. Plasma glucose was measured by the glucose oxidase method (Glucose—Analyzer II Beckman, Fullerton, California, USA), and the glycemic mean was calculated using the arithmetic mean of plasma glucose measured in all glycemic profiles performed at diagnosis (ND group); glycated hemoglobin was assayed by high-performance liquid chromatography (D10TM Hemoglobin Testing System, Bio Rad Laboratories, Hercules, California, USA). Body mass index was calculated by body weight divided by the square of height at the beginning and end of pregnancy. Part of the blood sample (2.5 mL) was collected in syringes and transferred immediately to a Blood RNA Tube (PAXgene), homogenized, stored at room temperature for 24 hours, and frozen gradually.
RNA processing
RNA extraction was performed using the PAXgene Blood RNA Kit (Qiagen) according to the manufacturer's instructions. The concentration was assessed using NanoVue equipment. The concentration’s means and the RNA contamination rate were satisfactory, average yield 0.5 µg/µL and purity index (ratio 260/280 and 260/230) above 1.8. The sample quality and integrity were evaluated by examining the bands corresponding to the 18S and 28S ribosomal subunits. Further, analysis using Bioanalyzer (Agilent) capillary electrophoresis equipment was performed to check the RNA integrity number (RIN), and samples with an RIN≥7 were considered acceptable for microarray analysis.
Microarrays
The gene expression profile was evaluated using a single-color microarray. Glass slides were used (GE SurePrint G3 Human 8x60K Microarray Kit) and made by converting the RNA into complementary RNA (cRNA), which was labeled with cyanine (Cy3) using the 1-Color Low Input Linear Amplification Kit (Agilent). The labeled cRNA was purified with the RNeasy Kit (Qiagen) and subsequently eluted in ribonuclease-free water and quantitated. The cRNA fragmentation and hybridization steps (to the SureHyb hybridization chamber for 17 hours at 65°C) were made on slides using a Gene Expression Hybridization Kit. Following hybridization, the slides were washed with specific solutions. Agilent's Stabilization and Drying solutions were used to protect the cyanine probes from ozone-induced degradation. Analysis of microarray slides was performed using Agilent Microarray Scan Control. Data extraction was performed using Agilent Feature Extraction (FE) and all parameters were evaluated, as shown by the Quality Control (QC) report.
Statistical and bioinformatics analysis
To evaluate the characteristics of the study population, a Student t-test was used. For microarray analysis, data quantification and QC were performed using FE software, V.15.5 (Agilent Technologies, Life Sciences and Chemical Analysis Group, Santa Clara, California, USA). The filter, normalization, and analysis of expression data were loaded into the R-statistical environment (http://www.r-project.org), V.3.0.0. The background adjustment was performed by subtracting the median background values from the median expression values. Data were processed using log2 and then normalized using the quantile function aroma.light package.13 The differentially expressed genes were identified using the F-test with Benjamini-Hochberg correction in order to compare between groups. These analyses were performed using the multtest package.14 All clusters of coregulated genes were subject to functional analyses using the database for annotation, visualization and discovery Integrated (DAVID), V.6.7.15 Values of p<0.05 after Benjamini-Hochberg correction were considered significant.
After bioinformatics analysis, a literature review was performed that focused on all differentially expressed genes and developed biological networks identified in this study. We present a discussion of the genes that were directly or indirectly related to diabetes and its pathophysiology.
Gene interactions networks evaluation
The gene interaction networks were made using STRING: functional protein association networks (String-db.org) by inputting each differentially expressed gene of interest that presented interactions within each comparison. Confidence scores of 0.7 (high confidence) were used, and networks did not contain more than 50 interacting genes. In addition, we used both the experiments and databases as prediction methods.
Gene validation (real-time quantitative PCR (qRT-PCR))
One altered gene (EEF2K) suggested by the microarray,was validate using qRT-PCR using qRT-PCR. Total RNA of peripheral blood samples was isolated using the RNeasy Mini Kit (Qiagen) according to the manufacturer’s protocol. RNA characteristics were determined using a NanoDrop spectrophotometer (Thermo Fisher). We synthesized the complementary DNA using the High Capacity Kit (Applied Biosystems, USA) according to the manufacturer’s instructions. EEF2K (Hs00179434_m1) gene expression level was evaluated using the TaqMan system (Applied Biosystems, Foster City, California, USA). β-Actin was used as a housekeeping gene. The relative gene expression data were analyzed using the 2−ΔΔCT method.
Results
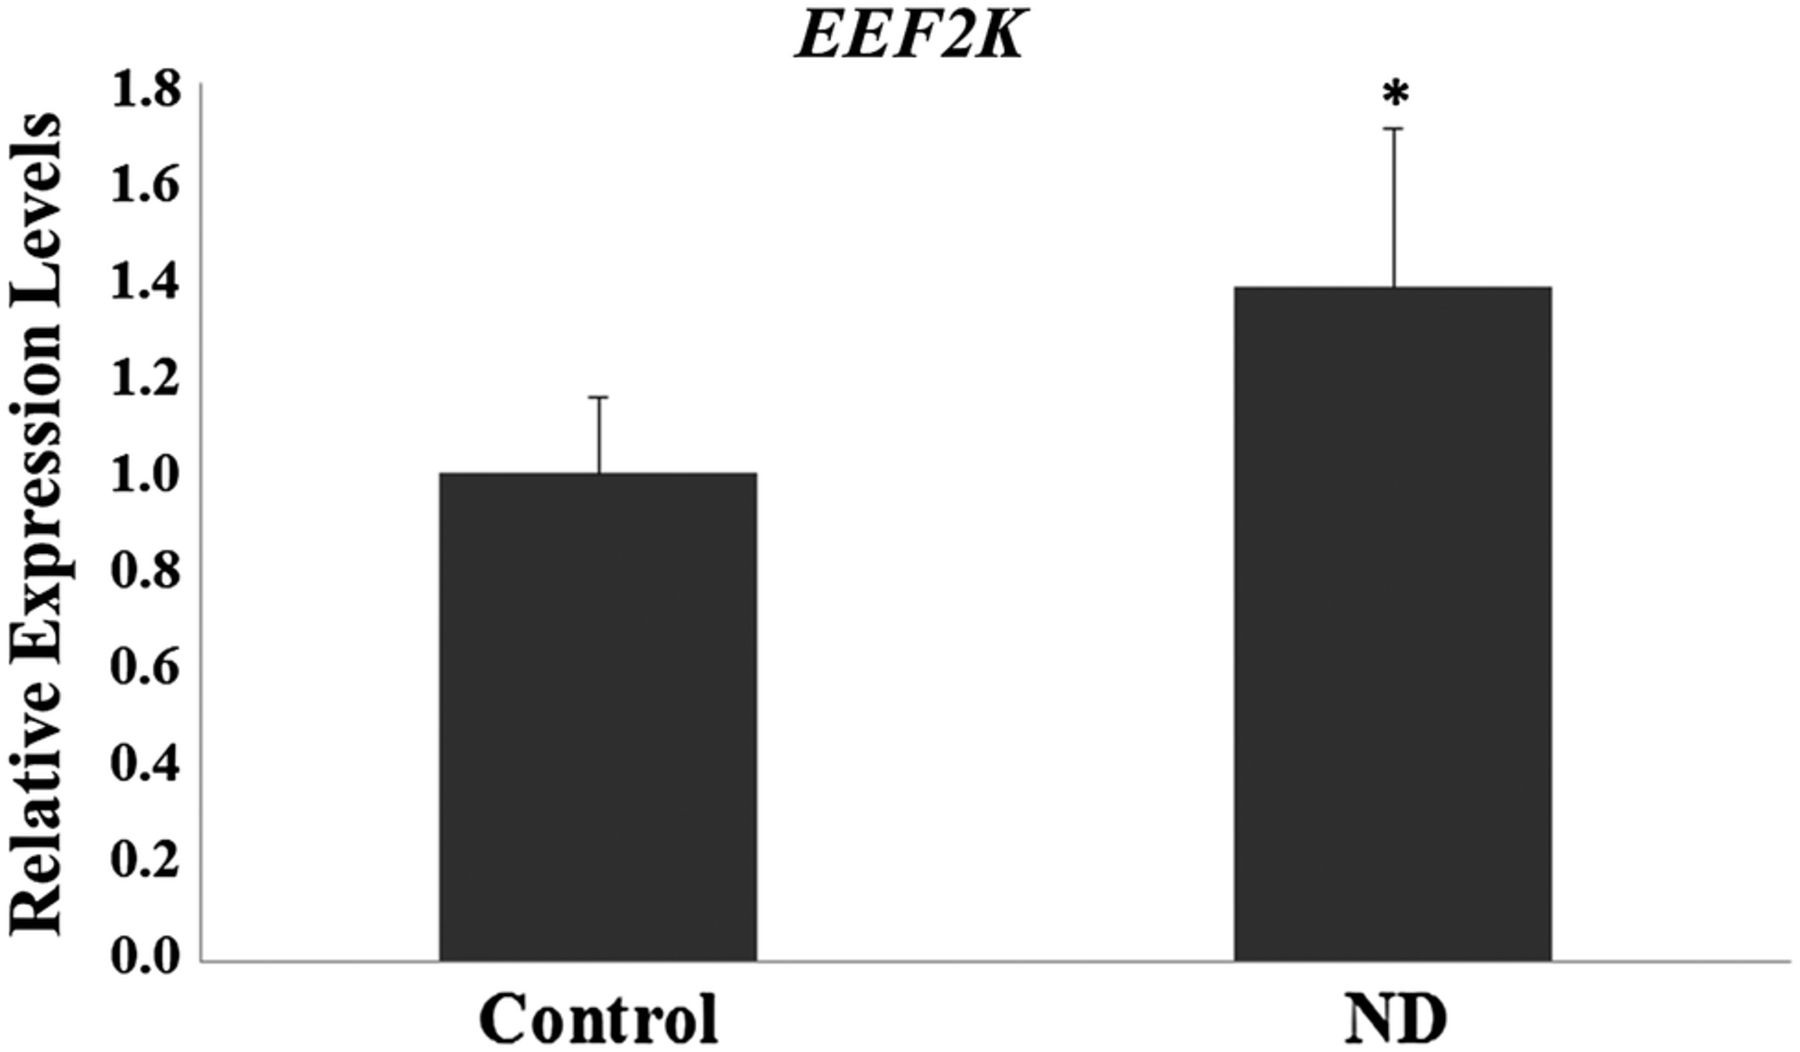
Table 1 shows the clinical characteristics of the pregnant women involved in the study. The initial and final BMI was higher in ND group (p<0.05). Personal history, obstetric and/or familial of diabetes was present in ND group (p<0.05). The evaluation of gene expression profiles showed significant differences between the control group and the ND group (p<0.05), with 22 differentially expressed sequences (7 upregulated and 15 downregulated) (table 2 and figure 1). Of the differentially expressed genes, three genes are of particular interest, two upregulated (EEF2K and CDR2) and one downregulated (AKAP5), based on the results of the gene networks (figures 2 and 3) and interaction tables (tables 3 and 4) and because of their involvement in key biological processes. The elaborated networks showed 49 interactions with other genes: EEF2K presented interactions with 20 different genes, CDR2 with only 1 gene (figure not shown) and AKAP5 with 28 different genes. The validation of microarray analysis was performed by qRT-PCR. The overexpression of the EEF2K gene in the ND compared with the control group suggested by the microarray was similar to changes in relative gene expression levels measured by qRT-PCR (figure 4).
Clinical and laboratorial characteristics of the study population
Genes differentially expressed between the control and non-diabetic groups
Genetic interactions table of the EEF2K gene
Genetic interactions table of the AKAP5 gene

Heat map of gene expression comparisons between the control and non-diabetic (ND) groups. Legend: yellow (upregulated), red (downregulated) and white (no modulation).

Genetic interaction network of the EEF2K gene. Confidence score of 0.7 (high confidence) and not more than 50 interactions per gene. Prediction methods: experiments (purple lines) and databases (blue lines).

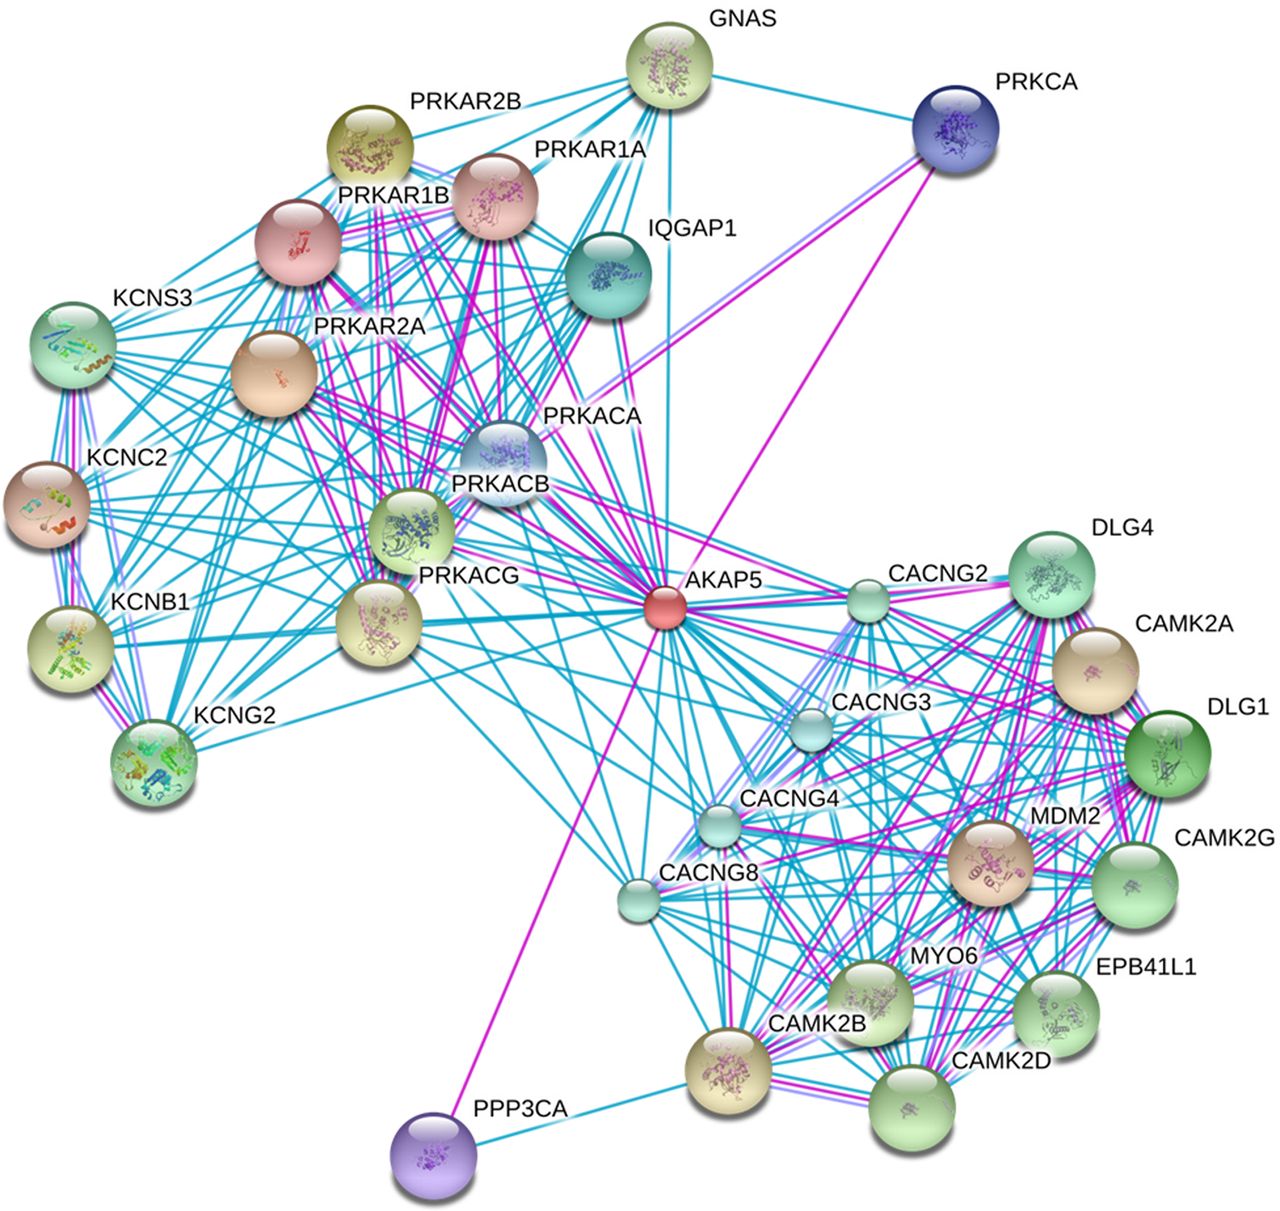
Gene interaction network of the AKAP5 gene. Confidence score of 0.7 (high confidence) and not more than 50 interactions per gene. Prediction methods: experiments (purple lines) and databases (blue lines).

Relative mRNA levels of EEF2K in the control and non-diabetic (ND) groups. *p<0.05—Significant difference compared with the control group (Student t-test).
Conclusion
This study was designed to evaluate the gene expression profile in ND pregnant women (positive screening result and negative diagnosis) compared with control pregnant women with a negative screening result for GDM. The gene expression analysis involving 66 000 genes showed 22 differentially expressed genes in ND pregnant women (7 upregulated and 15 downregulated). These results are important because they show that two populations, which differ only by a positive screening result for GDM, may be distinguished by different gene expression results.16 Further, the results of this study supports the ‘two-step Carpenter-Coustan’ screening strategy recommended by the American College of Obstetricians and Gynecology.17
The literature contains extensive discussion about the best GDM diagnostic strategy able to detect adverse perinatal outcomes.2 ,18 ,19 Questions relating to the cost-effectiveness and benefits of GDM detection and treatment are growing in national and international publications and range from publications that deny their importance20 ,21 to those that conclude that screening, diagnosis, and treatment of GDM are cost-effective.22 The results of the HAPO Study (2008)23 showed that less severe glucose intolerance than is present in GDM is associated with adverse perinatal outcomes and that screening should be universal with use of 75 g of OGTT.18 The American College of Obstetrician and Gynecology (ACOG, 2013) defines the ‘two-step’ strategy, which includes screening followed by glucose overload for patients with a positive screening result, because it is cost-effective.17 The latest publication of the ADA (2015)2 defines two screening strategies (‘one-step’ and ‘two-step’) as alternatives. Many studies have been published, and others are currently underway, evaluating whether the ‘one-step GDM’ screening strategy advocated by International Association of the Diabetes and Pregnancy Study Groups (IADPSG) is more efficient than the ‘two-step Carpenter-Coustan’ screening strategy. However, after a search of the National Center for Biotechnology Information (NCBI) PubMed Databases, we find no account of a study showing differential gene expression between these populations. For GDM screening, we use fasting glucose >90 mg/dL and risk factors for diabetes. Although different from that described by the ADA, where screening only is considered cost-effective and enough to separate the two populations, our findings provide a guide for a new ‘two-step’ screening that includes tracking, followed by a positive diagnosis.
Bonomo et al24 and Bevier et al25 showed that treating pregnant women with only positive screening (altered 50 g OGTT) reduces the occurrence of newborns who are large for their gestational age. The gene expression resulting between pregnant women with negative and positive screening detected in this study suggests a possible relationship between the treatment of altered gene expression and the improvement of adverse perinatal outcome in this population with positive screening for GDM.
Of the 22 differentially expressed genes, we highlight 3: 2 upregulated (EEF2K and CDR2) and 1 downregulated (AKAP5). The interaction networks built with these three genes resulted in the involvement of 49 genes. The EEF2K gene overexpressed in the ND group encodes a highly conserved protein kinase involved in signaling pathways mediated by calmodulin, which activates surface receptors for cell division. This kinase is involved in regulating protein synthesis and phosphorylates the eukaryotic elongation factor 2 (EEF2), inhibiting its function. The activity of this kinase is increased in many cancer types and may be a valid target in cancer treatment.26 EEF2 plays an essential role in protein synthesis because it catalyzes the translocation of a ribosomal Messenger RNA (mRNA) subunit and two transfer RNAs (tRNAs) after peptide transfer. Phosphorylation of EEF2 to EEF2K blocks translation of the mRNA.27 It was found that EEF2 knockdowns showed a more pronounced decrease in total insulin content than the decrease in insulin caused by hyperglycemia, suggesting that downregulation of one or more isoforms of this protein plays an important role in the regulation of insulin biosynthesis. Furthermore, long-term attenuation translation may also contribute to glucotoxicity in pancreatic β-cells.28 In the evaluation of the gene networks, it was found that EEF2K interacts with 20 different genes and is involved in biological processes related to proteins of metabolic processes, cell cycle, and gene expression, insulin receptor signaling pathways, and cellular response to insulin and insulin stimulation.29 The EEF2K gene and its interactions play an important role in the regulation of insulin biosynthesis. This suggests that this group, even with positive screening and negative diagnosis for diabetes, and this altered gene, may, in future circumstances requiring increased insulin synthesis, develop hyperglycemia favoring the emergence of factors related to metabolic syndrome and diabetes.
The CDR2 gene, also upregulated in the ND group, is a tumor antigen expressed on a high percentage of breast tumors and in ovarian cancer. It is also a cell cycle regulatory protein in tumor cells, and its overexpression is responsible for cellular proliferation in tumors.30 The CDR2 protein is present in 62% of ovarian cancers and is not present in normal tissues.31 The CDR2 gene has only one gene interaction with MYC (myelocytomatosis oncogene), which has a function related to tumorous processes.27 Vrachnis et al32 showed a possible correlation between diabetes, breast cancer, and pathogenesis of endometrial carcinoma by inflammatory pathways and a possible correlation with ovarian carcinoma. In addition, several studies show a relationship between obesity and breast cancer33 ,34 and ovarian cancer.35 Women in the ND group, in addition to presenting with overexpression of this gene, also have a history of obesity from before pregnancy. This reinforces the attention that this group requires because, despite having a negative diagnosis for diabetes, these women present positive screening and inflammation due to obesity. This, along with overexpression of the CDR2 gene, may increase the probability of the development of breast cancer and ovarian cancer in women in this group.
AKAP5 is an anchoring kinase A protein (AKAP) family member. AKAPs are a group of structurally diverse proteins that bind the regulatory subunit of protein kinase A (PKA) and confine the holoenzyme at various locations within the cell.36 PKA is cAMP-dependent and interferes with T cell activation through the expression of the inhibition receptor of the α chain interleukin 2 (IL-2) and IL-2 production.37 Genetic and immunological studies highlight deficiencies in the IL-2 receptor and its signaling pathway as a central defect in the pathogenesis of type 1 diabetes mellitus. Lack of IL-2 in the pancreas can impair the action of Treg cells and lead to pancreatic β-cell destruction.38 Prior intervention studies in animal models indicate that the increase in IL-2 signaling can prevent and reverse the disease, especially with the protection conferred by the restoration of Treg cell regulatory function.39 In obesity, a factor present in this group, Treg cells recruit cytokine-secreting macrophages, which are directly related to insulin resistance. In addition, T cells are directly related to chronic inflammation, and blockage of these cells can improve insulin resistance.40 This cascade of events is of great interest because downregulation of the AKAP5 gene, which leads to a reduction in Treg cells, may be a compensatory attempt to avoid insulin resistance onset due to obesity and may explain the probable pre-diabetic state present in this group. Furthermore, in the interaction gene networks, AKAP5 was found to interact with 28 genes, several related to immune response, immune system processes, and regulation and secretion of insulin and proteins in general.29 This finding suggests that this gene may indirectly influence insulin levels and may possibly be related to diabetes progression in this group of pregnant women presenting, at this point, with only risk factors for the disease. The conjunct analysis of these upregulated and downregulated genes suggests that this group of ND women with positive screening is in a moment of balance between insulin resistance and production. The presence of personal obstetric and/or family risk factors, associated or not with impaired fasting glucose, is related to the balanced gene expression profile. However, this is a matter of concern because environmental and personal factors, especially being overweight, can disrupt this balance. These results require confirmation with other studies; however, there is evidence that dietary guidance coming from nutrigenomics can interfere, delay, or even prevent the development of T2DM in this group.
The limitations of this study are related to the small sample size because of the difficulty in finding women with a negative screening result who fall within the inclusion criteria, especially the obesity requirement. Another limitation of this study is the lack of similar studies in the literature for comparison and discussion of the results. However, despite the limitations mentioned, our results show that pregnant women with positive screening for GDM show significant changes in their gene expression profile, displaying 22 differentially expressed genes. Furthermore, our results show that these genes are involved in gene networks and biological processes related to biosynthesis and regulation of insulin secretion and insulin pathways, which are processes implicated in the pathogenesis of diabetes in pregnancy. Despite the small number of differentially expressed genes, our findings genetically separate the two populations of normoglycemic pregnant women differentiated only by a positive screening result. In the group with a positive screening result, there is an apparent regulatory balance between the functions of the differentially expressed genes related to the pathogenesis of diabetes (upregulated) and a compensatory attempt to mitigate the possible etiology (downregulated). These results support the ‘two-steps of Carpenter-Coustan’ screening strategy because pregnant women with negative screening do not need to continue onto diagnostic investigation of gestational diabetes, reducing the cost of healthcare and the medicalization of pregnancy.
Our study provides new perspectives for a better understanding of the specific biological processes involved in the pathogenesis of diabetes in pregnancy. Although they are not diabetic, these pregnant women have risk factors. Thus, attention to these genes is important to the timeline of disease evolution and shows that this pregnant women group is a step forward toward diabetes compared with women without these risk factors.
Acknowledgments
The authors are thankful to the staff of the Laboratory for Experimental Research in Gynecology and Obstetrics and the Laboratory of Toxicogenomics and Nutrigenomics, Dr. Glenda Nicioli da Silva, Dr David Martins and Dr Jose Luiz Rybarczyk Filho for the Bioinformatics and Statistical Support, and Dr João Paulo Marcondes and Dr Tony Grassi for the technical contribution.
References
Footnotes
Collaborators João Paulo de Castro Marcondes.
Contributors RBG researched the data, wrote, discussed and reviewed/edited the manuscript. DCD contributed to the discussion and reviewed/edited the manuscript. DMFS, IMPC and MVCR contributed to the discussion and reviewed/edited the manuscript. FP, DCM and RAAC contributed to the researched data.
Funding This work was supported by FAPESP—Fundação de Amparo à Pesquisa do Estado de São Paulo/Brazil, grant number (2011/23749-1 and 2012/19362-7).
Competing interests None declared.
Patient consent Obtained.
Ethics approval Research Ethics Committee—Brazil Platform (CAAE: 14489013.0.0000.5411, number 291638).
Provenance and peer review Not commissioned; externally peer reviewed.
Data sharing statement No additional data are available.