Article Text

Abstract
Objective The main purpose of this study was to investigate the association of serum SerpinB1 levels and various parameters in patients with type 2 diabetes. The effect of canagliflozin (a sodium glucose cotransporter 2 (SGLT2) inhibitor), which can decrease circulating insulin levels, on serum SerpinB1 levels was also investigated. A recent study suggests that the serum levels of SerpinB1, also known as monocyte neutrophil elastase inhibitor, increase with insulin resistance, may have a protective effect for pancreatic β cells, and may decrease insulin resistance.
Research design and methods The study included 30 patients with type 2 diabetes hospitalized for glycemic control and 10 control subjects.
Results SerpinB1 levels were significantly higher in patients with type 2 diabetes, compared with that in heathy control subjects (10.01±3.59 vs 5.69±1.64 ng/mL, p<0.0001). Serum SerpinB1 levels had a significant negative correlation with low-density lipoprotein cholesterol (LDL-C) (p=0.0123). Serum SerpinB1 levels had a significant positive association or trend toward a positive association with age and with hemoglobin A1c (HbA1c), and significant negative association with LDL-C levels in some multiple regression analysis models. Patients treated with statins had a tendency toward higher serum SerpinB1 levels, compared with those patients not treated with statins. During a 3-day observation period both with and without canagliflozin treatment, the serum SerpinB1 levels did not change.
Conclusions Serum SerpinB1 levels are elevated in patients with type 2 diabetes compared with that in healthy subjects and are negatively correlated with serum LDL-C.
- Serpin
- Type 2 Diabetes
- LDL Cholesterol
This is an Open Access article distributed in accordance with the Creative Commons Attribution Non Commercial (CC BY-NC 4.0) license, which permits others to distribute, remix, adapt, build upon this work non-commercially, and license their derivative works on different terms, provided the original work is properly cited and the use is non-commercial. See: http://creativecommons.org/licenses/by-nc/4.0/
Statistics from Altmetric.com
Significance of this study
What is already known about this subject?
Insulin resistance in the liver results in an increase of the expression of SerpinB1 in the liver and the plasma levels. SerpinB1 promotes pancreatic β cell proliferation.
What are the new findings?
Serum SerpinB1 levels are elevated in patients with type 2 diabetes compared with that in healthy subjects and are negatively correlated with serum low-density lipoprotein cholesterol.
How might these results change the focus of research or clinical practice?
These results suggest that SerpinB1 may influence glucose and lipid metabolism in patients with type 2 diabetes.
Introduction
Serine proteinase inhibitors (Serpins) are a superfamily consisting of monomeric proteins with a size range of 350–500 amino acids that exist in 16 clades each containing 3–77 members.1 Currently, nine clades have been identified in humans as A to I.1 In clade B, SerpinB1, known as monocyte neutrophil elastase inhibitor, is expressed abundantly in the cytoplasm of polymorphonuclear neutrophils and inhibits the activity of proteases, such as neutrophil elastase, cathepsin G, and proteinase-3.2 ,3 Although the detailed physiological role of SerpinB1 remains unknown, SerpinB1 appears to regulate inflammation mainly by inhibiting these proteases.1 Some studies suggest that SerpinB1 may suppress the invasion of cancer cells, such as hepatocellular,4 lung,5 breast,6 and glioma cancer cells,7 while there is a report showing that SerpinB1 facilitates the motility of cancer cells.8 In addition, a recent study revealed that SerpinB1 is expressed also in colonic epithelial cells and may be protective against inflammation in patients with ulcerative colitis.9
Interestingly, recent reports showed that extracellular neutrophil elastase can enter the intracellular space and is associated with the degradation of insulin receptor substrate-1 (IRS-1).10 ,11 Furthermore, addition of neutrophil elastase to mouse and human hepatocytes decreased the IRS-1 protein content, resulting in the inhibition of insulin-stimulated Akt phosphorylation.12 In addition, neutrophil elastase deletion resulted in increased insulin sensitivity in hepatic and adipose tissues.12 These results suggest that neutrophil elastase may induce insulin resistance; in other words, its inhibition may contribute to an improvement in insulin sensitivity. Furthermore, a very recent report revealed that insulin resistance in the liver results in an increase of the expression of SerpinB1 in the liver and the plasma levels (to threefold). This study also found that SerpinB1 promotes pancreatic β cell proliferation. Treatment of mouse and human islets with recombinant SerpinB1 in vitro increased β cell proliferation by twofold.13 In addition, a significant positive correlation was noted between circulating SerpinB1 levels measured by enzyme-linked immunosorbent assay (ELISA) and insulin resistance in subjects with risk factor(s) for type 2 diabetes.13 However, there are no reports yet investigating circulating SerpinB1 levels in patients with type 2 diabetes and its associations with various markers associated with type 2 diabetes. Furthermore, if it is confirmed that the production of SerpinB1 in the liver is promoted under a state of insulin resistance, it is likely that the antidiabetic drugs that decrease circulating insulin levels may elevate circulating SerpinB1 levels and have a potential additional beneficial role for glycemic control. Sodium glucose cotransporter 2 (SGLT2) inhibitors are a new class of antidiabetic drugs that improve glycemic control by inhibiting glucose reabsorption,14–17 and these drugs can cause a compensatory decrease in serum insulin levels.18 ,19
Recently, we investigated the effect of canagliflozin (a SGLT2 inhibitor) on active glucagon like peptide-1 (GLP-1) levels and circulating betatrophin levels in poorly controlled patients with type 2 diabetes (under submission, registered at UMIN000016539). In the current study, we measured circulating SerpinB1 levels using frozen stored sera from that previous study.
Research design and methods
Patients
A total of 30 patients were studied. These patients participated in our previous study, named CANARIA (the effect of CANAgliflozin on active GLP-1 and betatRophin in patients with type 2 dIAbetes), which was performed from January 2015 to December 2015 at Dokkyo Medical University Koshigaya Hospital (Koshigaya, Japan), and were included in the final analysis of the study.
Key inclusion criteria in the study were (1) patients (male or female) aged 20 or over, (2) patients diagnosed as having type 2 diabetes (based on the criteria of the Japan Diabetes Society 2010),20 (3) patients with diet and exercise therapy for diabetes for at least 12 weeks prior to starting the study (if patients have severe diabetic complications, diet therapy alone is applicable), (4) patients for whom the type and dose of all antidiabetic drugs were not changed during the 4 weeks prior to starting the study, (5) patients who had not taken dipeptidyl peptidase 4 (DPP4) inhibitors, a GLP-1 receptor agonist, and SGLT2 inhibitors during the 4 weeks prior to starting the study, (6) patients with a hemoglobin A1c (HbA1c) more than or equal to 6.5% at enrollment, (7) patients who are hospitalized for glycemic control for type 2 diabetes, and (8) patients providing consent in writing for participation in this study. Key exclusion criteria were (1) patients with either type 1 diabetes, pancreatic diabetes, or secondary diabetes (Cushing syndrome, acromegaly, etc), diabetic coma, or diabetic precoma, (2) patients who are not candidates for canagliflozin treatment, (3) patients taking insulin, (4) heavy alcohol consumption (more than or equal to 60 g/day of pure alcohol), (5) patients who are either pregnant, lactating, or have the chance of being pregnant, (6) patients with severe renal dysfunction (Creatinine (Cr) >2.4 mg/dL or creatinine clearance (Ccr) <30 mL/min)), and (7) patients judged as inadequate for participation in this study by a medical doctor.
Clinical and laboratory tests showed no evidence of moderate or severe liver dysfunction or autoimmune disease in any patient. After enrollment and randomization, all patients were hospitalized during the study period.
The number of male/female in the groups without canagliflozin and those with canagliflozin were, respectively, 9/6 and 11/4. The mean age (year), body mass index (BMI)(kg/m2), and fasting plasma glucose (FPG)(mg/dL) and HbA1c (%) levels were, respectively, 59.4±12.5, 24.6±4.9, 176.5±54.4, 10.5±2.8 in the group without canagliflozin and, respectively, 57.9±10.6, 26.5±5.1, 174.7±71.5, 10.4±1.7 in the canagliflozin-treated group. There was no significant difference in age, BMI, FPG, and HbA1c between the two groups.
The inclusion criteria for the healthy subjects were subjects who did not have diabetes and who did not take any drugs. In the current study, the mean age of the type 2 diabetic patients was 58.7±11.4 years (range 36–76 years). Based on the age of patients with type 2 diabetes, we decided to recruit control subjects who were 35–75 years old. The average age of the control subjects was 53.8±6.3 years (range 43–67 years). There was no significant difference in age between the control subjects and the patients with diabetes.
The characteristics of the total 30 patients on enrollment and the 10 control subjects newly recruited for the current study are shown in table 1.
Clinical characteristics of the control subjects and patients with type 2 diabetes
Methods
The CANARIA study had a randomized, open-label design and was registered at UMIN 000016539. The detailed methods for the study are described in the previous CANARIA study (under submission). In brief, patients were randomly assigned into two groups (control group (n=15) and canagliflozin-treated group (n=15)). On day 2 (the next day after hospitalization), patients in the canagliflozin-treated group took canagliflozin 100 mg 1 Tab (before lunch), and from day 3 onward, the patients in this group took canagliflozin 30 min before breakfast. From day 5 onward, all patients (both groups with diet and with diet+canagliflozin) took teneligliptin (a DPP4 inhibitor). After 3 days from the start of teneligliptin treatment, if the glycemic control of the patients was not sufficient, the additional use of all antidiabetic drugs including insulin was permitted.
Blood tests were performed generally at 9:00 a.m. after overnight fasting for at least 10 hours on days 2 and 5 after hospitalization. After the blood was collected, it was immediately placed into specific test tubes for different assays, and then rapidly centrifuged at 1500 rpm for 5 min to separate the serum or plasma from the clot-containing blood cells. Samples for SerpinB1analysis were stored frozen at −80°C until analysis. In the current study, a cross-sectional evaluation was performed using blood samples on day 2. At the time of sampling, measurements of body weight (BW) and blood pressure were also performed.
Measurement of serum SerpinB1
Fasting serum SerpinB1 levels were measured using a human SerpinB1 ELISA kit (sandwich ELISA) (LifeSpan Biosciences, Seattle, Washington, USA) in duplicate. Based on the manufacturer's information, the intra-assay and inter-assay coefficient of variation (CV) was <10% and <12%, respectively,21 and in our laboratory, these values were, respectively, 3.68% and 3.78%.
Measurement of the CAVI index
For the index for arterial stiffness or atherosclerosis, the cardio-ankle vascular index (CAVI) was used. The CAVI index was assessed on left side using a specific apparatus, VaSera VS3000 (Fukuda Denshi, Tokyo, Japan).
Measurements of FPG and insulin levels
FPG was evaluated immediately after blood collection using an automated glucose oxidase analysis (Glucose Auto Stat GA1160; Arkray, Kyoto, Japan). HbA1c was also measured immediately after collection of blood in a test tube containing EDTA-2Na using high-performance lipid chromatography (HPLC; Hi-Auto A1C, HA8150; Arkray). Plasma insulin (immune-reactive insulin) was measured by a chemiluminescent enzyme immunoassay (CLEIA) using the Lumipulse Presto Insulin Kit (Fujirebio, Tokyo, Japan).
Measurement of serum lipids. Serum low-density lipoprotein cholesterol (LDL-C), high-density lipoprotein cholesterol (HDL-C), and serum triglycerides (TG) were measured using enzymatic assays. The Determiner L TG reagents (Kyowa Medics, Tokyo, Japan) were used for measurements of TG. HDL-C was measured directly by a method based on selective solubilization of different lipoproteins by proprietary detergents using Cholestest N HDL-C (Daiichi Pure Chemicals, Tokyo, Japan). LDL-C was also measured directly using Cholestest LDL (Daiichi Pure Chemicals), rather than indirectly using the Friedwald equation.
Estimated glomerular filtration rate
For the assessment of renal function, the estimated glomerular filtration rate (eGFR) was calculated using a formula as follows: eGFR (mL/min/1.73 m2)=194×Cr (mg/dL)−1.094×age (year)−0.287 for men, and eGFR (mL/min/1.73 m2)=194×Cr (mg/dL)−1.094×age (year)−0.287×0.739 for women. Cr indicates serum creatinine levels.
Ethical considerations: All subjects gave written informed consent for inclusion in this study. The original CANARIA study and the current study were respectively approved by the Local Ethics Committee at our hospital and were performed according to the guidelines of the Declaration of Helsinki.
Statistical methods: For comparisons of two time points (at baseline and after 3 days with and without canagliflozin treatment), the paired t-test was used. All of the data used for comparisons for the two time points followed a normal distribution as confirmed by a χ2 goodness of fit test. Comparisons between the two groups were made using an unpaired t-test. All of the data followed a normal distribution as confirmed by a χ2 goodness of fit test. Based on evaluation of equal of variances confirmed by F test, the Student's t-test or the Welch's t-test was chosen. For comparison of SerpinB1 levels at baseline among the four groups classified by diabetic drugs taken on hospitalization, all data followed a normal distribution, and the homogeneity was evaluated by the Bartlett test. All of the groups had equal variances. Therefore, a parametric comparison was performed using one-way analysis of variance (ANOVA). The ANOVA was significant, and a post hoc Holm test was conducted. Multiple regression analysis with SerpinB1 as the dependent variable was performed using five models. Independent variables were as follows: model 1: LDL-C, eGFR, HbA1c, and age, model 2: LDL-C, HbA1c, age, BMI, and insulin, model 3: LDL-C, HbA1c, age, BMI, log10-high sensitivity C reactive protein (hsCRP), and log10-gamma-glutamyl transpeptidase (GGT), model 4: LDL-C, TG, uric acid (UA), and systolic blood pressure (SBP), and model 5: LDL-C, HbA1c, age, insulin, and CAVI index. Model 5 was calculated using only 23 patients, because the CAVI index and insulin measurement was performed in 24 and in 29 patients, respectively. SerpinB1 levels and all of the independent variables used in the multiple regression analysis followed the normal distribution. In each model, multiple regression analysis was performed by including all of the selected independent variables (normal multiple regression analysis). All statistical analyses were performed using Ekuseru-Toukei 2012 software (Social Survey Research Information Co., Tokyo, Japan). A p value of <0.05 was accepted as indicating statistical significance (two-sided).
Results
The serum levels of SerpinB1 were significantly higher in the patients with type 2 diabetes compared with that in the healthy controls (10.01±3.59 (range with 1.93–17.09) vs 5.69±1.64 ng/mL (range with 2.79–8.40)) (p <0.0001) (figure 1A). When the patients with type 2 diabetes were divided into two groups, HbA1c ≤9.0% (n=16) or HbA1c >9.0% (n=14), there was no significant difference in serum SerpinB1 levels between these groups, although a slight tendency toward an increase of SerpinB1 levels was noted in the HbA1c >9.0% subgroup compared with that in the HbA1c ≤9.0% subgroup; 10.85±4.00 vs 9.28±3.15 ng/mL (p=0.2395) (figure 1B).
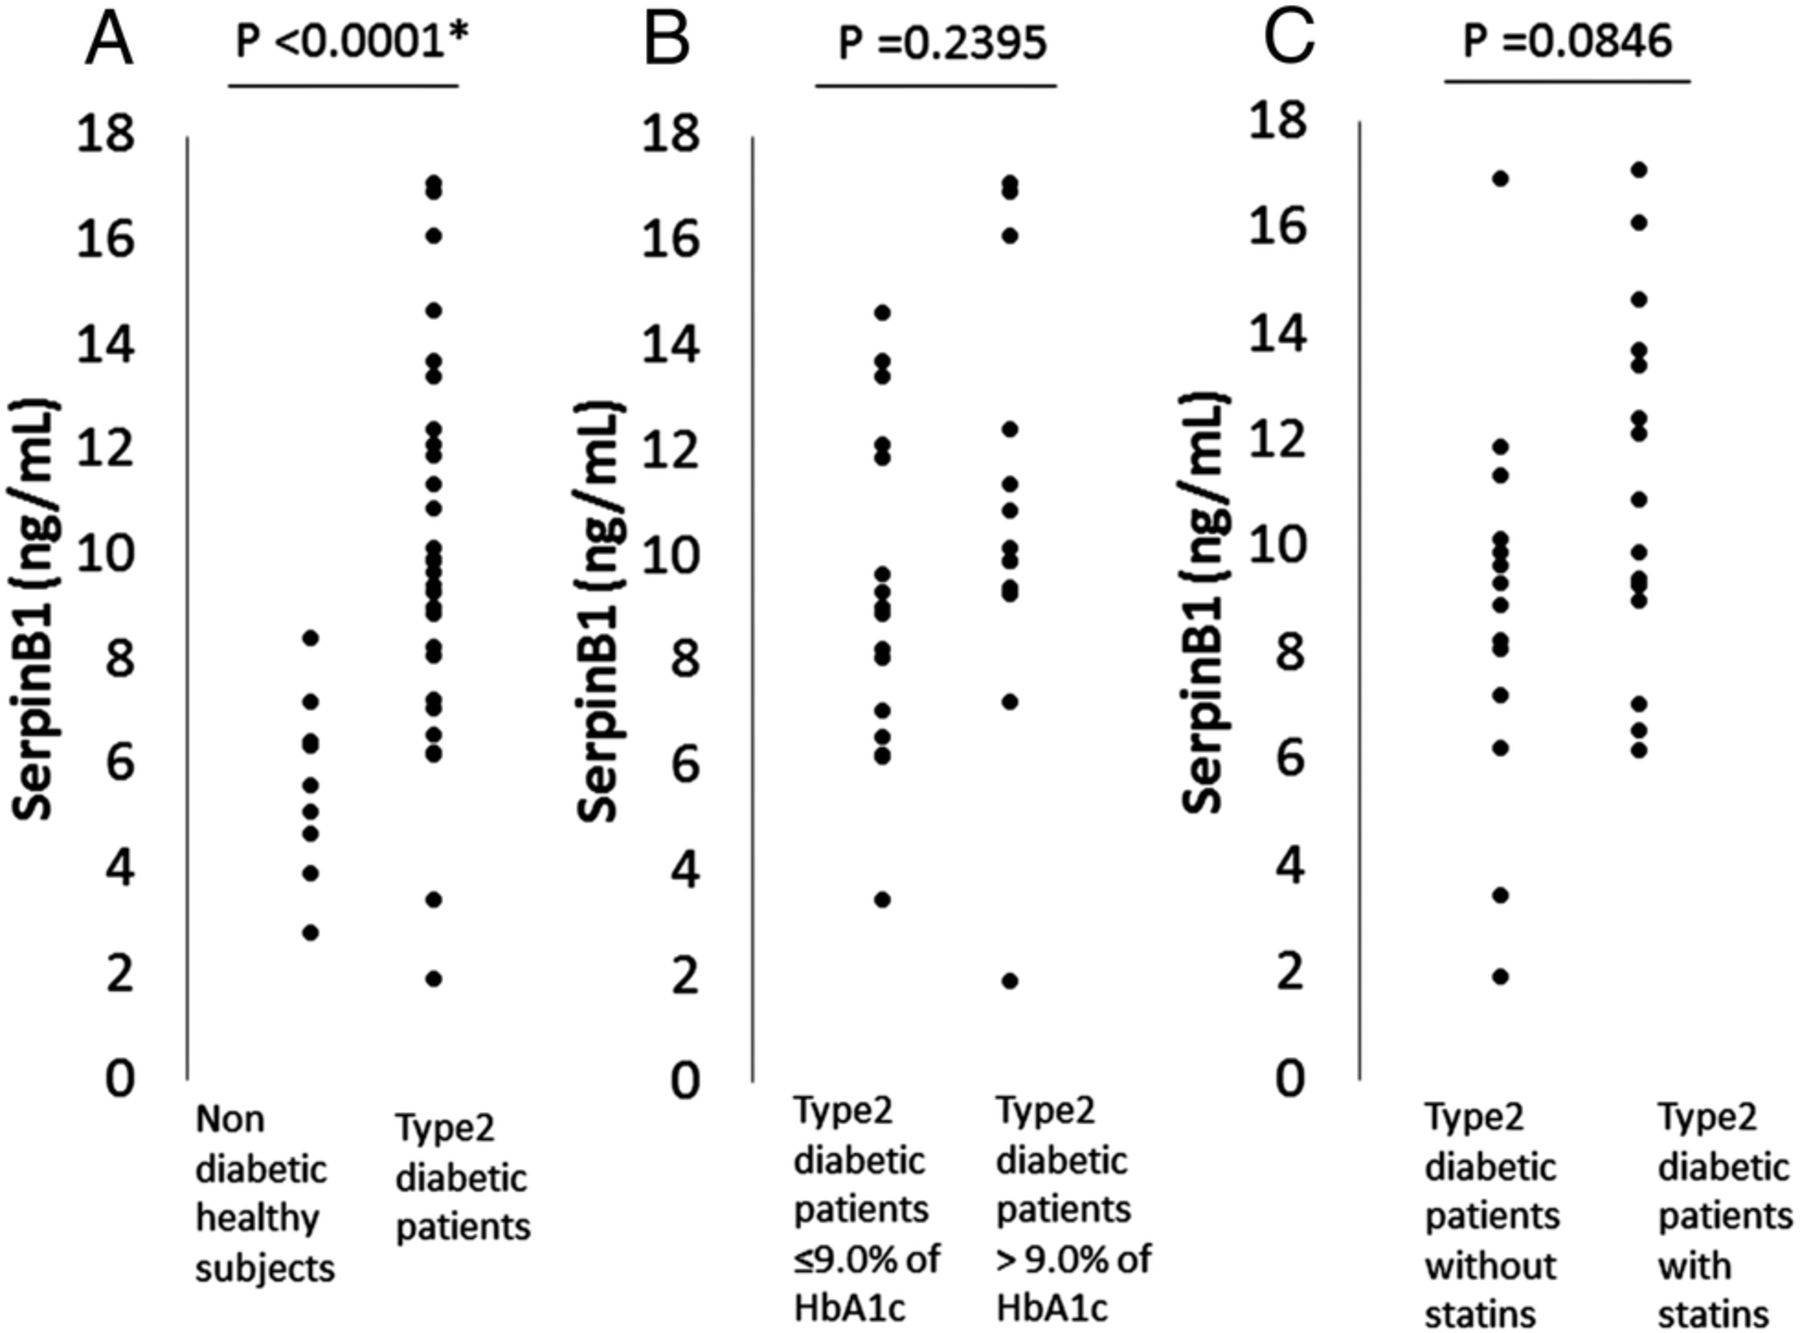
(A). Serum SerpinB1 levels in non-diabetic healthy subjects (n=10) and in patients with type 2 diabetes (n=30). (B) SerpinB1 levels in subgroups with either hemoglobin A1c (HbA1c) ≤9.0% (n=16) or HbA1c >9.0% (n=14) in patients with type 2 diabetes. (C) SerpinB1 levels in subgroups either with statins (n=16) or without statins (n=14).
When the patients were divided into two groups of patients treated with (n=16) and without statins (n=14), serum SerpinB1 levels and LDL-C levels were, respectively, 11.07±3.30 vs 8.80±3.64 ng/mL and 101.3±34.1 vs 124.4±22.8 mg/mL (p=0.0405). There was a tendency toward higher values in the SerpinB1 levels in a statins-treated group, compared with that in a group not treated with statins (p=0.0846) (figure 1C). In addition, there was a tendency toward a negative correlation between SerpinB1 and LDL-C levels in the group not treated with statins (R=−0.5282, p=0.0522), but not in the group with statins (R=−0.2994, p=0.2600). Among the four treatment groups; no drugs or α glucosidase inhibitors (αGI)-only group (n=4), insulin secretagogues group ((sulfonylureas (SU) or glinides) (n=4), insulin sensitizers group (pioglitazone and/or metformin) (n=10), and the combination therapy group ((SU or glinides)+(pioglitazone and/or metformin) ±αGI) (n=12), there was no significant difference in the SerpinB1 levels.
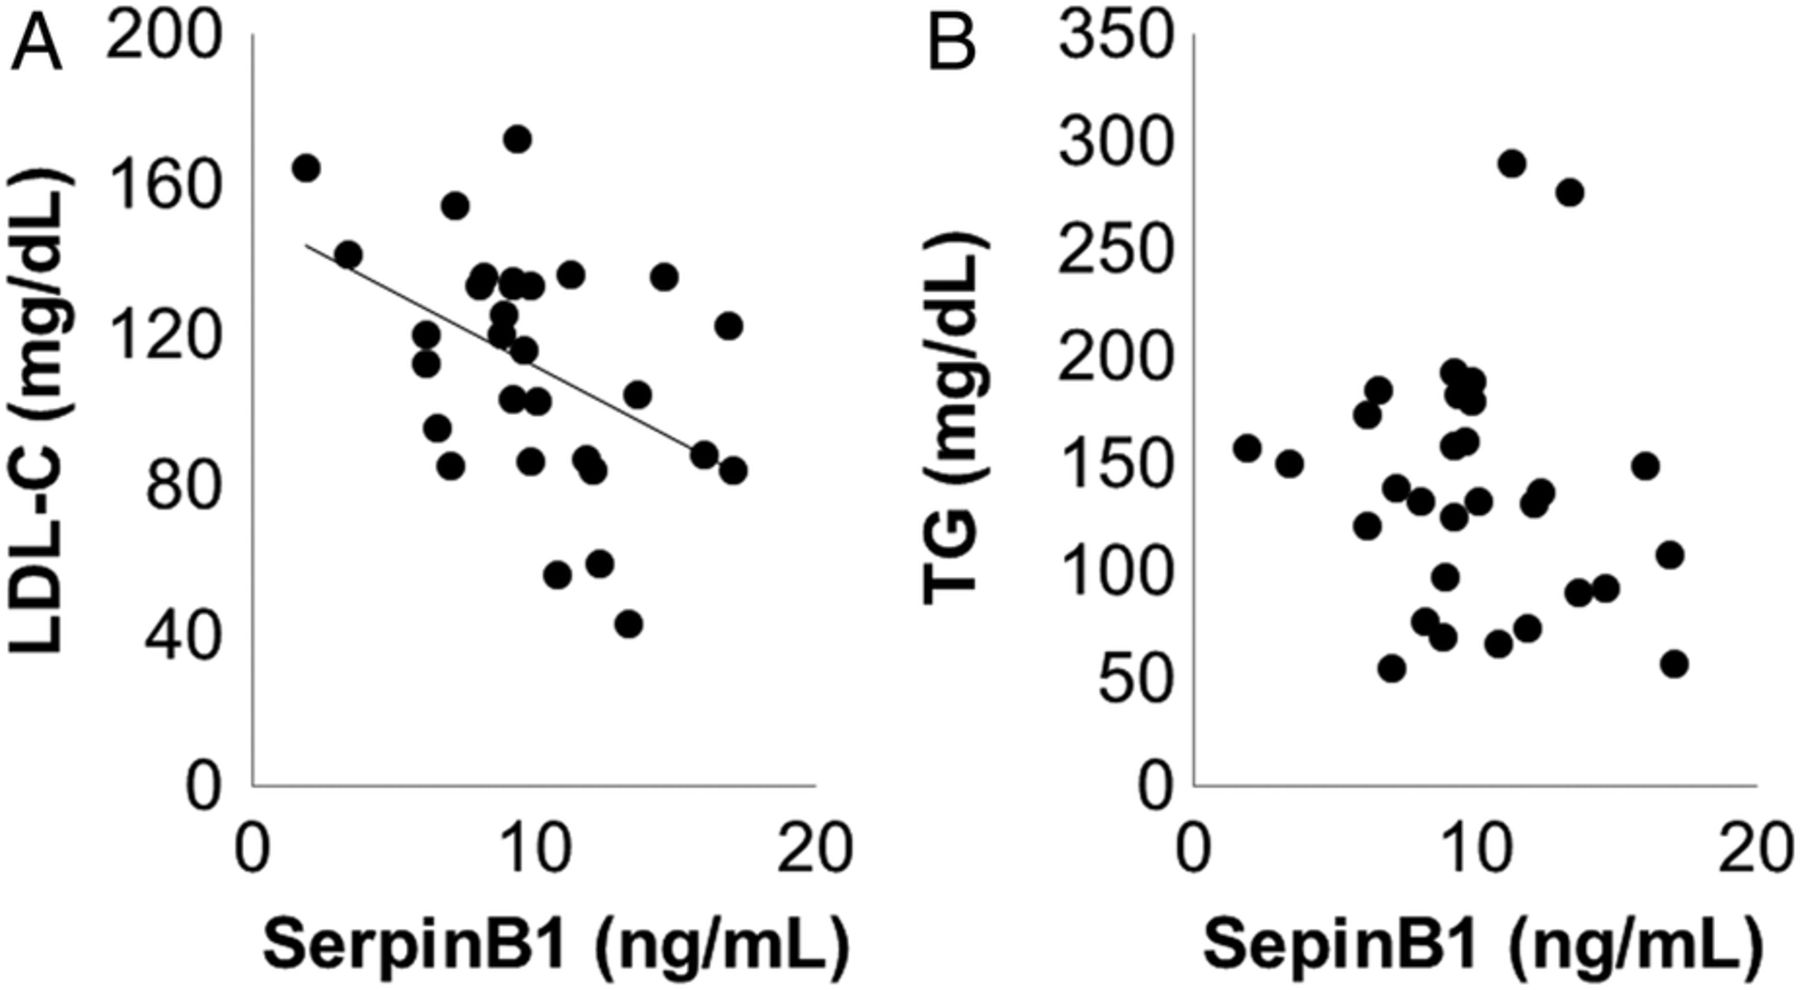
The results of the correlation of SerpinB1 levels with multiple variables, and the multiple regression analysis with SerpinB1 levels as the dependent variable are, respectively, summarized in tables 2 and 3. There was a significant negative correlation between SerpinB1 and LDL-C, while no correlation of SerpinB1 with TG was found (also in figure 2A, B). In the multiple regression analyses, SerpinB1 levels had a significant negative association with LDL-C levels in models 1–5. SerpinB1 levels had either a significant positive association (models 2, 3) or trend toward a positive association (model 1) with HbA1c, and a significant positive association (model 1, 2) or a trend toward a positive association (model 3) with age. Furthermore, SerpinB1 levels have a negative association with circulating insulin levels in one of the multiple regression analysis models (model 2). The SerpinB1 levels; 10.00±2.85 to 10.18±4.00 ng mL (p=0.8747) and 10.02±4.32 to 9.68±4.96 ng/mL (p=0.7298), did not significantly change during canagliflozin treatment for 3 days (n=15) and after a 3 day observation without canagliflozin (n=15), respectively. There was no significant difference in the change of the SerpinB1 levels at baseline and after 3 days between the groups with and without canagliflozin (p=0.7248). There was no significant correlation between SerpinB1 levels and FPG at baseline in the canagliflozin group and control group. Similarly, in both groups, there was no significant correlation between the difference in SerpinB1 levels and in FPG at baseline and after 3 days.
The correlation of SerpinB1 with multiple variables in patients with type 2 diabetes
Multiple regression analysis with SerpinB1 as the dependent variable

The correlation between SerpinB1 and either low-density lipoprotein cholesterol (LDL-C) (A) or triglyceride (TG) (B) in patients with type 2 diabetes.
Discussion
In the current study, we found that serum SerpinB1 levels were almost twofold higher in patients with type 2 diabetes, compared with the levels in control subjects. In addition, SerpinB1 levels had a significant positive association or trend toward a positive association with HbA1c in some multiple regression analysis models although the association was not found in a simple correlation analysis. Furthermore, SerpinB1 levels were negatively associated with circulating insulin levels in one multiple regression analysis model. The detailed reason for this result remains unknown; however, we speculate that the elevation of SerpinB1 levels in the circulation in these patients is likely due to compensatory mechanisms assuming that SerpinB1 can promote pancreatic β cell proliferation.13 In fact, a previous study showed that a significant positive correlation was noted between circulating SerpinB1 levels and insulin resistance in non-diabetic subjects with one or more risk factor for type 2 diabetes,13 suggesting a compensatory elevation. It should be noted that the patients' backgrounds in the previous study differed compared with that in the current study composed of patients with poorly controlled type 2 diabetes. In addition, there is a report showing that serum elastase activity was significantly increased in diabetic men and had a tendency toward an increase in diabetic women compared with that in non-diabetic subjects.22 This may also support our hypothesis that serum SerpinB1 levels increase by compensatory mechanisms in patients with type 2 diabetes since SerpinB1 has neutrophil elastase inhibitory activity. Importantly, SerpinB1 levels were not basically influenced by eGFR in the current study although a mild non-significant tendency of a negative correlation between SerpinB1 and eGFR was observed, suggesting that circulating SerpinB1 levels are probably independent of renal function. On the other hand, SerpinB1 levels might be influenced by age because SerpinB1 levels showed a significant positive association or trend toward a positive association with age in some multiple regression analysis models. The reason for this finding remains unclear.
Interestingly, we found a significant negative correlation between serum SerpinB1 and LDL-C levels. The negative association was also observed in the multiple regression analysis models. Although it is difficult to explain the reason for the result, a previous report revealed that there was a positive (but not negative) significant correlation of serum neutrophil elastase with LDL-C.23 Notably, it is also reported that human plasma LDL can promote the release of elastase from polymorphonuclear cells.24 This may suggest the idea that LDL might inversely inhibit the release of SerpinB1 as an elastase inhibitor, although there is still no evidence for this hypothesis. Therefore, it may be interesting to investigate in future studies whether the possible negative association between SerpinB1 and LDL-C found in the current study is based on direct mechanisms or not.
Of interest, SerpinB1 levels had a tendency toward higher values in patients treated with statins, compared with that in patients not treated with statins. In addition, the association between SerpinB1 and LDL-C levels decreased in patients treated with statins, compared with that in patients not treated with statins. Therefore, although the detailed mechanisms are unknown, statins may influence SerpinB1 levels, probably to different degrees when compared with the effect on LDL-C levels, and may be able to weaken the potential negative association between these parameters. Based on our results, it may be interesting to investigate the effect of statins on serum SerpinB1 levels in prospective studies.
In the current study, we also investigated the effect of canaglifozin, a SGLT2 inhibitor, on SerpinB1 levels in patients with type 2 diabetes, because the production of SerpinB1 in the liver is promoted under a state of insulin resistance. Therefore, it is likely that the antidiabetic drugs, such as SGLT2, which can decrease circulating insulin levels,18 ,19 elevate circulating SerpinB1 levels. However, contrary to our expectation, canagliflozin treatment did not influence serum SerpinB1 levels, despite the fact that the plasma glucose and insulin levels were significantly decreased by canagliflozin treatment in this study (data not shown). In the current study, SerpinB1 levels were measured at baseline and after 3 days because the measurement was made using the reserved sera from our recent study as previously described. However, the length of treatment may have been too short to detect the change in SerpinB1 levels. Therefore, we speculate that our negative result may be based, at least in part, on the relatively short term (3 days) of treatment. SerpinB1 promotes pancreatic β cell proliferation13 and it is likely that the inhibition of neutrophil elastase probably improves insulin resistance.12 In this aspect, it may be important to investigate whether SGLT2 inhibitors, which can decrease circulating insulin levels, are able to influence the circulating SerpinB1 levels in longer term observations. Furthermore, it may also be interesting to evaluate the influence of other antidiabetic drugs, such as insulin secretagogues, insulin sensitizers, and the combination with these drugs, on serum SerpinB1 levels in prospective studies because these drugs affect circulating insulin levels. However, there was no significant difference in SerpinB1 levels among the patient groups treated with these drugs in a cross-sectional analysis in the current study; this may be at least partially due to the fact that the difference of sample sizes was large in four diabetic drugs groups and the sample sizes in the no drugs or αGI-only group and insulin secretagogues group were small.
In the current study, the concentration of SerpinB1 in healthy control subjects was lower than that reported in a previous study.13 The exact reason for the difference is unknown; however, the difference of the subjects' background, such as ethnicity and age, and the difference in the measurement methods may have contributed in part to the different findings. In the current study, the number of patients studied was relatively small, which is one limitation of this study.
In conclusion, we found that serum SerpinB1 levels were higher in patients with type 2 diabetes, compared with that in heathy controls. Serum SerpinB1 levels significantly negatively correlated with LDL-C levels. In addition, serum SerpinB1 levels had a significant positive association or a trend toward a positive association with age and HbA1c, and a significant negative association with LDL-C levels in some of the multiple regression analysis models. Canagliflozin (a SGLT2 inhibitor) treatment did not influence serum SerpinB1 levels. An additional study is needed to clarify the clinical significance of the results of this study.
Acknowledgments
The original CANARIA study was supported by funds from the Mitsubishi Tanabe Pharma Corp (Osaka, Japan).
References
Footnotes
Contributors KT, KH, TT, RN, MS, TT, TI researched data. KT wrote this manuscript. TI reviewed this manuscript.
Competing interests None declared.
Patient consent Obtained.
Ethics approval Local Ethics Committee at Dokkyo Medical University Koshigaya Hospital.
Provenance and peer review Not commissioned; externally peer reviewed.
Data sharing statement No additional data are available.