Article Text

Abstract
Objective The glycemic index (GI) of dietary carbohydrate is thought to affect glucose homeostasis. Recently, the Effect of Amount and Type of Dietary Carbohydrates on Risk for Cardiovascular Heart Disease and Diabetes Study (OmniCarb) trial reported that a low-GI diet did not improve insulin sensitivity. We conducted this ancillary study of the OmniCarb trial to determine the effects of GI and carbohydrate content on glucose homeostasis and inflammation.
Research design and methods OmniCarb was a randomized cross-over feeding study conducted in overweight or obese adults without diabetes (N=163). Participants were fed each of 4 diets for 5 weeks with 2-week washout periods. Weight was held constant. Diets were: high GI (GI≥65) with high carbohydrate (58% kcal), low GI (GI≤45) with low carbohydrate (40% kcal), low GI with high carbohydrate, and high GI with low carbohydrate. We measured glycated albumin (GA), fructosamine, and high sensitivity C reactive protein (CRP) at baseline and following each dietary period. These biomarkers were compared within-person between diets.
Results The study population was 52% female and 50% black. Mean age was 53 (SD, 11) years; mean body mass index was 32 (SD 6) kg/m2. Reducing GI had no effect on GA or fructosamine, but increased fasting glucose in the setting of a high-carbohydrate diet (+2.2 mg/dL; p=0.02). Reducing carbohydrate content decreased GA in the setting of a high-GI diet (−0.2%; p=0.03) and decreased fructosamine in the setting of a low-GI diet (−4 µmol/L; p=0.003). Reducing carbohydrate while simultaneously increasing GI significantly reduced both GA (−0.2%; p=0.04) and fructosamine (−4 µmol/L; p=0.009). Neither reducing GI nor amount of carbohydrate affected insulin or CRP.
Conclusions Reducing carbohydrate, regardless of high or low GI, decreased GA and fructosamine. This suggests that reducing carbohydrate content, rather than GI, is a better strategy for lowering glycemia in adults at risk for diabetes.
Trial registration number NCT00608049.
- Glycemic Index Diet
- Carbohydrate(s)
- Randomized Controlled Trial
- Glycated Proteins
This is an Open Access article distributed in accordance with the Creative Commons Attribution Non Commercial (CC BY-NC 4.0) license, which permits others to distribute, remix, adapt, build upon this work non-commercially, and license their derivative works on different terms, provided the original work is properly cited and the use is non-commercial. See: http://creativecommons.org/licenses/by-nc/4.0/
Statistics from Altmetric.com
Significance of this study
What is already known about this subject?
The glycemic index of dietary carbohydrate is thought to affect glucose homeostasis.
Recently, the OmniCarb Trial reported that lowering dietary GI did not improve insulin sensitivity.
What are the new findings?
In the setting of an isocaloric feeding study in adults without diabetes, reducing dietary carbohydrates lowered markers of 2-3 week glycemia (i.e. gycated albumin and fructosamine).
Changes to glycemic index had no effect on glycated albumin or fructosamine
Neither reducing dietary carbohydrates nor modifying glycemic index affected C-reactive protein
How might these results change the focus of research or clinical practice?
Reducing carbohydrate content, rather than GI, is a better strategy for lowering glycemia in adults at risk for diabetes.
Introduction
Randomized clinical trials examining the effects of dietary patterns on traditional cardiovascular disease risk factors have helped inform national dietary guidelines.1 ,2 Recently the Effect of Amount and Type of Dietary Carbohydrates on Risk for Cardiovascular Heart Disease and Diabetes Study (OmniCarb) trial tested whether modifying the amount or type of carbohydrate could reduce cardiovascular risk factors.3 It was found that at high dietary carbohydrate content, reducing glycemic index (GI) decreased insulin sensitivity and increased low-density lipoprotein (LDL) cholesterol, but did not affect high-density lipoprotein (HDL) cholesterol, triglycerides or blood pressure.3 In this trial, insulin sensitivity was determined by an oral glucose tolerance test, conducted in the morning after an overnight fast; glucose and insulin were measured at seven time points. However, the oral glucose tolerance test does not represent the overall glycemic effects of dietary patterns that vary in amount and type of carbohydrate. Glycated albumin and fructosamine, markers of 2–3-week cumulative exposure to blood glucose, may be especially well suited for evaluating the effects of dietary carbohydrates on glycemia in an intermediate-term trial setting. Both glycated albumin and fructosamine are formed by glycation reactions during which glucose binds with intravascular proteins, including albumin4 ,5 and are associated with risk of diabetes6 ,7 and cardiovascular disease events.8
It has been hypothesized that the associations between GI and risk of diabetes and cardiovascular disease are mediated through low-grade inflammation.9 ,10 Observational studies have shown that C reactive protein, a marker of inflammation, is associated with both diabetes11 and cardiovascular disease.12 Further, several studies have described cross-sectional associations between GI and C reactive protein;13–16 however, this has not been observed prospectively.17
The objectives of this paper were (1) to determine the effects of diets that vary in carbohydrate type and amount on intermediate-term markers of glycemia in an overweight and obese population using glycated albumin and fructosamine, (2) to evaluate whether risk factors associated with diabetes modify the association between diet and intermediate-term markers of glycemia, (3) to compare the cross-sectional association of these markers with traditional diabetes risk factors, and (4) to assess whether changes in GI or amount of dietary carbohydrate affect C reactive protein. We hypothesize that reducing GI and reducing content of carbohydrate will each lower intermediate-term glycemia measured by glycated albumin or fructosamine. Our secondary hypothesis is that lowering GI or content of carbohydrate would lower inflammation measured by C reactive protein.
Research design and methods
OmniCarb was an investigator-initiated National Heart, Lung, and Blood Institute-sponsored study, whose rationale and main results have been published.3 OmniCarb was a randomized, controlled, cross-over trial, comprising four dietary intervention periods. Participants each consumed four distinct diets in random order. The four diets varied by GI (≥65 vs ≤45) and carbohydrate amount (40% vs 58% kcal) as follows: high carbohydrate and high GI, high carbohydrate and low GI, low carbohydrate and high GI, or low carbohydrate and low GI. A detailed description of the diets is in table 1. GI is a measure of the amount that blood glucose increases after a standardized amount of carbohydrates.18 It is a relative scale based on the area under the glucose curve during a 2-hour period after eating a standardized amount of a food item.18 For example, using white bread as a reference food, white rice and baked potatoes have a higher GI, while oat bran bread and long-grain rice have a lower GI.19 Currently, glucose content is the reference.
Nutrient composition of the four diets used in the OmniCarb*
Participant recruitment
Trial participants were adult men and women, residing in and around Boston, Massachusetts, and Baltimore, Maryland, USA. Participants were aged 30 and older with systolic blood pressure (SBP) and diastolic blood pressure (DBP) ranging from 120 to 159 and 80 to 99 mm Hg, respectively. Persons with a prior diagnosis of diabetes or cardiovascular disease and persons taking medications for blood pressure, lipids, or diabetes were excluded from trial participation.3 Institutional Review Boards at Johns Hopkins University, Brigham & Women's Hospital, and the Harvard School of Public Health approved the study protocol.
Controlled feeding
Feeding by cohort began in August 2009 and was completed in September 2010. Participants were randomly assigned to one of eight dietary sequences of the four diets and received 100% of their meals from each study center.3 Each diet was designed to be healthful like the Dietary Approaches to Stop Hypertension (DASH) diet1 using commonly available foods and was reduced in saturated fat, cholesterol, and sodium, but rich in fruits, vegetables, fiber, potassium, and other minerals. Both fiber and sodium content was constant across diets. Since many low-GI foods are high in fiber and many high-GI foods are low in fiber, we established similar fiber contents across diets by including low-fiber, low-GI foods such as pasta and high-fiber high-GI foods such as instant oatmeal and bananas, and adding unprocessed wheat bran to 3 of the breakfasts and 2–3 dinners.
Study participants underwent an 8-day run-in phase during which each of the four study diets was given for 2 days. Afterward, participants consumed each diet over a 5-week period followed by a 2-week washout, during which they ate a self-selected diet. Calorie targets were determined for each participant based on their body size, sex, and physical activity level. Calorie intake was adjusted throughout the trial to keep weight within 2% of participants' baseline values. Participants were encouraged to maintain the same activity levels and alcohol consumption throughout the study. Attendance at meals was recorded. Participants were required to eat one principal meal on-site and were observed while eating. Participants were sent home with the remaining two meals. Every day, participants completed a diary in which they listed their consumption of protocol and non-protocol foods. Overall, adherence was high; all study foods with no non-study foods were consumed on 96% of person-days.3 Any alcohol consumption was reported on 11% of person-days.
Measurement of outcomes: fasting glucose, fasting insulin, glycated albumin, fructosamine, and high sensitivity C reactive protein
Fasting laboratory specimens were collected at baseline prior to randomization and at the completion of each 5-week feeding period. The mean number of weeks between laboratory measurements in consecutive diet periods was 7.6 (SD 2.0). Glucose and insulin were measured in serum after a brief storage period soon after specimen collection as part of the original trial protocol.3 Additional plasma specimens were stored at −70°C. Glycated albumin (Asahi Kasei Lucica GA-L; Asahi Kasei Pharma Corporation, Tokyo, Japan), fructosamine, and high sensitivity C reactive protein were measured in year 2012 using stored plasma specimens with a Siemens Dimension Vista V.1500 chemical analyzer (Siemens Healthcare Diagnostics, Glasgow, DE, Germany). Glycated albumin was assessed via an enzymatic method, involving oxidase and peroxidase reactions that yield a salt with a blue–purple pigment, measured via spectroscopy. Fructosamine was measured with a colorimetric assay to detect the rate at which ketoamines reduce nitrotetrazolium-blue to formazan in an alkaline solution. The rate of formation of formazan is directly proportional to the concentration of fructosamine. The observed interassay coefficients of variation for glycated albumin and fructosamine were 7.6% (glycated albumin, mean 13.7%) and 2.0% (fructosamine, mean 309 μmol/L), while manufacturer reported performance is <3% and 2.9%, respectively. Glycated albumin was expressed as a percentage of total serum albumin according to the manufacturer's instructions: ((glycated albumin concentration in g/dL/serum albumin concentration in g/dL)×100/1.14)+2.9. In a general population without diabetes, glycated albumin ranges from 7.7% to 15.4%; while fructosamine ranges from 89 to 267 μmol/L.8 High sensitivity C reactive protein was also measured in stored plasma using an assay of polystyrene particles coated with monoclonal antibodies specific to C reactive protein.20 The C reactive protein assay's coefficient of variation was 2.3% (mean 3.0 mg/L).
Other covariate measurements and definitions
Body mass index (BMI) was calculated using baseline height and weight measurements and categorized as overweight (25–29.9 kg/m2) or obese (≥30 kg/m2). Waist circumference (cm) was measured at the level of the umbilicus. The homeostasis model assessment index (HOMA) was calculated as follows: HOMA=((fasting serum insulin concentration in μU/mL)×(fasting serum glucose concentration in mg/dL))/405.21 HOMA was further dichotomized based on the baseline median value of ≥1.48 units. Ultracentrifugation was used to prepare LDL for cholesterol measurements.3 HDL-cholesterol was measured by a precipitation method using dextran sulfate 50 000 MW and magnesium chloride.3 Cholesterol and triglycerides were measured by enzymatic assays. Triglycerides were dichotomized using the baseline median value of 83.8 mg/dL. Hypertensive status (yes or no) was determined by an average of three baseline blood pressure measurements for which mean SBP was >140 mm Hg or mean DBP was >90 mm Hg.
Statistics
The main outcomes examined in this study were plasma glycated albumin and plasma fructosamine. Serum fasting glucose and insulin were reported previously3 but are included here as relevant outcomes to the research question. C reactive protein was measured to examine the effects of the diets on inflammation. The primary comparison in this study was the end-of-period concentrations of the primary outcomes by diet. There were six pairs of dietary differences for each outcome: (1) high carbohydrate, high GI versus high carbohydrate, low GI; (2) low carbohydrate, high GI versus low carbohydrate, low GI; (3) high carbohydrate, high GI versus low carbohydrate, high GI; (4) high carbohydrate, low GI versus low carbohydrate, low GI; (5) high carbohydrate, high GI versus low carbohydrate, low GI; and (6) high carbohydrate, low GI versus low carbohydrate, high GI.
Although this four-period cross-over study could be analyzed as a factorial design, we considered that GI may have a stronger effect in a diet with high-carbohydrate than low-carbohydrate content and that carbohydrate amount may have a stronger effect when the GI is high rather than low. Therefore, a factorial analysis was considered inappropriate as described in the trial's protocol.3
In addition, using the high-GI, high-carbohydrate diet for comparison, we performed stratified analyses by covariates known a priori to be associated with insulin resistance, namely, race (non-Hispanic black vs white), baseline hypertensive status, baseline triglycerides, baseline BMI, baseline HOMA, baseline fasting glucose (<100, ≥100 mg/dL), baseline glycated albumin (based on the population median ≤14.8%, >14.8%), and baseline fructosamine (based on the population median ≤234.5, >234.5 μmol/L). All of the above comparisons between strata were performed via generalized estimating equation regression models, using a Huber and White robust variance estimator,22 which assumed an exchangeable working correlation matrix. p Values for each stratum were generated using interaction terms.
Moreover, in the baseline period, when participants were eating their usual self-selected diets, we evaluated the association between glycated albumin and fructosamine with BMI, waist circumference, HDL-cholesterol, LDL-cholesterol, triglycerides, serum glucose, serum insulin, and HOMA using Pearson's coefficients and linear regression models adjusted for age, sex, and race.
All analyses were performed in Stata V.14.0 (Stata Corporation, College Station, Texas, USA). Statistical significance was defined as p≤0.05 without Bonferroni correction.23 We did not correct the α level because the new outcomes, glycated albumin and fructosamine, measure the same metabolic process; fructosamine like glycated albumin is formed during the glycation reaction with blood proteins.
During the laboratory process, it was discovered that 95 of 749 (13%) samples were slightly hemolyzed and 17 (2%) were moderately hemolyzed based on visual inspection. Both slight and moderate hemolysis were associated with significant decreases in glycated albumin (−1.2% and −6.1%; p<0.001) and significant increases in fructosamine (10.7 and 24.7 μmol/L; p<0.001). As a result, we excluded these samples from all glycated albumin and fructosamine comparisons. We further excluded participants who did not have a blood sample for glycated albumin or fructosamine in at least two visits (N=3), the minimum number of data points necessary for a comparison. Both hemolysis and other missing data specimens were found to be evenly distributed between feeding periods and diets. A sensitivity analysis excluding hemolyzed samples from glucose and insulin comparisons had virtually no effect on our analysis (results not shown).
Results
Baseline characteristics
Baseline characteristics of the randomized, study population are in table 2. Overall, the mean age was 52.6±11.4 years; 52% of the participants were women and 50% were non-Hispanic black race. Furthermore, 56% of the study population were obese and 26% had hypertension.
Baseline characteristics of trial participants (N=163), mean (SD) or N (%)
Comparison of glycemic markers between diets
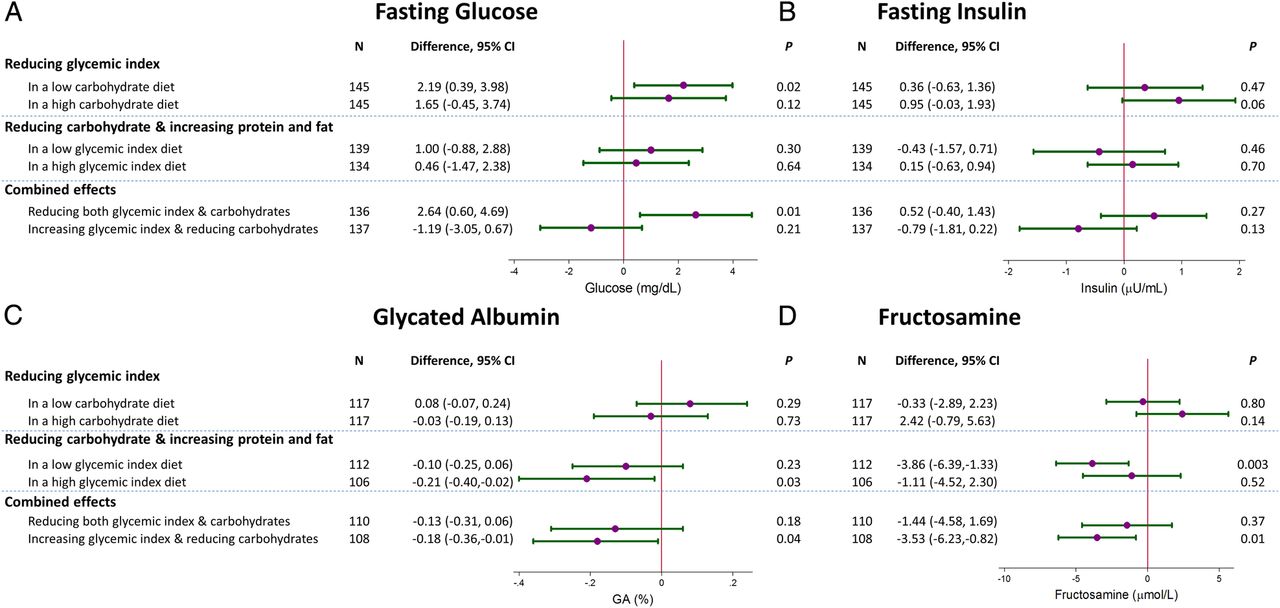
Reducing GI had no effect on glycated albumin or fructosamine in the context of either high-carbohydrate or low-carbohydrate intake (figure 1). Reducing GI increased fasting glucose in the context of a low-carbohydrate diet (low GI/low carbohydrate vs high GI/low carbohydrate: +2.2 mg/dL, 95% CI 0.4 to 4.0; p=0.02), but not significantly in the context of a high-carbohydrate diet (+1.7 mg/dL, 95% CI −0.5 to 3.7; p=0.12). Reducing GI had no effect on fasting insulin.
(A) Fasting serum glucose (mg/dL), (B) fasting serum insulin (μU/mL), (C) plasma glycated albumin (GA; %) and (D) plasma fructosamine (μmol/L) measured at the end of each feeding period: between diet comparisons, mean and 95% CIs. The feeding periods are grouped by glycemic index comparisons (low vs high glycemic index), carbohydrate proportion (low vs high proportion), and changes in glycemic index and amount of carbohydrates, that is, reductions in both or an increase in glycemic index while decreasing amount of carbohydrate. Hemolyzed samples comprising 15% of the total were removed from the GA and fructosamine comparisons.
Reducing dietary carbohydrate in the setting of a high-GI diet decreased glycated albumin (−0.2%, 95% CI −0.4% to −0.02%; p=0.03), while reducing dietary carbohydrate in the setting of a low-GI diet significantly decreased fructosamine (−3.9 µmol/L, 95% CI −6.4 to −1.3; p=0.003). Reducing amount of dietary carbohydrate while simultaneously increasing GI, decreased both glycated albumin and fructosamine (glycated albumin −0.2%, 95% CI −0.4% to −0.01%; p=0.04; fructosamine −3.5 µmol/L, 95% CI −6.2 to −0.8; p=0.01). The decreases in glycated albumin and fructosamine from reducing dietary carbohydrates were attenuated when GI was simultaneously decreased. Reducing dietary carbohydrates did not affect fasting glucose except when GI was reduced simultaneously. Reducing dietary carbohydrates had no effect on fasting insulin regardless of low GI, high GI, increase in GI, or decrease in GI.
Stratified analyses and other sensitivity analyses
The diets' effects on glycated albumin and fructosamine by strata of factors associated with diabetes are displayed in online supplementary tables S1 and S2. Ultimately, there was little if no evidence of interactions by race, hypertension status, baseline triglycerides, BMI, HOMA, baseline fasting glucose, baseline glycated albumin, or baseline fructosamine.
Supplemental material
The baseline measures of glycated albumin and fructosamine were correlated (r=0.58; see online supplementary table S2). Lower glycated albumin and fructosamine were associated with lower BMI and waist circumference.
There was no effect from change in either GI or amount of dietary carbohydrate on high sensitivity C reactive protein (see online supplementary figure S1).
Conclusions
In this trial of adults at risk for diabetes, we found that reducing GI increased fasting glucose, particularly in the setting of a low-carbohydrate diet. However, these increases in fasting glucose had little influence on markers of 2–3-week glycemia, glycated albumin and fructosamine, likely because of the opposite direction of effects conferred by reducing postprandial glycemia from the reduced GI diet. In contrast, reducing the amount of dietary carbohydrate generally reduced glycated albumin and fructosamine, suggesting that reducing dietary carbohydrate may represent a more effective strategy than reducing GI for lowering glycemia in overweight or obese adults.
In this ancillary study to the OmniCarb trial, we present the effects of type and amount of carbohydrate on glycated albumin and fructosamine. Glycated albumin and fructosamine are intermediate-term markers of glycemia that are highly associated with glycated hemoglobin (HbA1c)24 and are elevated prior to the development of diabetes.6 They are formed by a non-enzymatic glycation reaction in which glucose forms a covalent bond with intravascular proteins, primarily albumin,4 ,5 and, as observed in this study, they are correlated with each other (r=0.58). The half-life of these markers ranges between 17 and 21 days; thus, glycated albumin and fructosamine represent an average exposure to glucose concentrations in the blood in the previous 2–3 weeks.4 ,5 ,25–27 There is growing evidence that these intermediate-term markers of glycemia are more meaningful indicators of risk for diabetes, cardiovascular disease, and mortality than single glucose measurements7 ,8 ,24 ,28 by representing the aggregate effects of both fasting glucose and postprandial glucose excursions.29
GI is a measure of carbohydrate ‘quality’, based on the rate of glucose released into circulation after consumption of a fixed amount of carbohydrates. It is typically determined by comparing the area of the glucose curve following the consumption of 50 g of a carbohydrate food relative to a referent 50 g food such as white bread or glucose.18 GI has been the target of nutrition policy advocates based on numerous observational studies,30 showing that lower GI is associated with lower risk of type 2 diabetes,31 cardiovascular disease,32 ,33 and mortality.34 Mechanistic explanations for these relationships have included the hypothesis that a high-GI diet increases late postprandial hepatic glucose, reflected in higher fasting glucose measures.35 In our study, we found the contrary to be true, that is, low-GI diets increased fasting glucose. We suspect that the reduction in GI caused a compensatory increase in gluconeogenesis and a reduction in insulin sensitivity in order to stabilize fasting glucose levels, protecting against night-time and early morning hypoglycemia. This mitigated the expected increase in glycemia from high postprandial glucose excursions during the high-GI diet. As a result, there was no effect on glycated albumin or fructosamine. This is consistent with a number of trials, which found no effect from GI on fructosamine or other glycation products like HbA1c in non-diabetic populations.36
Like GI, the proportion of calories derived from carbohydrates has been associated with risk of diabetes and cardiovascular disease in observational studies31 ,37 ,38 and clinical trials.39–41 Unlike GI, we found that reducing the amount of dietary carbohydrates was associated with reductions in either glycated albumin (high-GI diets) or fructosamine (low-GI diets). Interestingly, there were significant reductions in glycated albumin and fructosamine when GI was increased while the amount of carbohydrates was decreased, but not when GI was decreased as amount of carbohydrates was decreased. This likely reflects the fact that decreasing GI increased fasting glucose, which would oppose the effect of reducing carbohydrates on glycated albumin and fructosamine. Overall, these results suggest that dietary carbohydrate is more important than GI as a dietary factor influencing aggregate glycemic exposure. Whether these differences in the effect of dietary carbohydrate on glycemia affect progression to diabetes or cardiovascular disease should be a focus of subsequent research.
Prior studies have shown that a higher GI diet is associated with higher levels of C reactive protein,13–16 a marker of inflammation associated with risk for diabetes or cardiovascular disease.11 ,12 This has led to the hypothesis that inflammation may mediate the association of GI with cardiovascular disease.9 ,10 In this ancillary study, we found no effect from either GI or amount of carbohydrates on C reactive protein levels. This suggests that carbohydrates do not act via inflammation with regards to the pathogenesis of diabetes or cardiovascular disease.
This study has several limitations. The feeding periods were too brief for the observation of clinical events, making it necessary to examine surrogate markers as outcomes; however, we consider the feeding periods sufficient to determine effects on the surrogate outcomes. Based on our experience with prior feeding studies,1 ,2 ,42 effects of diet are observed soon after the initiation of feeding with the majority of effects taking place within the first 2 weeks.43 Thus, we are confident that even those with a short feeding period would still manifest an effect from GI if one existed. We reviewed the literature on duration for effects of GI, and if anything find a diminution of effects on risk factors with duration, especially beyond 6 months.44 In a systematic review and meta-analysis that included 421 participants in four trials with at least 6 months duration, reducing GI had no effect on HbA1C (mean difference −0.1%, p=0.7).45 Finally, 15% of the plasma specimens were hemolyzed and subsequently excluded from our analyses of glycated albumin and fructosamine, which reduced statistical power.
With regards to strengths, our study was a randomized, controlled feeding study that employed a cross-over design to assess dietary effects on glucose homeostasis. Diets were highly regulated and isocaloric with virtually no weight change over the course of the trial, reducing the impact of weight on our outcomes. Furthermore, we used non-traditional markers of glucose homeostasis that reflect intermediate-term glycemic exposure, permitting more accurate assessments of diet-induced changes in 2–3-week glucose homeostasis. Finally, our study population was quite diverse with 50% of participants being black, a population at risk for prediabetes and diabetes.
In conclusion, we found that a lower GI diet increases fasting glucose, while diets with a lower amount of dietary carbohydrates reduce glycated albumin and fructosamine, markers of 2–3-week glycemia. Together these findings suggest that a low-carbohydrate diet most effectively lowers glycemia in adults at risk for diabetes. Additional research is needed to determine the long-term effects of these physiological changes in glucose homeostasis on clinical outcomes.
References
Footnotes
Contributors SPJ, ERM and FMS wrote manuscript, researched data. ES and RHC reviewed/edited manuscript. VJC and LJA reviewed/edited manuscript and participated in the primary trial design. SPJ and FMS are guarantors of this work and take full responsibility for the work as a whole, including the study design, access to data, and the decision to submit and publish the manuscript.
Competing interests None declared.
Patient consent Obtained.
Provenance and peer review Not commissioned; externally peer reviewed.
Data sharing statement The statistical code for this analysis is available from the corresponding author, SPJ. The data set is available from FMS on request.