Article Text

Abstract
Objective We aimed to describe patterns of weight change in insulin-naive patients with type 2 diabetes mellitus (T2DM) starting basal insulin (BI) treatment.
Research design and methods Diabetes Versorgungs-Evaluation (DIVE) is an observational, multicenter, prospective registry in patients with T2DM. Patients were divided into those initiating BI therapy for the first time (with optional oral antidiabetic drugs (OADs)) and those initiating OADs only (OADo).
Results 521 patients were included in the analysis, 113 in the BI arm and 408 in the OADo arm. Relative to baseline, the BI group gained an average of 0.98±7.1 kg at 1 year, compared with a loss of 1.52±11.8 kg in the OADo group (p<0.001). This difference remained statistically significant when expressed as a proportional change from baseline (+0.014±0.08 vs −0.015±0.12, respectively (p<0.001)). Baseline weight (regression coefficient (RC) 0.89; 95% CI 0.81 to 0.97; p<0.001) and diabetes duration (RC 2.52; 95% CI 0.53 to 4.52; p=0.01) were the only factors identified as significant predictors of weight gain between baseline and 1 year follow-up in BI patients.
Conclusions Though BI therapy leads to modest weight gain over the subsequent year, this may be limited by BI initiation at an early stage of the disease. As such, delaying the start of insulin therapy based on fears of weight gain appears counter-productive, and should be reconsidered.
- Body Weight
- Oral Antidiabetics
- Insulin
- Adult Diabetes
This is an Open Access article distributed in accordance with the Creative Commons Attribution Non Commercial (CC BY-NC 4.0) license, which permits others to distribute, remix, adapt, build upon this work non-commercially, and license their derivative works on different terms, provided the original work is properly cited and the use is non-commercial. See: http://creativecommons.org/licenses/by-nc/4.0/
Statistics from Altmetric.com
Significance of this study
What is already known about this subject?
Early initiation of insulin therapy has been recommended based on superior glycemic control, which may be associated with a reduced cardiovascular risk. However, a common reason for practitioners and patients to delay insulin therapy is a fear of subsequent weight gain.
We aimed to describe patterns of weight change over 1 year in insulin-naive patients with type 2 diabetes mellitus (T2DM) beginning basal insulin (BI) treatment for the first time.
What are the new findings?
BI therapy led to modest weight gain over 1 year, which appeared to be limited by BI initiation at an early stage of the disease.
How might these results change the focus of research or clinical practice?
Thus, delaying the start of insulin therapy based on fears of weight gain may be counter-productive, and should be reconsidered.
Introduction
In patients with type 2 diabetes mellitus (T2DM), early initiation of insulin therapy has recently been recommended based on evidence that it provides superior glycemic control.1–3 Lower glucose levels have, in turn, been associated with a reduction in cardiovascular risk.4 However, a common reason for practitioners and patients to delay insulin therapy is fear of subsequent weight gain.5 This is a warranted concern, with the greatest weight increase reportedly occurring in the first year.6 In a meta-analysis of 46 studies, the average annual increase in body weight following insulin initiation was quantified as 4.3±2.74 kg (95% CI 4.32 to 4.38), which was found to positively correlate with insulin dosage.7 However, a second meta-analysis of 16 trials comparing the effects of basal, biphasic, prandial and basal–bolus insulin strategies on body weight suggested that the lowest weight gain was seen on basal insulin (BI) regimens.8 A BI approach may therefore offer the greatest potential for limiting weight gain on insulin therapy, making acceptance of early initiation and subsequent adherence more likely.
Insulin glargine (IGlarg), insulin detemir (IDet), and neutral protamine Hagedorn (NPH) fall within the BI category. Modest variation has been noted in the degree of weight gain associated with these different agents. While some studies have shown that patients treated with IGlarg gained less weight than those treated with NPH9 no significant difference was noted in a large meta-analysis of 46 randomized studies.7 The same meta-analysis identified a moderately lower weight gain in patients taking IDet compared with NPH. However, overall, a similar, low level of weight gain has generally been reported. While comparisons between different BIs are relatively common in the literature, very little information is available regarding risk factors for weight gain on BI regimes as a whole. Identification of such factors would facilitate the tailoring of insulin therapy to individual patient needs and increase the potential for limiting further weight gain. In turn, this would encourage both patients and physicians to consider using insulin earlier in T2DM.
The aim of the present prospective, observational registry analysis was first to describe patterns of weight change over 1 year in insulin-naive patients with T2DM beginning BI treatment and second to identify factors associated with increased weight gain in this population.
Research design and methods
Study design
The data source used was the Diabetes Versorgungs-Evaluation (DIVE) registry, which is a prospective, observational, German, multicenter registry involving approximately 200 physician offices specializing in the care of patients with T2DM. Patients diagnosed with T2DM on or after January 1, 2011 were enrolled in the present prospective study. Those diagnosed prior to this date were eliminated due to a lack of readily available data on previous BI/oral antidiabetic drug (OAD) medication, which could have resulted in incorrect dates of treatment initiation. ‘DPV2 Diamax’, the professional documentation software of Axaris Software and Systems GmbH, Germany, was used to prepare the database. The study protocol received ethical approval from the responsible local Ethics Committee, and all patients enrolled for the registry provided written informed consent.
On October 31, 2014, data were extracted and two study groups were established based on the treatment strategies to be compared in the current analysis. Group 1 included all patients receiving BI for the first time (ie, without a documented history of insulin administration). Use of concomitant OAD therapies was permitted. Group 2 (OAD only (OADo)) included all patients not eligible for group 1 who were receiving their first OAD treatment without simultaneous BI and/or short-acting insulin. Final inclusion into either one of these groups was dependent on the continuous maintenance of the respective treatment strategies for at least 1 year following initiation. Baseline study entry for each individual patient was defined as the initiation point of the treatment strategy (as documented by the clinician), with corresponding follow-up 1 year later.
Definitions of medications used in the present study
Classification of all drugs involved in the study was performed using the WHO Collaborating Centre for Drug Statistics and Statistics Methodology anatomical therapeutic chemical (ATC) index 2014. Drugs with an ATC index of A10B were classed as OAD medication, with the exception of injectables such as human insulin and licensed glucagon-like peptide-1 agonists (A10BX04, A10BX07, and A10BX10). Long-acting insulins (A10AE) and intermediate-acting NPH insulins (A10AC01) were classed as BIs, while short-acting insulins (A10AB) were not included in this category. Concomitant medications, for example, β-blockers, were identified by any ATC indices other than A10. Where identical medication usage was documented at an interval of <6 months, records were merged into one episode. Missing records at the end of treatment were artificially imputed using the mean time periods observed (BI 0.546 years; OADo 0.467 years) for all recorded patients diagnosed with T2DM.
Documentation
For data protection reasons, precise dates of birth and diabetes diagnosis were not documented. Therefore, to calculate age and diabetes duration, each patient was assigned a surrogate date of either the 15th day of the corresponding month (where month data were available) or June 30 of the corresponding year (where only year data were available). Patient-level data provided information about gender and diabetes type. Information for other parameters including height, weight, comorbidities, and laboratory values for fasting plasma glucose (FPG), postprandial glucose (PPG), and glycated hemoglobin (HbA1c) were derived from the data recorded at routine medical visits. Patient baseline characteristics were determined at the visit closest to study entry that (1) provided complete (non-missing) weight information and (2) fell within 2 months before (preferential) or 1 month after study entry. Similarly, 1-year follow-up covariate information was determined at a visit which fell within month prior to, and 2 months following the predetermined individual final follow-up point for each patient. Patients with either no qualifying baseline and/or follow-up data were excluded from the study population (n=518, figure 1).
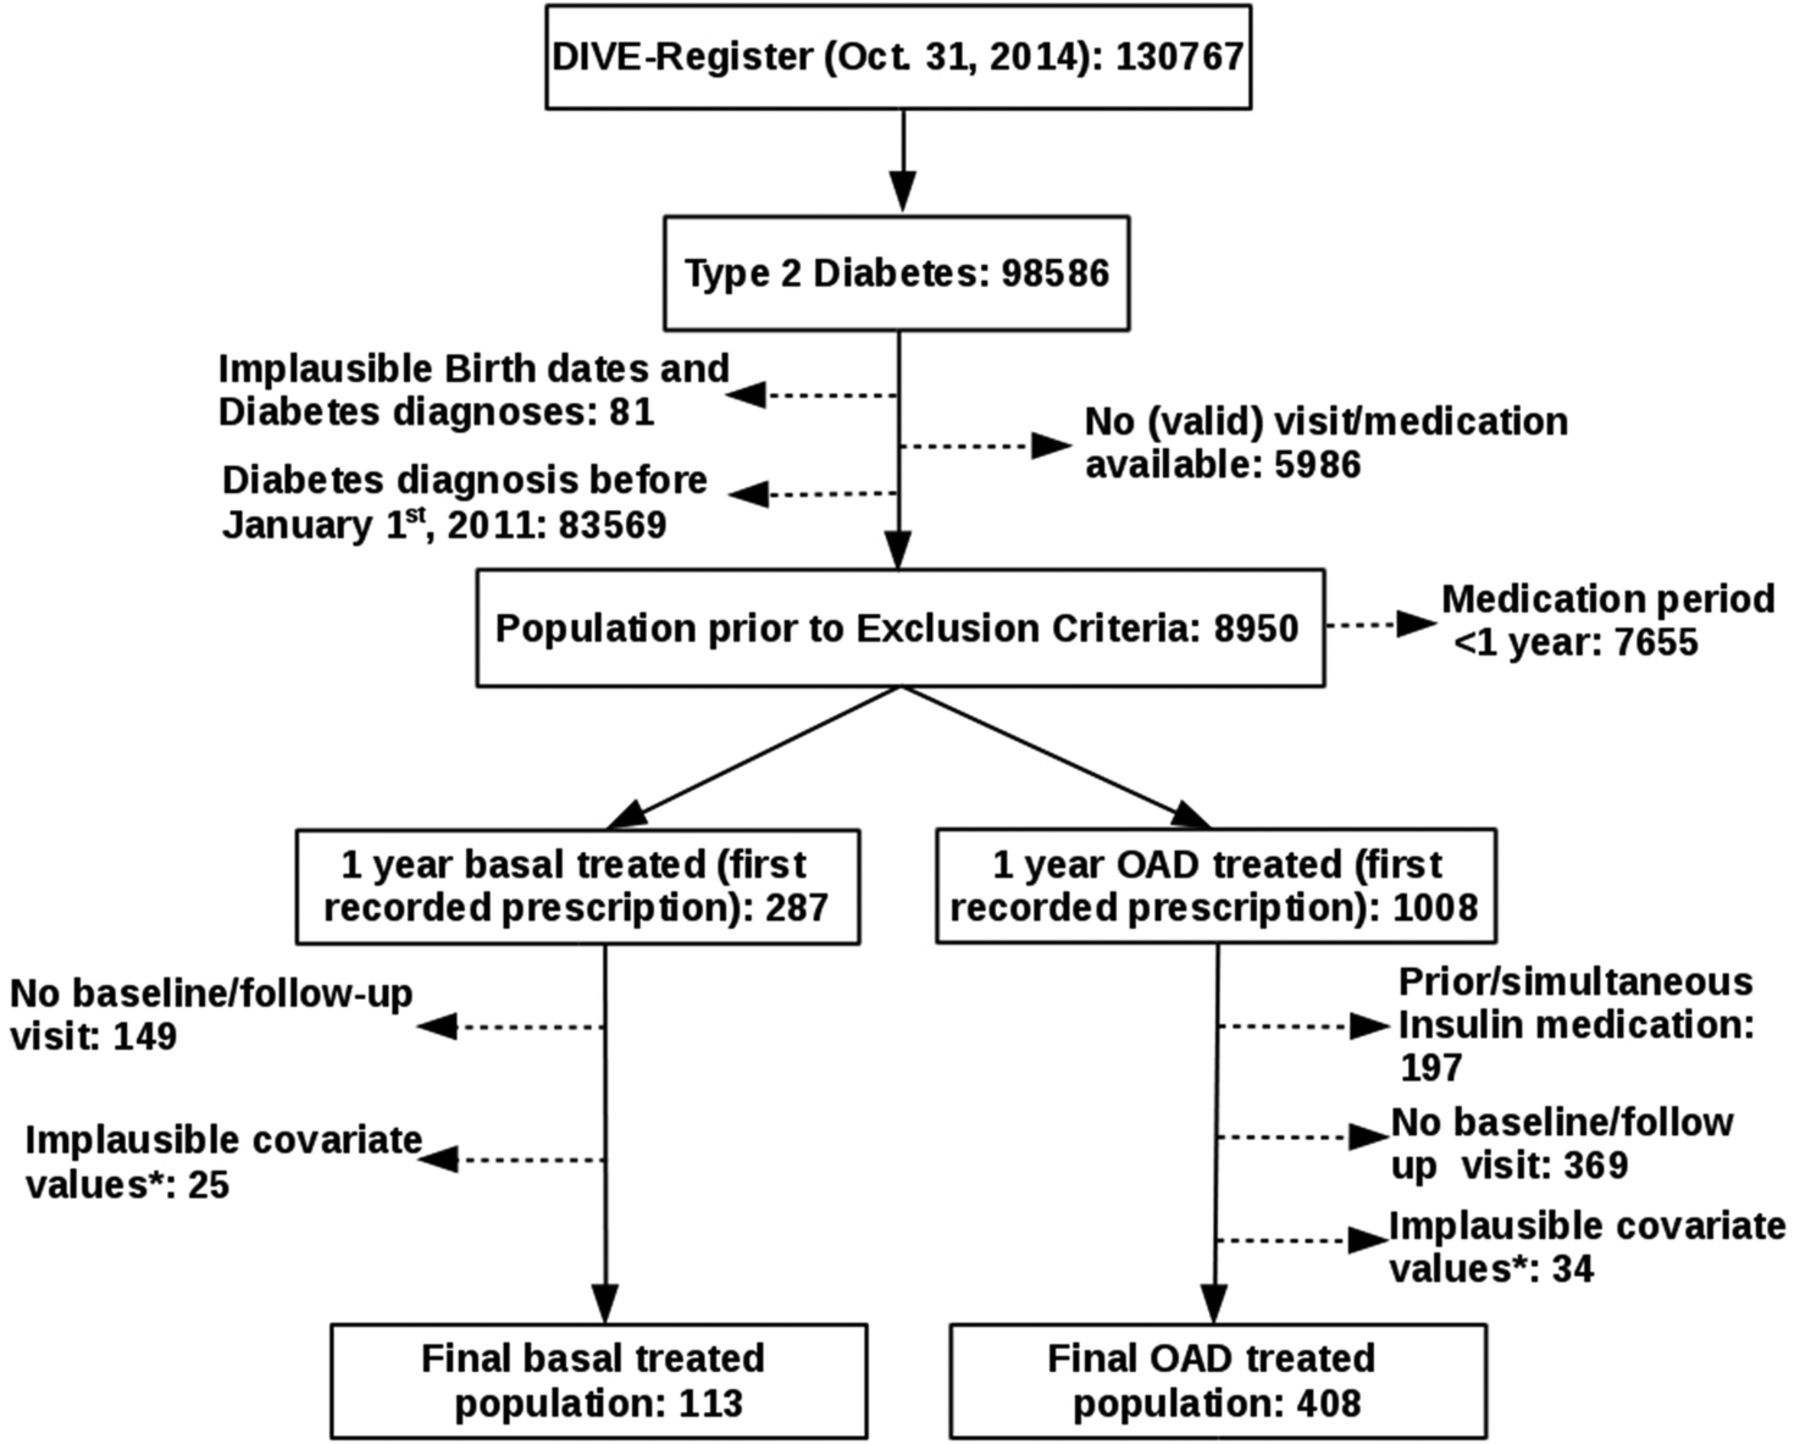
Patient flow chart: the final prospective study population consisted of 521 individuals, 113 on basal insulin and 408 on OADs. *Plausibility: height (130–230 cm), weight (40–200 kg), HbA1c (4–15%), FPG (2.8–13.9 mmol/L), PPG (≥3 mmol/L). DIVE, Diabetes Versorgungs-Evaluation; FPG, fasting plasma glucose; HbA1c, glycated hemoglobin; OAD, oral antidiabetic drug; PPG, postprandial glucose.
All data on comorbid disease conditions prior to, and following study entry were obtained from patient history consisting of yes/no questions. Assessments were carried out and recorded by the treating physician, though they were not objectively verified. Criteria used to define comorbidity were as follows: (1) prior macrovascular disease (MAC): non-lethal myocardial infarction (MI), stroke, transient ischemic attack/prolonged reversible ischemic neurological deficit, coronary heart disease or peripheral arterial disease; (2) newly occurring MAC: as described for prior MAC, plus death; (3) microvascular disease (MIC): any record of retinopathy, nephropathy, neuropathy, major/minor amputations, blindness, renal failure, or dialysis; (4) hypoglycemia: determined based on information about any severe hypoglycemic event; and (5) diabetes duration: time difference between diabetes diagnosis and study entry. Newly occurring MAC and MIC were only determined in patients without previously known MAC and MIC events, whereas new hypoglycemic events were also determined in patients with a prior history of hypoglycemia. Smoking status at baseline was defined as a dichotomous variable (no: never smoked, yes: former, ordinary, or heavy smoker). All variables were tested for plausibility.
Statistics
Missing data for the baseline and follow-up covariates of height, HbA1c, FPG, PPG, and smoking (see online supplementary table S1) were calculated via a semiparametric multiple imputation approach using chained equations, designed by van Buuren10 and provided by the R-package mice.11 Following the ‘missing at random’ assumption, 10 imputed data sets were built on conditional regression models, accounting for all relevant baseline and follow-up variables. Continuous covariates were imputed by predictive mean matching, and smoking by a logistic regression model using 1000 iteration steps. Healthy convergence of the mice algorithm and imputation distribution and plausibility were verified (results not shown). Pooled estimates were derived following Rubin’s Rule.12
supplementary table
Absolute Number of Missing Values and Relative Proportion in each treatment arm
Continuous baseline covariates were reported as mean±SD and categorical variables were presented as proportions. The treatment-specific values were compared by univariate linear regression models for continuous variables, a univariate logistic regression model for smoking and co-medication, and a Fisher’s exact test for categorical data which were non-missing at baseline. Results of the univariate analysis were reported as regression coefficient (RC), 95% CI, and p value.
Multivariate linear models accounting for all continuous baseline covariates were used to determine differences between treatment groups for relative changes in the efficacy variables HbA1c, FPG, PPG, and weight during the 1-year observation period. Analysis of covariance models with follow-up weight as the dependent variable and baseline weight as an additional covariate were used to determine the predictive properties of all baseline covariates for mean weight change from baseline in BI-treated patients.13 A multiple regression analysis was carried out, which included all predictors with univariate p values ≤0.157.14 Results of the multivariate analysis are reported as RC, 95% CI, and p value.
The nominal level of significance was set at 0.05. All analyses were performed with R V.3.2.1 (R Core Team, Vienna, Austria, 2015).
Results
Population selection
Of the 130 767 patients documented in the DIVE registry up until October 31, 2014, 98 586 were identified as having T2DM (figure 1). Of these, 89 636 were excluded due to the following reasons: implausible dates of birth and diabetes diagnosis (81 patients), absence of valid doctoral visit or medication data (5986 patients), and diabetes diagnosis prior to January 1, 2011 (83 569 patients). An additional 7655 patients did not meet the main inclusion criteria regarding medication period and were consequently excluded. The remaining 1295 patients were grouped into those beginning BI therapy for the first time with optional concomitant OADs (BI group, n=287), and those beginning OAD therapy for the first time without concomitant or prior history of insulin (OADo group, n=1008), with treatment lasting for at least 1 year in both cases. Over the period of the study, 174 patients were excluded from the BI group and 403 from the OADo group due to implausible covariate values or a lack of baseline/follow-up visit. An additional 197 patients were excluded from the OADo group due to prior or simultaneous insulin therapy. This resulted in patient populations of 113 in the BI group and 408 in the OADo group.
Baseline patient characteristics
As shown in table 1, baseline patient characteristics for continuous variables were comparable between study groups in terms of mean age, height, weight, and PPG. Differences were present for diabetes duration, baseline HbA1c and FPG values, which were greater in the BI group compared with the OADo group (0.6±0.7 vs 0.5±0.6 years (p=0.03), 8.6±2.3% vs 7.6±2.1% (p<0.001), and 8.6±3.1 vs 7.7±3.2 mmol/L (p=0.01), respectively).
Baseline characteristics of those receiving BI compared with those on OAD medication
Baseline categorical variables were similar for both treatment groups in terms of gender, smokers, and history of MIC or hypoglycemic events. The only notable difference was the prevalence of prior MAC, with a higher proportion seen in the BI group (15.0% vs 7.4% for the OADo group, p=0.02).
Antidiabetic medication at baseline
As per the eligibility criteria, all patients in the OADo study arm were started on ≥1 OAD at baseline as part of their antidiabetic medication (table 2). Of these patients, 11.3% were on ≥2 OADs, with metformin+dipeptidyl peptidase-4 inhibitor (37.0%) or metformin+sulfonylurea (30.4%) the most commonly prescribed concomitant agents. Conversely, in the BI group, only 45.1% of patients were prescribed an OAD as part of their antidiabetic treatment at baseline, with only 8.0% on ≥2 OADs.
Antidiabetic medication at baseline
Prescription behavior also differed in terms of the type of OAD prescribed, with a significantly larger proportion of OADo patients on metformin (82.1%) compared with OAD-treated BI patients (29.2%, p<0.001). No significant differences were observed regarding other OAD types or β-blockers. A summary of OAD treatment at baseline can be found in table 2.
In terms of insulin treatment, the majority of BI patients were started on NPH at baseline (45.2%), with the remainder divided evenly between IGlarg (28.3%) and IDet (26.5%). The mean baseline dosage was similar between the BI types (0.17, 0.18, and 0.19 units/kg/day for patients on NPH, IGlarg, and IDet, respectively).
Changes in glycemic control at follow-up
In terms of glycemic control, a greater absolute reduction from baseline was seen in the BI group compared with the OADo group for HbA1c (−1.8±2.4% vs −1.2±2.0% (p=0.17)), FPG (−1.2±4.2 vs −0.7±45.2 mmol/L (p=0.97)), and PPG (−2.8±6.4 vs −2.2±13.6 mmol/L (p=0.81)). However, no statistical significance was observed, even when these values were calculated as a proportional change relative to baseline (table 3).
Changes in key variables between baseline and end of follow-up
A greater proportion of new hypoglycemic events was observed in the BI group compared with the OADo group (2.7% vs 0.0%, respectively; p=0.01).
Weight changes at follow-up
Relative to baseline values, the BI group experienced a mean absolute weight gain of 0.98±7.1 kg at 1 year, compared with a loss of 1.52±11.8 kg in the OADo group (p<0.001, see table 3). This difference remained statistically significant when expressed as a proportional change relative to baseline (+0.014±0.08 vs −0.015±0.12, respectively (p<0.001)).
A scatterplot showing the relationship between baseline weight and weight change at 1 year (absolute change from baseline vs baseline) for each treatment group can be seen in figure 2. Patients in the OADo group had generally lost weight by 1-year follow-up (regardless of baseline weight), while in the BI group, patients generally gained weight, with weight loss seen only in those patients with extremely high or particularly low baseline weight.

Scatterplot showing the association between baseline weight and weight change at 1 year, relative to baseline for each treatment group. Solid lines are LOESS curves. Observations above the dashed line are patients who gained weight; observations below were patients who lost weight. OAD, oral antidiabetic drug.
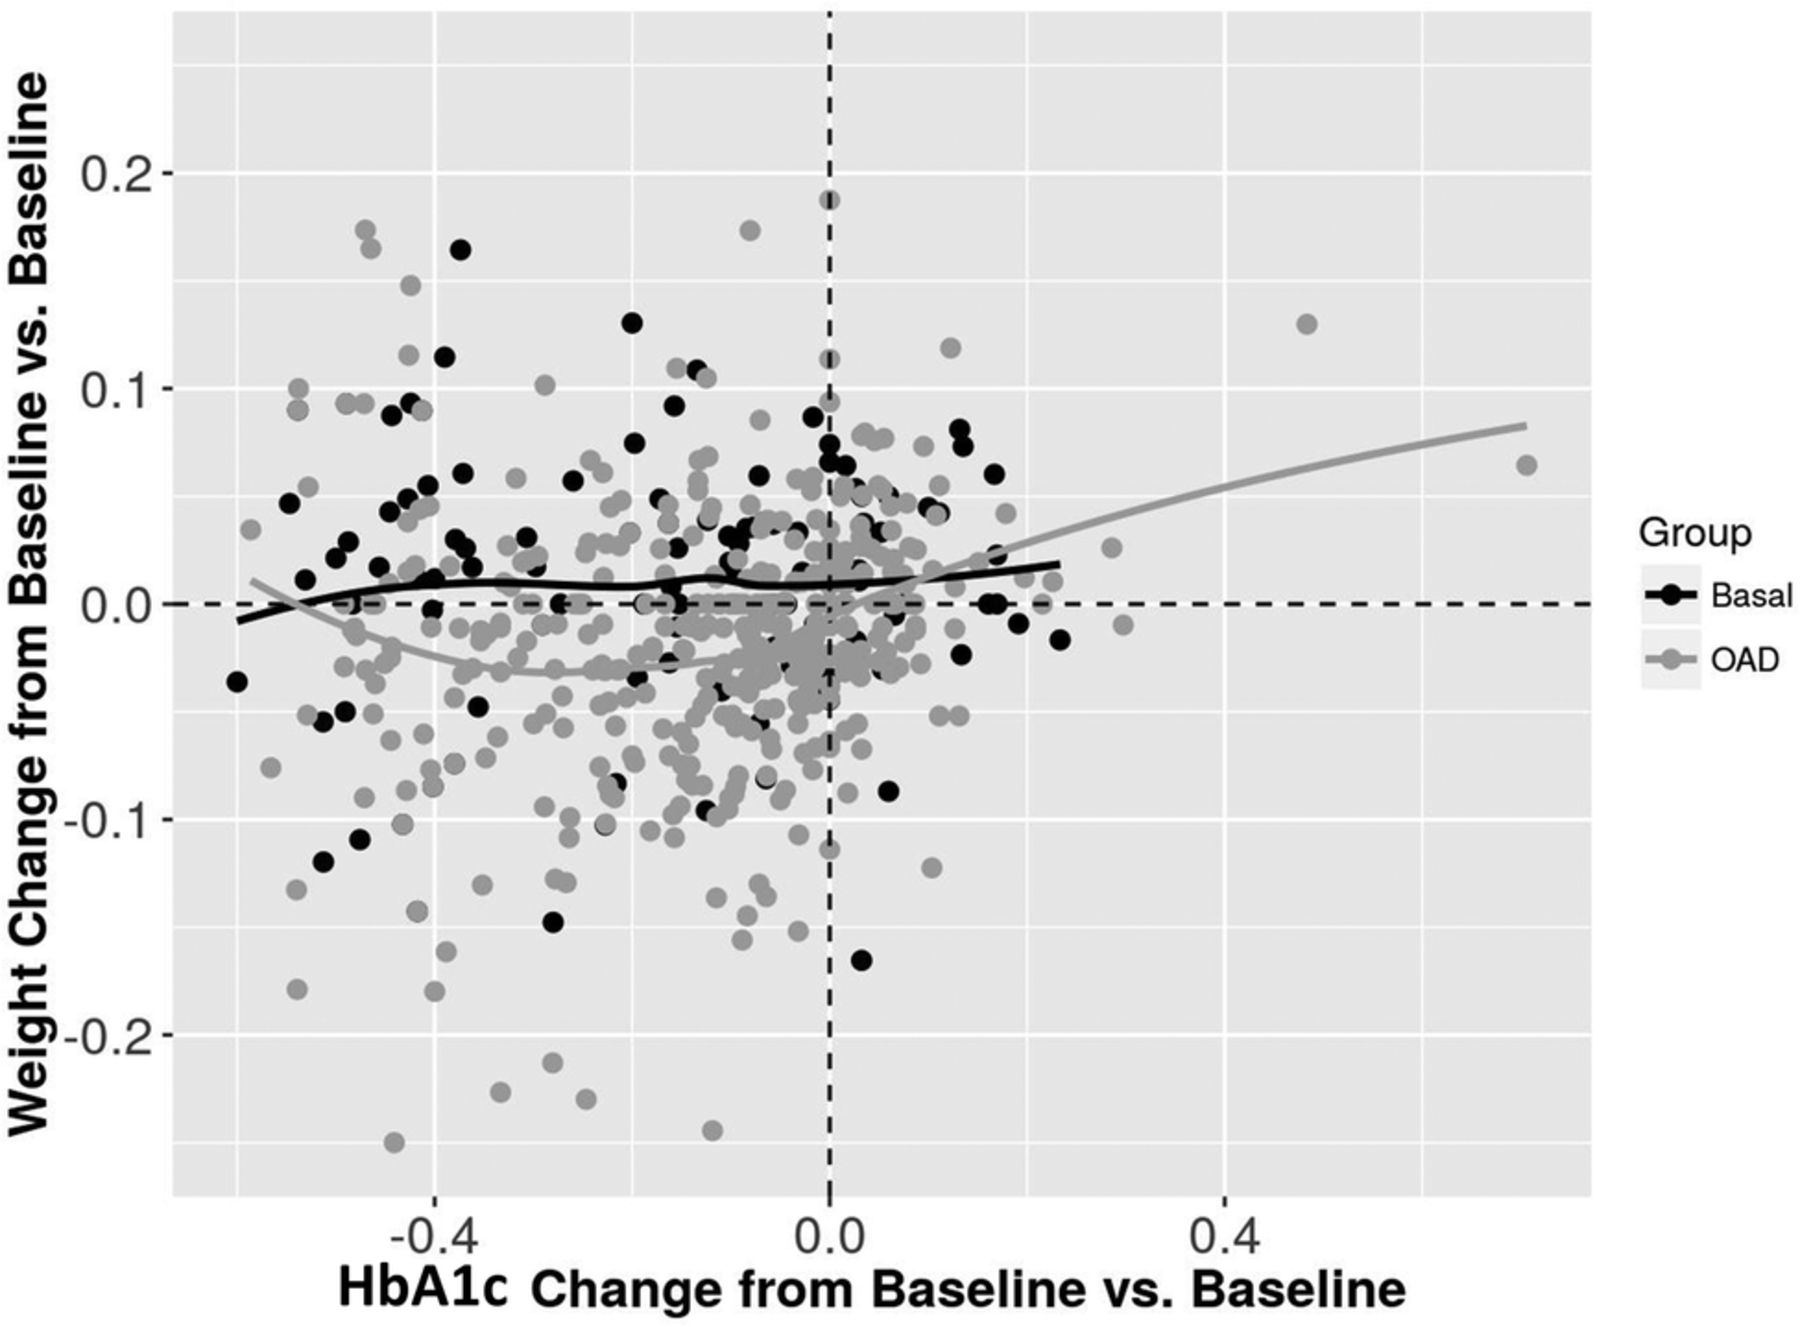
A scatterplot showing the association between change in HbA1c and weight change at 1 year (both absolute change from baseline vs baseline) for each treatment group can be seen in figure 3. In general, patients in the OADo group who had experienced a decrease in HbA1c by 1 year also appeared to have lost weight, while weight gain remained stable regardless of change in HbA1c in BI patients.
Scatterplot showing the association between change in HbA1c at 1 year and weight change at 1 year, relative to baseline for each treatment group. Solid lines are LOESS curves. Observations above the dashed line are patients who gained weight; observations below were patients who lost weight. Graph obtained from one imputed data set only, though other data sets were extremely similar. HbA1c, glycated hemoglobin; OAD, oral antidiabetic drug.
Predictors of weight change in patients on BI
At univariate analysis of BI group data, baseline weight (RC 0.93; 95% CI 0.87 to 0.99; p<0.001), female gender (RC −2.03; 95% CI −4.8 to 0.08; p=0.156), height (RC 0.18; 95% CI 0.01 to 0.35; p=0.04), diabetes duration (RC 2.28; 95% CI −0.35 to 4.21; p=0.02), and metformin treatment (RC −2.18; 95% CI −5.08 to 0.71; p=0.14) were identified as having p values of <0.157 and therefore included in the subsequent multivariate analysis as potential predictor variables of weight change at 1 year.
Multivariate analysis showed that only baseline weight (RC 0.89; 95% CI 0.81 to 0.97; p<0.001) and diabetes duration (RC 2.52; 95% CI 0.53 to 4.52; p=0.01) were significant predictors of weight gain between baseline and 1-year follow-up in BI patients. No other covariates were identified as significant predictors of weight change during the multivariate analysis. Regression data are presented in table 4.
Baseline variables associated with weight change from baseline in patients started on basal insulin
Discussion
There were two main aims of the present prospective, multicenter analysis: (1) to assess the weight change of patients with T2DM 1 year after initiating BI therapy (with optional concomitant OADs) in comparison with that of patients initiating OAD treatment only, and (2) to determine factors associated with weight change following initiation of BI therapy.
Patient characteristics and antidiabetic medication at baseline
Study group baseline characteristics were similar except a higher prevalence of prior MAC (unlikely to have affected study outcomes), slightly longer diabetes duration, and elevated HbA1c and FPG values in patients about to begin insulin therapy. These differences are to be expected, given the observational nature of the study and current clinical practice of initiating insulin only when HbA1c is not sufficiently controlled by OADs. Thus, imbalances relating to disease progression/severity are unavoidable and representative of the real world.
The proportion of patients taking metformin in the OADo group was almost three times that of the BI group. Although currently under review, the European Medicines Agency (EMA) has advised against the use of metformin-containing medication in patients with low glomerular filtration rates (GFR) due to an increased risk of lactic acidosis.15 It is therefore possible that fewer BI patients were prescribed metformin due to a higher prevalence of diabetic nephropathy, indicating a further difference in study populations. Unfortunately, this cannot be verified, given the considerable number of missing/unreliable GFR and creatinine values in the database.
Interestingly, a small proportion of OADo patients were started on two OADs simultaneously (most commonly a combination of metformin and a sulfonylurea/glinide). This is unusual, given that 2012 International Diabetes Federation guidelines advocate first-line use of one of these three agents as a monotherapy, followed by the addition of a further OAD once patients fail to meet their glucose targets.16 Taking into account the general resistance to the use of insulin as a first-line therapy, we may speculate that physicians prescribed two OADs to patients with particularly high HbA1c deemed unlikely to be satisfactorily controlled using monotherapy.
BI and weight change
Data analysis revealed a mean weight gain of 0.98 kg in patients with T2DM 1 year after beginning BI therapy. Though a finding of weight gain is in agreement with existing studies, previously reported values have typically been higher; with gains of between 1.8 and 2.5 kg reported by a number of randomized control trials (RCTs) and meta-analyses.17–19 This is despite patients in these studies starting on IGlarg or IDet, which have both been associated with less weight gain than NPH20 ,21 (the most prevalent BI type in the present study). Such variation may be partly due to the majority of patients in the present study being German: a population shown to exhibit significantly lower weight gain on insulin compared with other nationalities.22 Additionally, comparison of our real-world data with RCT data is limited by both the highly selective patient populations in the latter design and the common use of specific HbA1c targets as outcome measures. This generally results in a greater, more aggressive up-titration of insulin dose to reach the goal, which is clinically relevant as increasing insulin levels have been positively associated with weight gain.7 ,19 ,22 However, a real-world UK database analysis by Gordon et al20 found average annual weight gains of 2.3, 1.7, and 1.9 kg for patients on NPH, IDet, and IGlarg, respectively, echoing the aforementioned RCT findings. An explanation for this may be the longer diabetes duration (∼6.2 years) and more advanced disease (HbA1c 9.5%) prior to BI initiation in the UK patients, suggesting a requirement for more aggressive insulin therapy and an associated increase in weight gain.
BI patients with particularly high (>120 kg) baseline bodyweight appeared to lose weight. Concurrently, a study of overweight/obese patients starting IDet also reported an extreme body mass index (BMI) to be associated with weight loss.23 This may be due to more severely overweight patients making more drastic lifestyle changes, receiving additional help with weight management, or being prescribed metformin more frequently (given its known weight loss advantages).24–27
At 12 months, almost all BI patients had reduced HbA1c values compared with baseline, though the degree of relative reduction did not seem to be associated with weight change. Conversely, Pontiroli et al7 found a decrease in HbA1c on insulin therapy to be associated with an increase in bodyweight and Jansen et al28 reported that 12% of early weight gain may be attributed to an improvement in glycemic control. However, the preinsulin HbA1c values of patients in these studies were generally much higher than in the present analysis, suggesting that weight gain may only be related to regaining glycemic control where HbA1c has already risen to an extreme level.
OADs and weight change
There was a low frequency of OADo patients taking medications with weight gain effects (ie, sulfonylureas, repaglinide, pioglitazone, and bromocriptine),29 and a high proportion (82.1%) taking metformin. The association between metformin and weight loss is well documented, with a recent movement for its approval as a treatment for obesity.25 It is therefore unsurprising that a mean weight loss of 1.52 kg was documented in the OADo group. Concurrently, a recent German trial reported similar magnitudes of weight loss over an average of 9.6 months in male (1.2 kg) and female (1.8 kg) patients with T2DM on metformin.27 Similarly, the presently observed association between weight loss and a reduction in HbA1c at 12 months in OADo patients is likely to be attributable to the effects of metformin.
Metformin was a co-medication in only 29.2% of BI patients, and was not identified as a significant predictor for weight change in the multivariate analysis. This is in contrast to a recent report from the Copenhagen Insulin and Metformin Therapy (CIMT) trial, which found concomitant BI and metformin to result in significantly reduced weight gain compared with BI alone (−2.6 kg difference between groups), reiterating findings by Douek et al26 in 2005 (−1.5 kg between groups). However, both trials included a much larger group of patients on metformin, suggesting that the lack of effect in the present study may be due to insufficient statistical power. The benefit of combining BI and metformin for weight management in T2DM merits further investigation.
Variables associated with weight change
In the present analysis, increased baseline weight was identified as an independent predictor of weight gain following BI initiation, with patients expected to gain an additional 0.89 kg at 1 year for every 1 kg increase in baseline weight. This is in line with current clinical opinion that heavier patients are more likely to experience runaway weight gain on insulin therapy. Conversely, several studies have associated low baseline BMI with increased weight gain following insulin initiation in patients with T2DM,22 ,30–33 the largest of which (CREDIT) reported that a 4 kg/m2 lower baseline BMI was predictive for a 0.5 kg higher weight gain at 1 year.22 One potential explanation for this disparity centers around disease severity. Weight loss is known to accompany escalating HbA1c, with the difference between a patient's natural prediabetes BMI and their BMI following disease progression describable as their ‘BMI deficit’. A physiologically regulated return to prediabetes BMI is thought to occur on restoration of glycemic control.22 ,33–35 Thus, weight gain after insulin initiation can be described as a sum of ‘BMI deficit reversal+insulin-dependent weight gain’. Considering that patients in the CREDIT and other aforementioned studies had higher HbA1c levels (9–10%) than those in the present study (8.6%),22 ,30 ,32 ,33 their BMI deficits were likely to have been more pronounced prior to baseline, and the BMI deficit reversal effect greater. This may explain the inverse association between baseline BMI and weight gain. Given the relatively lower baseline HbA1c, the present findings may better represent trends in insulin-dependent weight gain alone. This idea is supported by the finding that baseline HbA1c was positively associated with greater weight gain in most of the aforementioned studies,22 ,30 ,33 but not in the present study. However, weight change prior to insulin initiation was not systematically recorded, and further studies are merited.
A second predictive factor for weight gain was duration of diabetes prior to BI therapy initiation. This is logical, as early initiation would minimize HbA1c escalation and avoid creation of a significant BMI deficit. This idea is supported by Bhattacharya et al,1 who found that early BI initiation resulted in maintenance of effective glycemic control and only modest weight gain. Another study, EARLY, also found that shorter diabetes durations before BI initiation led to more efficient glycemic control at a lower insulin dose.36 ,37 This is important, given the association between higher insulin doses and weight gain.7 The latter study also reported weight benefits in patients with diabetes durations <5 years prior to basal IGlarg initiation compared with those with durations >5 years, though this was expressed as a greater weight loss.36 This was likely due to concomitant metformin being an entry requirement for the study. Despite disagreement over the direction of weight change, findings from prior and present studies suggest that shorter diabetes duration is associated with more favorable weight outcomes, and early initiation of BI therapy may be advantageous.
In the present study, BI administration was efficient at re-establishing glycemic control, which has been shown to reduce the risk of cardiovascular complications (particularly MI).4 However, insulin is associated with the additional risk of hypoglycemia. In our BI group, hypoglycemia occurred in 2.7% of patients: a low prevalence typical of BI regimens.18 As the correction of hypoglycemia involves an additional caloric intake,38 this may explain a small proportion of the weight gain seen in the BI group. In addition to weight-related concerns, the risk of hypoglycemia is an additional cause of physician and patient resistance to early initiation of BI treatment, and cost:benefit analysis is further needed.
Methodological limitations
Unfortunately, more than 80 000 patients were not eligible for inclusion due to T2DM diagnosis before study initiation, drastically reducing the sample size. This was especially true for the BI-treated population; as a result of which, meaningful subgroup analyses of patients on IGlarg, IDet, and NPH insulin were not possible. Given the differing pharmacokinetics and clinical profiles of these BIs, such analysis would otherwise have been merited. However, exclusion was necessary to avoid bias arising from the unreliable or limited information on medication periods before January 1, 2011, while the data set provided a reasonable number of eligible individuals to analyze the overall medical problem.
To generate more data, multiple imputations based on semiparametric predictive mean matching for continuous covariates were performed. However, the generated values were limited by the observed ones. Nonetheless, the prevalence of missing values for the most important factors (baseline and follow-up weight and HbA1c) was <11% (see online supplementary table S1), justifying the imputation choice and indicating the validity of our findings. However, missing values for smoking were prevalent (43.4% and 44.6% for BI and OADo groups, respectively) and further studies examining its relationship to weight change are merited, especially given reports of an existing association.39
GFR and creatinine data were unavailable or unreliable in the majority of cases, meaning that differences in renal function between OADo and BI populations were undeterminable. However, the impact of this on the main aim of the study is likely to have been minimal. The absence of sufficient data describing insulin dosage at 1 year was a notable limitation considering that insulin dosage has been consistently associated with weight gain. Further real-world studies will help to elucidate the impact of early insulin initiation on required dose 1 year later, and assess its contribution to degree of weight gain.
Medication periods were determined based on preliminary assumptions and where identical medication periods were <6 months apart, were merged into one episode. The overall mean imputation (BI 0.546 years, OADo 0.467 years) was also performed to provide missing end-of-treatment records. This method is commonly used for handling missing data of this nature; thus clinically defensible.
Information on microvascular/macrovascular comorbidities and hypoglycemic events was provided by patients on an anamnestic basis. Thus, there is the potential for some inaccuracy, with reported events commonly of a severe nature. However, the available information was assumed to be sufficiently reliable.
An inherent limitation of observational studies is the inability to control for certain factors. In this case, potential confounding variables such as lifestyle modifications and changes in personal circumstances leading to different exercise/eating behaviors were not controlled for. These may have contributed to a proportion of BI patients losing (rather than gaining) weight, and the sizeable SDs.
Finally, the German-centric aspect of this study indicates probable health service, genetic, and lifestyle bias, meaning findings may not be generalizable to a worldwide population. Repetition on a multinational basis in larger cohorts would be informative.
Conclusion
BI is already known to induce lower levels of weight gain compared with other insulin regimes. Here, we present data which suggest initiation of BI therapy earlier on in disease duration may be beneficial for further limiting weight gain. As such, prolonging the start of insulin therapy on the grounds of concern over weight gain appears to be counter-productive. This is especially true given the potentially superior glycemic control also associated with early insulin initiation. There is also some indication that concomitant treatment with metformin may help to offset insulin-based weight gain, though more studies are needed to clarify this. As always, patient characteristics such as physical and mental capacity to cope with the life-modifying injection regimes and multiple drug treatments should also be considered thoroughly before insulin prescription.
Acknowledgments
The DIVE registry is a national diabetes quality initiative with the participation of the German Diabetes Association (Deutschen Diabetes Gesellschaft; DDG), the ‘Verband der Diabetes-Beratungs-und Schulungsberufe in Deutschland e.V. (VDBD)’, the ‘Bundesverband Niedergelassener Diabetologen e.V. (BVND)’, the ‘Arbeitsgemeinschaft niedergelassener diabetologisch tätiger Ärzte e.V.’ (AND), the ‘Wissenschaftlichen Institut der niedergelassenen Diabetologen (winDiab)’, and the ‘Bundesverband der Diabetologen in Kliniken e.V. (BVDK)’. The authors thank Helen Sims from the Institut für Pharmakologie und Präventive Medizin, Mahlow, for her input into the manuscript.
References
Footnotes
Contributors TD and PB designed the registry. TB, JB, and PB outlined the analyses, which were performed by TB. PB and TB drafted the first version of the manuscript, which all other authors revised for important intellectual content. All authors approved the final version of the manuscript that was submitted.
Competing interests The registry received funding from Sanofi Aventis Deutschland GmbH. PB, TD and RWH report to have received consultancy honoraria from Sanofi Aventis. HF is an employee of Sanofi Aventis.
Patient consent Obtained.
Ethics approval Hannover Medical School.
Provenance and peer review Not commissioned; externally peer reviewed.
Data sharing statement No additional data are available.