Article Text

Abstract
Objective This study evaluated relationships between glycaemic control, body mass index (BMI), comorbidities and pharmacological treatment in patients with type 2 diabetes mellitus (T2D).
Research design and methods This was a retrospective, cross-sectional analysis of Quintiles electronic medical records research data (study period 1 October 2013–30 September 2014). Eligibility included age ≥18 years, T2D diagnosis, and at least one available BMI measurement.
Results The study included 626 386 patients (mean age, 63.8 year; 51.3% female; 78.5% white; 62.6%, BMI ≥30 kg/m2). A1c data were available for 414 266 patients. The proportion of patients with good glycaemic control (A1c ≤6.5) decreased as BMI category increased, ranging from 40.1% of patients with BMI <30% to 30.1% of patients with BMI ≥40. The proportions of patients with poor glycaemic control (A1c >8% and A1c ≥9%) increased with increasing BMI category. Oral antidiabetic drugs (OAD) were the most frequently used (54.4% of patients with A1c values). Among patients using insulin-based therapy, 50% had an A1c ≥8% and 29% had an A1c ≥9% regardless of concomitant OAD or glucagon-like peptide 1 receptor agonist use. Among patients using three or more OADs, 34.3% and 16.1% had A1c values ≥8% and ≥9%, respectively. There was no common trend observed for changes in the proportion of patients with T2D-related comorbidities according to BMI category. The most notable trend was a 7.6% net increase in the percentage of patients with hypertension from BMI <30 to BMI ≥40.
Conclusions This large dataset provides evidence that roughly one out of four patients with T2D is not well controlled, and the prevalence of poor glycaemic control increases as BMI increases.
- Type 2 diabetes
- obesity
- glycaemic control
- Comorbidity
This is an Open Access article distributed in accordance with the Creative Commons Attribution Non Commercial (CC BY-NC 4.0) license, which permits others to distribute, remix, adapt, build upon this work non-commercially, and license their derivative works on different terms, provided the original work is properly cited and the use is non-commercial. See: http://creativecommons.org/licenses/by-nc/4.0/
Statistics from Altmetric.com
Key message
What is already known about this subject?
Obesity has clearly been linked with type 2 diabetes mellitus (T2D), but there are limited data evaluating relationships between glycaemic control, body mass index (BMI), comorbidities and T2D treatment patterns.
What are the new findings?
The study, in a very large sample of US patients with T2D, revealed poor glycaemic control in roughly one of four patients, trends showing worsening control and higher rates of hypertension with increasing BMI, and poor glycaemic control, particularly among insulin users.
How might these results change the focus of research or clinical practice?
These data are evidence of a need for the continued pursuit of aggressive and effective strategies for managing T2D, especially in obese patients whose condition may make T2D management more challenging.
Introduction
The epidemic of type 2 diabetes mellitus (T2D) is increasing worldwide resulting in increased health burden and reductions in life expectancy. This epidemic is considered to partly be fueled by an increase in obesity rates, which has long been recognized as playing a role in the pathogenesis of T2D.1 2 Approximately 80% of patients with T2D are either overweight or obese.3
Effective treatment strategy to achieve good glycaemic control, as measured via hemoglobin A1c (A1c), is essential and has been well documented to correlate with the development of microvascular and macrovascular complications of T2D.4 Diabetes mellitus management using pharmacological treatments has become increasingly complex with the variety of agents and treatment guidelines available.5–7 Despite extensive treatment guidelines and a wide array of treatment options from the American Diabetes Association (ADA), the European Association for the Study of Diabetes (EASD)7 8 and the National Institute for Health and Care Excellence,9 the proportion of patients with T2D achieving good glucose control has not increased greatly since 2008.10
Limited real-world data are currently available that evaluate obesity prevalence according to BMI and glycaemic control via HbA1c values among patients with T2D and how this relates to treatment patterns and comorbidities. This study used a large electronic medical records (EMR) database to evaluate relationships between glycaemic control, BMI, comorbidities and pharmacological T2D treatment.
Research design and methods
Data source
The Quintiles EMR (Q-EMR) research database was the data source for this study. The Q-EMR database includes patient-level ambulatory medical records from approximately 35 million patients throughout the USA, captured with the GE Centricity user interface. This database contains data covering patient vital signs and laboratory results that include BMI and A1c values.
Study design and subjects
This was a retrospective, cross-sectional analysis of adults during the study period between 1 October 2013 and 30 September 2014. Inclusion criteria were age ≥18 years, medical record activity during the study period, at least one recorded BMI measurement during the study period; and a diagnosis of T2D according to a record of at least one International Classification of Diseases Ninth Revision (ICD-9) code of 250.x0 or 250.x2.
Individuals with Type 1 Diabeteswere excluded (ICD-9 codes 250.x1 or 250.x3). Also excluded were individuals with comorbidities that were known to cause excessive weight changes. These included malignancy, HIV, cachexia, anorexia, abnormal weight gain or loss, feeding difficulties, gastrointestinal disorders that result in intestinal malabsorption, including celiac disease, inflammatory bowel disease, acute and chronic pancreatitis, non-vitamin-related nutritional deficiencies, pregnancy, Cushing's syndrome and severe psychiatric disorders.
Analysis
Demographic characteristics, A1c values, T2D-related comorbidities and antidiabetic medication use were stratified and evaluated in relationship to BMI category. For patients who had more than one BMI measurement during the study period, the calculated mean of all available BMI values was used for analysis. Patients were grouped according to BMI category (<30, 30–<35, 35–<40 and >40 kg/m2) and age group (18–44, 45–64 and >65 years). T2D-related medications were grouped per medication class: oral antidiabetes drugs (OADs), glucagon-like peptide 1 receptor agonists (GLP-1 RA) and insulins.
Glycaemic control was assessed as each patient’s latest available A1c measurement during the study period. For analysis purposes, A1c findings were grouped into categories of ≤6.5%, >6.5%–<8%, ≥8%, and ≥9%. As an A1c measurement, ≥8% is considered a lower limit of poor glycaemic control, patient BMI distributions within the categories of A1c ≥8% and ≥9% was more closely examined to ascertain if a relationship between glycaemic control, BMI, and treatment modality could be observed.
For each patient, a Diabetes Complications Severity Index (DCSI) was determined and mean values for each BMI category were computed. The DCSI was designed to model the severity of diabetes mellitus complications at any given time point and is a useful tool for predicting mortality and risk of hospitalisation.11 The index factors in the following categories of complications: cardiovascular disease, nephropathy, retinopathy, peripheral vascular disease, stroke, neuropathy and metabolic.
No statistical tests for differences were used to differentiate among patients in the four BMI categories, as the analysis was intended to be an exploratory analysis and because the large sample size could make even minor differences appear to be statistically significant.
Results
Patient demographics and BMI distribution patterns
The study population included 626 386 patients (table 1). Approximately half of the population (51.7%) was ≥65 years of age, and only 7.2% were 44 years of age or younger. The majority (78.5%) of patients were white, and the largest geographic region represented was the South (41.1%). By BMI category, 37.4% of patients with T2D had a BMI <30 kg/m2, whereas the remaining 62.6% had a BMI ≥30 kg/m2, qualifying as obese according to National Heart, Lung, and Blood Institute (NHLBI) definitions.12 Furthermore, 16.2% of patients with T2D had a BMI ≥40, a category classified by NHLBI as ‘extreme obesity’.
Demographics of T2D study population by BMI category
Mean patient age decreased as BMI category increased, and the percentage of females increased with increasing BMI category. Black patients with T2D comprised 13.9% of all patients with T2D. Their proportions increased with higher BMI category to 16.7% of those with BMI >40. In comparison, white patients with T2D comprised 78.5% of all patients with T2D, but there was a lower proportion of white patients with BMI >40 compared with the next two lower BMI categories, BMI 30–<35 and 35–<40, which had moderately higher proportions. Patients with T2D using commercial insurance increased as a proportion of those with insurance as BMI category increased, whereas patients with Medicare decreased from 45% of those with BMI <30 to 30.3% of those with BMI >40.
Relationship between antidiabetes medication use, BMI and A1c
A1c data were available for 414 266 (66.2%) of the total 626 386 patients with T2D in the study. Among all patients with A1c data, 25.0% (n=1 03 447) had an A1c >8% and 13.4% (n=55 454) had an A1c >9% (table 2). Among patients using two OADs, 23.4% had an A1c ≥8% and 11.0% had an A1c ≥9%. Among patients using three or more OADs, 34.3% and 16.1% had A1c values ≥8% and ≥9%, respectively. The status of glycaemic control was even worse among patients using insulin-based therapy; among these patients 50% had an A1c ≥8% and 29% had an A1c ≥9% regardless of concomitant OAD or GLP-1 RA use.
Drug class for patients with A1c measurements
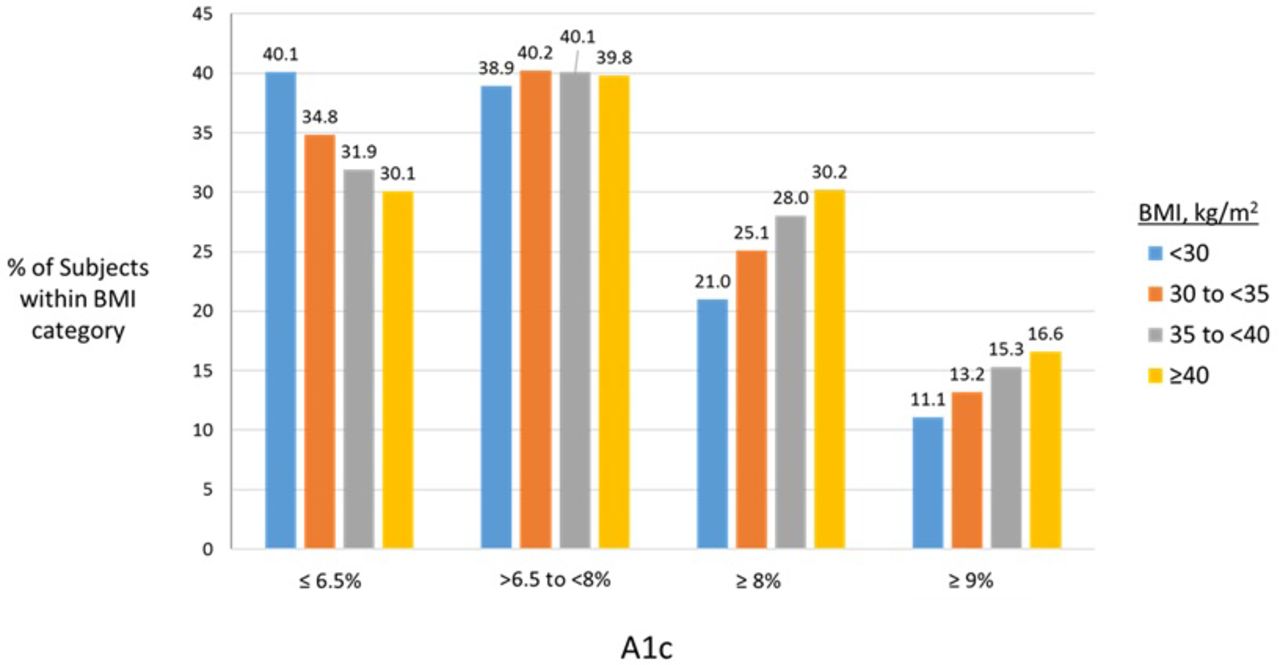
The BMI <30 subgroup had the largest proportion of patients with A1c ≤6.5% (40.1%) and the proportion of patients in this category of good glycaemic control decreased as BMI category increased (figure 1). Conversely, the proportions of patients with poor glycaemic control (A1c >8% and A1c ≥9%) increased with increasing BMI category. The proportions of patients with A1c values >6.5%–<8% within each BMI category were similar and ranged from 38.9% to 40.2%.

Categorical A1c distribution within BMI categories, n=414 266 patients with T2D and available A1c data. % values represent percentage of subjects within each BMI category having an A1c value within the categorical range. Category of A1c ≥8% reflects all patients at or over this cut-off (including ≥9%). BMI, body mass index; T2D, type 2 diabetes mellitus.
Figure 2 shows the distribution of antidiabetes medication classes among BMI categories for all patients. The BMI <30 category had the largest proportion of patients who used no drugs (17.7%). The proportion of OAD-only users decreased as BMI category increased. The median number of OADs used in each BMI category was 1. Conversely, insulin and GLP-1 RA use increased with increasing BMI category. Insulin use (alone and with a GLP-RA, both with or without OADs) was reported in 25.6% of patients with BMI <30; this proportion increased to 29.3%, 33.4% and 37.4% among patients with BMIs 30–<35, 35–<40 and ≥40, respectively. GLP-1 RA use (alone and with insulin, both with or without OADs) was reported in 2.7%, 5.7%, 7.8% and 9.8% of patients with BMIs <30, 30–<35, 35–<40 and ≥40, respectively.
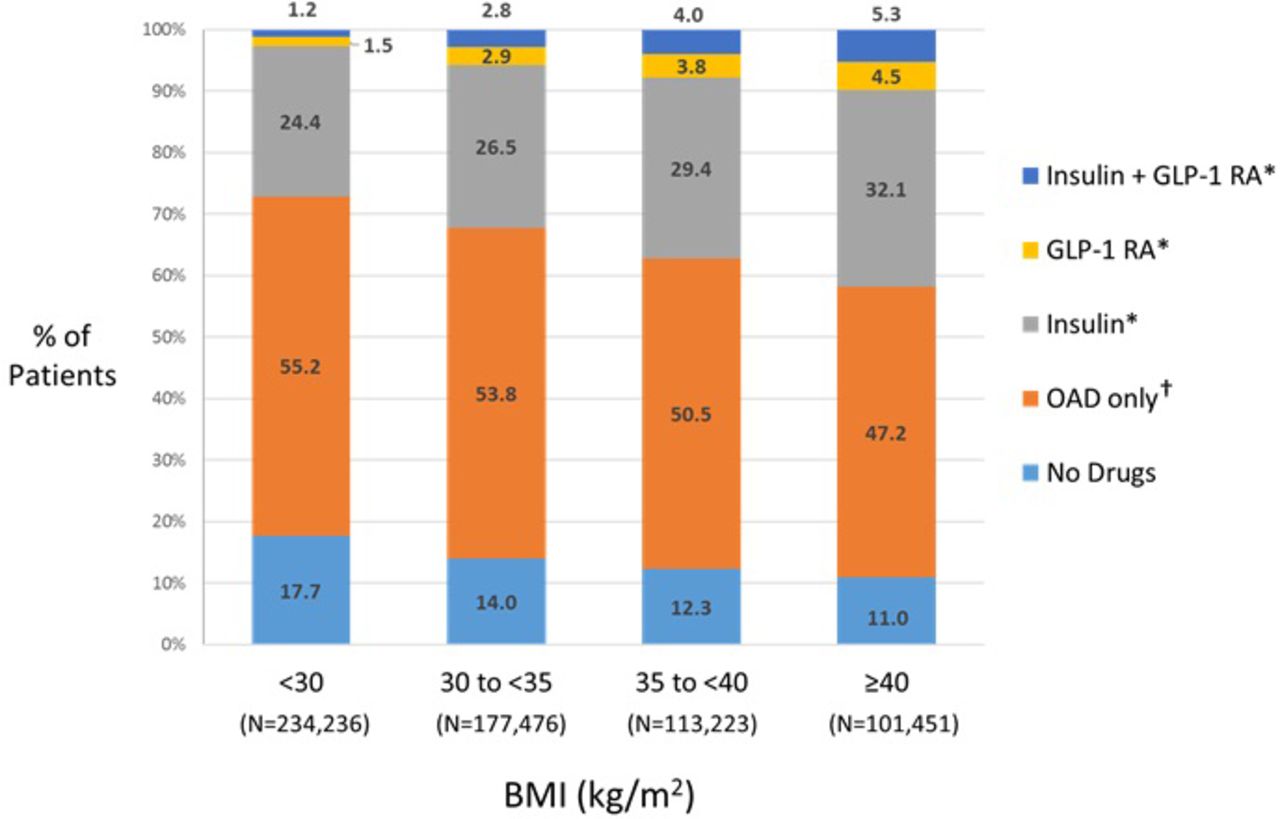
Distribution of T2D medication class users with each BMI category. *With or without OAD. †Median number of OADs used=1, regardless of BMI. BMI, body mass index; GLP-1 RA, glucagon-like peptide 1 receptor agonist; OAD, oral antidiabetes drug; T2D, type 2 diabetes mellitus; w/wo, with or without.
Relationship between T2D-related comorbidities and BMI
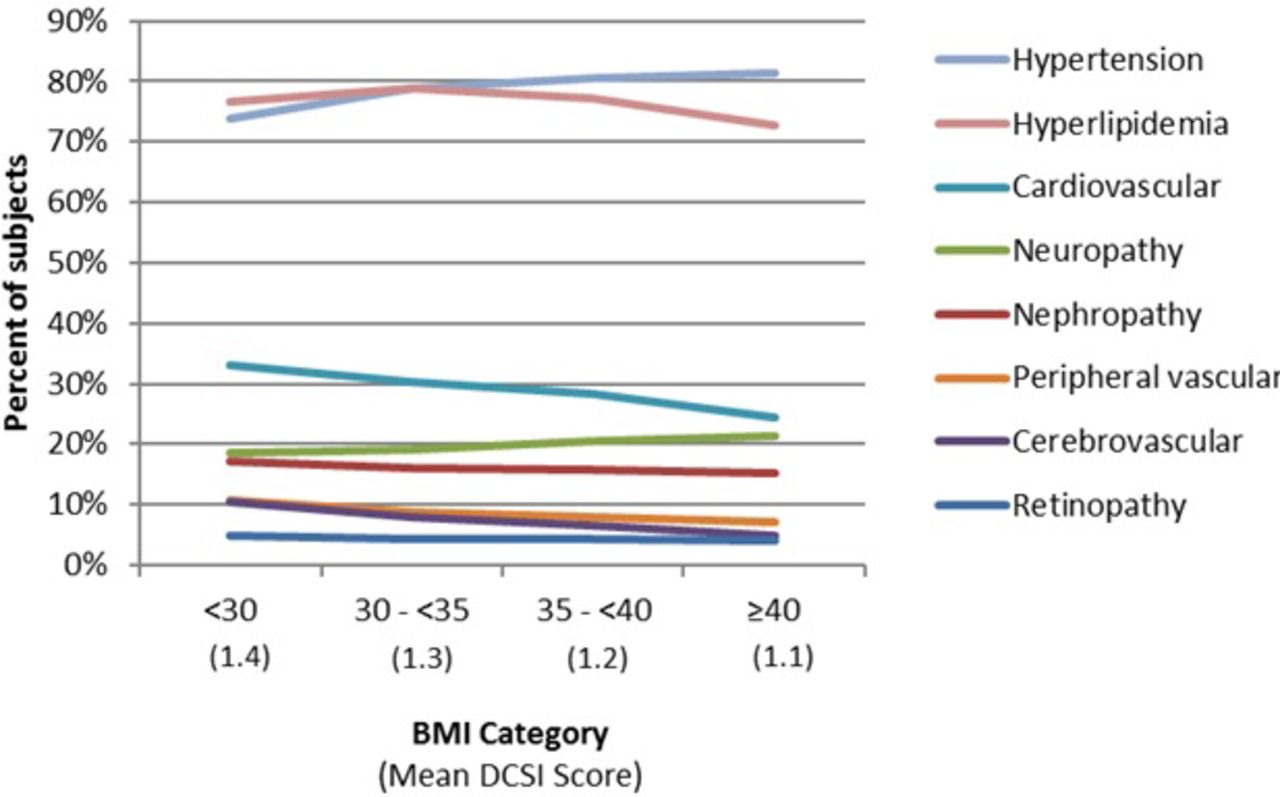
There was no common trend observed for changes in the proportion of patients with T2D-related comorbidities according to BMI category (figure 3). The proportion of patients with hypertension increased a net 7.6% from BMI <30 to BMI ≥40, but only 2.9% for neuropathy. There were small decreases in the proportions of patients with hyperlipidemia, nephropathy and peripheral vascular disease (ranging from −2.7 to −3.9%), and slightly larger decreases for the proportion of patients with cardiovascular and cerebrovascular disease (−8.6 and −5.6%, respectively) as BMI category increased. The proportion of patients with retinopathy was little changed (−0.9% across all BMI categories). Mean DCSI scores were slightly higher (1.4) for the BMI <30 category, decreasing to 1.1 for theBMI <40 category.

Comorbidity distribution by BMI category. BMI, body mass index; DCSI, Diabetes Complications Severity.
Conclusions
This study examined data of patients with T2D in a large EMR database to evaluate BMI and potential relationships with comorbidities, medication usage, and A1c status. To our knowledge, the current dataset represents one of the largest to date to have evaluated BMI and clinical and treatment characteristics in patients with T2D, with a total population of 626 386 patients, 414 266 of whom had A1c values available for analysis. This study is also the only large US study of its kind based on EMR data, which affords a unique and accurate means of capturing actual patient BMI data as well as clinical benchmark variables such as A1c. The Quintiles EMR research database (previously GE Centricity database) is a commercially available, high-quality source of anonymized medical records that is well recognised for its value in outcomes research.13–18 EMR data has been shown to be highly more accurate for capturing BMI status than claims data.19
The current analysis confirmed a high rate of obesity among patients in the USA with T2D. Approximately two-thirds (62.6%) of the current study population with T2D were classified as obese (BMI ≥30 kg/m2). Our study did not include a control group without T2D, but according to data from the National Health and Nutrition Examination Survey (NHANES; 1999–2006),20 21 the prevalence of obesity in the USA is estimated at about one-third of the general population. Furthermore, the prevalence of extreme obesity (BMI ≥40) in the current study was an alarming 16%, or about one in six patients, while NHANES data estimate the prevalence of extreme obesity to be approximately 5% in the general population. Thus, based on an indirect comparison of NHANES data and the current EMR data, the prevalence of obesity appears to be roughly doubled among individuals with T2D, and that of extreme obesity possibly three times higher. NHANES data from the period 1999–2006 also noted a prevalence of obesity (BMI ≥30) in 49% of patients with diabetes mellitus, which is lower than that noted in our EMR analysis. The reasons for this discrepancy are not clear. In the NHANES survey, BMI values are noted on actual height and weight assessments, as are the EMR data. However, it is worth noting that the size of the T2D population in the current dataset was substantially larger than that in the NHANES report (626 386 vs 2894).
As a surrogate marker of glycaemic control, A1c levels reflect average glycaemia over several months (3) and have been shown to be strongly predictive for the risk of diabetes mellitus complications.4 22 The ADA recommends A1c testing at a minimum of twice a year in patients who are meeting treatment goals, and quarterly if therapy is being changed and/or goals are not being met.23
Among patients in the current study with available A1c values, poor glycaemic control, defined as A1c ≥8%, was evident in 25% of patients, which is nearly identical to findings from the NHANES survey (23%; 1999–2006 data).24 Moreover, in this study, 13% of patients had an A1c ≥9%. These findings indicate that a sizeable percentage of T2D cases are not being well controlled, and this phenomenon appears to be exacerbated in patients with higher BMIs. There were notable trends in the current dataset showing increasing rates of poor glycaemic control with increasing BMI category. The opposite was also apparent, in that the highest proportion of patients with good glycaemic control (A1c) was noted in the lowest BMI category and was lower in each subsequent increase in BMI status. Mean A1c in this study was 7.2% in non-obese patients with T2D, and increased slightly to 7.5% in the highest 2 BMI categories. NHANES data showed similar mean A1c values ranging from 7.0% to 7.2% in obese BMI categories.
It should be noted that these data do not provide any means to evaluate cause and effect relationships or explain all the findings. The data suggest that patients with T2D and higher BMI may be more difficult to treat than those with lower BMI, as weight loss has been correlated with improved glycaemic control.25–27 Alternatively, patients with more poorly controlled T2D may, as a result, have higher BMIs. There are likely a complex variety of factors at play across the entire population, and even within individual patients.
Current guidelines from the ADA and the EASD suggest lifestyle modification (diet, exercise and weight reduction) as the initial approach to T2D.7 If lifestyle modification does not achieve the desired A1c target within about 3 months (A1c <7%), pharmacological therapy should be initiated, which includes oral antidiabetic agents and/or insulin.7 Given the progressive nature of the disease, a great majority of patients eventually require insulin.28 29 In the current study, insulin user groups had the highest proportions of patients with poor A1c control compared with other medication class users. Regardless of BMI, about half of insulin users had an A1c ≥8%. This could reflect more aggressive prescribing for patients who already had poorly controlled disease, or suggestive evidence that such regimens were not overly effective in many patients. In addition, obesity itself is associated with insulin resistance.30 The current data were not longitudinal and not designed to capture length of therapy which might provide more insight for interpretation of the A1c findings in relationship to treatment type. In addition, the general category of ‘insulin’ used in this study did not distinguish specific regimens such as basal, bolus, or a combination of both.
An evaluation of comorbidity prevalence between BMI categories in this population of patients with T2D suggested little difference between BMI groups for comorbidities commonly associated with T2D. In fact, the prevalence of several comorbidities (cardiovascular, nephropathy, peripheral vascular disease and cerebrovascular) showed a slight trend of decreasing as BMI increased, and mean DCSI score was lower in each sequentially higher BMI category. The one exception was hypertension which increased in prevalence as BMI increased, possibly a factor of higher BMI placing greater demands on the cardiovascular system despite the absence of overt cardiovascular disease, peripheral vascular disease or cerebrovascular disease. One potentially confounding issue is that age and BMI had an inverse relationship in this study, with higher BMI groups having lower mean ages. In general, the incidence of comorbidities would be expected to increase with age, even while BMI may be decreasing. However, given the younger mean ages in the higher BMI groups, those patients may have had a more recent T2D diagnosis, thus lower rates of comorbidities, which otherwise tend to be associated with disease duration. These findings are even more perplexing in light of the observation that higher BMI groups demonstrated less effective glycaemic control relative to lower BMI groups.
This study has certain inherent limitations based on design. Despite the sheer size of the patient population and the presumed reliability of data obtained from an EMR database, such data represent a cross-sectional snapshot of clinical and treatment characteristics and patterns. While the Quintiles EMR database is large and includes patients from 49 US states, the patient population may not be completely representative of the general T2D population in the USA or the world.
In conclusion, the current data indicate that roughly one out of four patients with T2D is not well controlled, and the prevalence of poor glycaemic control increases as BMI increases. These findings are sobering in light of the burgeoning diabetes epidemic and ongoing evolution of treatment strategies and new treatment options. Continued efforts need to be directed toward aggressive intervention, particularly in obese patients with T2D who, for possibly a variety of reasons, may be particularly difficult to manage.
References
Footnotes
Contributors WW, YT, TMH, SXK, BS, and JB were involved in study concept and design. YT conducted data collection. WW, YT, and ESK were involved in data analysis and interpretation. WW and EK contributed to the outline and first draft of the manuscript. WW, YT, ESK, TMH, SXK, BS, and JB all critically revised the manuscript at each stage and provided final approval of the manuscript.
Funding This study was funded by Novo Nordisk (Plainsboro, New Jersey). The authors received writing and editorial assistance from Judith Adams, PharmD and Sandra Westra, PharmD (Churchill Communications, Maplewood, New Jersey, USA) with funding from Novo Nordisk.
Competing interests WW and TMH are employees and stockholders of Novo Nordisk. SXK is an employee of Novo Nordisk. JB, EK, BS and YT were employees of Novo Nordisk at the time the study was performed.
Provenance and peer review Not commissioned; externally peer reviewed.