Article Text

Abstract
Objective Trans-cultural diabetes nutrition algorithm (tDNA) was created by international task force and culturally customized for Malaysian population. This study was designed to evaluate its effectiveness versus usual diabetes care in primary care settings.
Research design and methods We randomized 230 patients with overweight/obesity, type 2 diabetes, and glycated hemoglobin (A1c) 7%–11% to receive usual care (UC) or UC with tDNA for 6 months. The tDNA intervention consisted of structured low-calorie meal plan, diabetes-specific meal replacements, and increased physical activity. Participants were counseled either through motivational interviewing (tDNA-MI) or conventional counseling (tDNA-CC). The UC group received standard dietary and exercise advice through conventional counseling. All patients were followed for another 6 months after intervention.
Results At 6 months, A1c decreased significantly in tDNA-MI (−1.1±0.1%, p<0.001) and tDNA-CC (−0.5±0.1%, p=0.001) but not in UC (−0.2±0.1%, p=NS). Body weight decreased significantly in tDNA-MI (−6.9±1.3 kg, p<0.001) and tDNA-CC (−5.3±1.2 kg, p<0.001) but not in UC (−0.8±0.5 kg, p=NS). tDNA-MI patients had significantly lower fasting plasma glucose (tDNA-MI: −1.1±0.3 mmol/L, p<0.001; tDNA-CC: −0.6±0.3 mmol/L, p=NS; UC: 0.1±0.3 mmol/L, p=NS) and systolic blood pressure (tDNA-MI: −9±2 mm Hg, p<0.001; tDNA-CC: −9±2 mm Hg, p=0.001; UC: −1±2 mm Hg, p=NS). At 1 year, tDNA-MI patients maintained significant reduction in A1c (tDNA-MI: −0.5±0.2%, p=0.006 vs tDNA-CC: 0.1±0.2%, p=NS and UC: 0.02±0.01%, p=NS) and significant weight loss (tDNA-MI: −5.8±1.3 kg, p<0.001 vs tDNA-CC: −3.3±1.2 kg, p=NS and UC: 0.5±0.6 kg, p=NS).
Conclusions Structured lifestyle intervention through culturally adapted nutrition algorithm and motivational interviewing significantly improved diabetes control and body weight in primary care setting.
- lifestyle intervention
- type 2 diabetes
- metabolic control
- weight loss
This is an Open Access article distributed in accordance with the Creative Commons Attribution Non Commercial (CC BY-NC 4.0) license, which permits others to distribute, remix, adapt, build upon this work non-commercially, and license their derivative works on different terms, provided the original work is properly cited and the use is non-commercial. See: http://creativecommons.org/licenses/by-nc/4.0/
Statistics from Altmetric.com
Significance of this study
What is already known about this subject?
Medical nutrition therapy (MNT) is effective for weight loss and improves glycemic control in type 2 diabetes.
What are the new findings?
Culturally-adapted, structured lifestyle intervention that includes MNT, physical activity, and motivational interviewing significantly improved weight loss and metabolic control in patients with overweight/obesity and type 2 diabetes.
How might these results change the focus of research or clinical practice?
Providing a structured lifestyle intervention can help patients simplify the decision-making process and make dietary changes easier to follow.
Incorporating behavioral counseling such as motivational interviewing as part of a structured lifestyle intervention can further enhance adherence and lead to significantly better metabolic outcomes.
Introduction
One of the major contributors to the rise in the global prevalence of pre-diabetes and type 2 diabetes is overweight and obesity. Overweight/obesity increases insulin resistance and glucose intolerance, rendering type 2 diabetes in patients with overweight/obesity more difficult to treat, non-pharmacologically or pharmacologically.1 2 Weight loss of at least 5%–10% in patients with overweight/obesity and type 2 diabetes confers significant benefit in terms of decreasing insulin resistance and improving glycemic control, dyslipidemia and blood pressure.3 Effective implementation of medical nutrition therapy (MNT) with diabetes-specific therapeutic diets also improves glycemic control and risk for type 2 diabetes complications.4 Therefore, based on an expanding and compelling evidence linking healthy lifestyle interventions with clinical benefit in type 2 diabetes, an international group of diabetes and nutrition experts developed the trans-cultural diabetes nutrition algorithm (tDNA) as a practical tool to optimize care centered on cultural, ethnic, and geographic adaptations.5
Malaysia has a rising prevalence of type 2 diabetes affecting 17.5% of the adult population,6 with only a third of patients achieving the glycemic target of glycated hemoglobin A1c (A1c) <7.0%.7 8 The rise in type 2 diabetes prevalence parallels the increasing overweight and obesity prevalence among Malaysians. The National Diabetes Registry 2009–2012 demonstrated that 83.4% of Malaysian patients with type 2 diabetes were, in fact, obese9 and 75% had abdominal obesity.10 Moreover, in Malaysia, only 16.4% of patients adhered to the dietary regimen provided by dietitians.11
The tDNA template was adapted for a Malaysian application, taking into account cultural differences in lifestyle, including healthy eating patterns, and genetic factors.12 The Malaysian tDNA recommends MNT as an integral component of glycemic control in type 2 diabetes. Patients should receive personalized nutrition counseling from dietitians, targeting weight loss of 5%–10% in 6 months, use of meal replacements to reduce total calorie intake, increased physical activity, and enhanced support to motivate patients so they can adhere with MNT recommendations. The Malaysian tDNA was configured as a structured lifestyle intervention toolkit, consisting of meal plans, physical activity prescriptions, and general nutrition information, and then delivered using validated behavioral theories to promote adherence. This study aims to demonstrate the effectiveness of the Malaysian tDNA compared with usual care (UC) in patients with overweight/obesity and type 2 diabetes in the primary care setting.
Research design and methods
Study design
This study was a randomized, open-label, clinical trial conducted with 6 months’ intervention and 6 months’ passive follow-up among patients with overweight/obesity and type 2 diabetes. The study site was a primary care clinic in Seremban town, Negeri Sembilan. Ethical approval was obtained from the institutional review committee (IMU-R-134/2014) and from the National Medical Research Registry, Ministry of Health Malaysia (NMRR-14-1042-19455). Informed consent was obtained from all patients before screening and at enrollment, consistent with the Helsinki Declaration and the guidelines of the institutional review committee.
Participants
The clinic’s register of patients with type 2 diabetes was reviewed and those who did not fit the age criteria were omitted from the attained list. Thereafter, medical records were assessed for further eligibility for recruitment. Contact details of patients who fulfilled the selection criteria were obtained. Patients were contacted through phone for verbal consent after an explanation on the study objectives and procedures was given. Patients who expressed interest to participate in the study were scheduled to come to the clinic. At the clinic, patients were provided with the information sheet regarding the trial in dual language (Malay and English) and written consent was obtained. Patients were recruited if they were male or female, aged 30–65 years, with body mass index (BMI) of >23 kg/m², and type 2 diabetes with A1c levels 7%–11%, not treated with insulin. Pharmacotherapy for type 2 diabetes must have been unchanged in the last 3 months. Patients were excluded if they were pregnant or nursing, and had a history of serious diabetes-related complications or had a severe illness.
Randomization
Patients were randomized to receive UC or a structured lifestyle intervention based on the Malaysian tDNA using a random allocation software.13 Patients in the tDNA group were further randomized to receive either counseling with motivational interviewing (tDNA-MI) or conventional counseling (tDNA-CC) techniques to promote adherence with lifestyle recommendations. All study patients were required to complete a 2-week run-in period, which included successful self-monitoring of eating patterns and physical activity, as well as willingness to adhere to the study procedures.
Intervention
Structured lifestyle intervention
Patients in the tDNA intervention group underwent an initial risk stratification checklist and were prescribed MNT consisting of a structured low-calorie meal plan (1200 or 1500 kcal/day) using normal foods, incorporation of one or two diabetes-specific formula servings (Glucerna SR, Abbott Nutrition, USA) as meal replacements according to the tDNA protocol and provided free of charge, and a physical activity prescription of at least 150 min per week. Patients received education using the tDNA toolkit and consisting of a flip chart on healthy eating, 14-day meal plans, and culturally adapted information on physical activity and exercise.
The tDNA-MI subgroup received counseling that incorporated motivational interviewing principles.14 Motivational interviewing is directive, with a goal of eliciting self-motivational statements and behavioral change in addition to creating discrepancy to enhance motivation for positive change.14 The principles of motivational interviewing include expressing empathy through reflective listening, developing discrepancy between patients’ goals or values and their current behavior, avoiding argument and direct confrontation, adjusting to patient resistance, and supporting self-efficacy and optimism.14 The tDNA-CC subgroup received conventional counseling techniques that focused on empathetic listening, education, persuasion, and encouragement.
Usual care
The UC comparator group followed the clinical care pathway of the Malaysian Clinical Practice Guidelines for Type 2 Diabetes Mellitus (2009) and received advice to follow a conventional low-calorie diet plan (1200 or 1500 kcal/day) using normal foods with standard diabetes support and lifestyle education. Dietary counseling was conducted by the dietitian based on individualized care using conventional counseling techniques to facilitate positive behavioral change toward weight loss.
Follow-up
All patients were followed up at 3 and 6 months’ after termination of the intervention. During this phase, patients were required to keep a diary of food intakes and physical activities on a weekly basis. This follow-up phase focused on patients’ self-adherences to lifestyle change and effect on weight and A1c control after the intervention has been terminated.
Frequency of contact
Patients in the tDNA-MI and tDNA-CC were followed up monthly by the dietitian and physician during the intervention phase and subsequently every 3 months during the follow-up phase. Patients in the UC group were followed up 3 monthly throughout the study duration by the dietitian and physician. All patients were contacted via telephone only to remind them of their scheduled clinic visits and also to reschedule missed appointments.
Primary and secondary outcomes
The primary outcomes of the study were changes in A1c, while the secondary outcome measures were changes in weight, BMI, waist circumference, percentage body fat, fasting plasma glucose (FPG), systolic and diastolic blood pressure, blood lipid levels, and high-sensitivity C reactive protein (hsCRP).
Measurements
Weight was measured using a digital weighing scale (Tanita HD-319, Tanita, Japan) and height was measured using a stadiometer (SECA, Hamburg, Germany). BMI was calculated using the obtained weight and height measurements. Waist circumference was taken at the midpoint between the lower margin of the last palpable rib and the top of the iliac crest with a measuring tape. Body fat was measured using a bioelectrical impedance analysis machine (Omron Karada Scan HBF-356, Omron Healthcare, Japan). Seated blood pressure was measured in duplicate, using an automated device after a 5 min rest. Prior to measurement, the patient’s blood pressure was measured in both arms to determine which arm should be used for future measurements. The arm that gave higher systolic reading was used for all future testing.
Blood was withdrawn from patients after an overnight fast of 10–12 hours and analyzed using automated procedures. Blood measurements included A1c, FPG, total cholesterol, low-density lipoprotein-cholesterol (LDL-C), high-density lipoprotein-cholesterol, triglyceride, and hsCRP.
Food intake was recorded for 3 days (2 weekdays and 1 weekend, consecutively) by patients using household measurements. Colored food albums with photographs of actual serving sizes were used to help quantify the food portions consumed. Written instructions with example of a 1-day food record were given to all patients. Food records were reviewed by the dietitian during face-to-face patient encounters. Patients in the tDNA groups kept monthly food records during the intervention phase and subsequently every 3 monthly records during the follow-up phase. Patients in the UC group kept 3 monthly food records throughout the study. The nutrient content of each food was analyzed using Nutritionist Pro computer software (V.5.1.0, Axxya Systems, USA), primarily based on the nutrient composition of Malaysian foods.15
Physical activity level was assessed every 3 months using the International Physical Activity Questionnaire-Short Form validated for Malaysians. Patients also recorded a daily exercise diary. A medicine profile questionnaire was developed and implemented for this study. This questionnaire consisted of the type of medicines, dosage, frequency, and any remarks pertaining to the intake of medicines.
Patients were required to self-report the frequency and amount of diabetes-specific formulas consumed as meal replacements on a daily basis. Patients were also asked to return the scoops from each can of the formulas. The adherence rate was calculated as percentage of the actual consumption over expected consumption at each month.
Power and sample size
The sample size was calculated based on published data from the Look AHEAD (Action for Health in Diabetes) study results for A1c changes.16 The differences between the A1c means calculated was 0.4% between the intensive lifestyle intervention and diabetes support and education groups at 80% power with a type 1 error of 5% (α=5%). With an assumed SD of 1 from the Look AHEAD study, the sample size obtained was 115 patients per arm inclusive of 15% dropout rate. Hence, the total sample size needed for this study was 230 patients (115 patients receiving UC; 115 patients receiving tDNA care).
Statistical analysis
Statistical analysis was done using the Statistical Package for Social Sciences (SPSS) V.22 software. Descriptive statistics (mean, SD, median, IQR, SE, frequency, and percentage of patients) were used to describe the baseline data. The parametric data were presented as mean±SD, where comparisons between groups were done using one-way analysis of variance (ANOVA) for continuous variables. The non-parametric data were presented as median±IQR, where comparisons between groups were done using Kruskal-Wallis test for continuous data. The χ² tests were used for comparison between groups for categorical data.
Changes in outcomes were computed from baseline to 6 or 12 months of the intervention period. The absolute changes and percentage changes of measures were computed as below:
Absolute change=mean at 6 or 12 months – mean at baseline


Comparisons of changes in outcomes within groups were made using the generalized estimating equation test for intention-to-treat analysis, and comparisons of changes in outcomes between groups were made using the one-way ANOVA and Kruskal-Wallis tests for per-protocol analysis. The post-hoc Sidak test was used to report multiple comparisons within groups. . All p values of less than 0.05 were statistically significant.
The benefit of modest weight loss was examined between percentage weight loss categories and absolute change in A1c level. Patients were categorized based on their weight changes from baseline to 6 months of intervention: gained >2%, remained stable weight (±2%), lost >2% to ≤5%, lost >5% to ≤8%, and lost >8%. These categories were selected in order to allow adequate proportions of patients for analysis. Mean and SEM (±2 SE) were plotted to illustrate significant interactions, and separate linear regression models determined significant relationships between the tested variables.
Results
Baseline data
Figure 1 shows the trial enrollment, in which out of the 11 431 patients listed in the clinic register, 473 (41.4%) were found to be eligible for clinic visits to confirm eligibility. Only 244 attended the clinic screening; 229 (48.4%) did not consent or come in for the appointment. Of these, 14 individuals were ineligible because they did not meet the inclusion criteria for A1c. Hence, 230 (94.2%) were ultimately randomized: 115 were assigned to the tDNA intervention group (58 in tDNA-MI; 57 in tDNA-CC) and 115 to the UC group.

Patients’ retention rates. tDNA-CC, trans-cultural diabetes nutrition algorithm-conventional counseling; tDNA-MI, trans-cultural diabetes nutrition algorithm-motivational interviewing.
The median and IQR for the age of study patients were 55±8 years for both tDNA-MI and tDNA-CC groups and 54±8 years for UC groups. The majority of patients were female in the tDNA groups compared with the UC group (tDNA-MI 67.2%; tDNA-CC 87.4%; and UC 48.7%), while all groups had similar ratios of patients from the three main Malaysian ethnicities (Malays 14%, Chinese 28%, Indians 58%). This is in line with type 2 diabetes being more prevalent among Malaysian Indians in the country. More than 90% of the patients were married.
At baseline, UC patients had higher median values for height and lower median values for body fat percentage due to more male patients being randomized into this group compared with tDNA groups (table 1). The median values for FPG was significantly (p<0.001) lower in the tDNA-MI patients (6.9±1.8 mmol/L) compared with tDNA-CC (7.6±2.9 mmol/L) and UC (7.8±2.7 mmol/L). All other biochemical data including A1c, blood pressure, energy intake, and exercise duration per week were not significantly different in the groups at baseline.
Baseline characteristics of patients (n=230)
The median duration of patients having type 2 diabetes was significantly (p=0.047) lower in the tDNA-CC group (6±3 years) than in tDNA-MI (8±5 years) and UC (7±5 years) groups. However, there was no significant difference in comorbidities in the three groups. Hypertension and dyslipidemia represented the major comorbid conditions in the three groups (34.5% tDNA-MI, 35.1% tDNA-CC, and 35.7% UC). Similarly, there was no significant variance in pharmacologic therapy among the patients. Overall, they were treated with oral antidiabetic agents: biguanides only (n=214), sulfonylureas only (n=183), or combination of the two (n=15). Majority were also taking antihypertensive drugs (n=360), statins (n=164), and fibrates (n=7).
Changes at 6 months’ intervention phase
The adherence rates of the tDNA-MI and tDNA-CC patients to the meal replacements were comparable (tDNA-MI 94.8%±5.7% and tDNA-CC 96.2%±5.1%; p=0.217). After 6 months of receiving either tDNA intervention or UC, patients in the tDNA groups showed significant lowering of A1c, which was the primary outcome of the study. The A1c improved significantly for patients in both the tDNA intervention groups, with the tDNA-MI patients achieving a greater lowering of A1c values (−1.1±0.1%, p<0.001) than the tDNA-CC patients (−0.5±0.1%, p<0.001), as shown in table 2. The A1c values in the UC group had no significant changes from baseline.
Changes in weight and metabolic measures after 6 months’ intervention phase (mean±SE)
The body weight and BMI also reduced significantly in both the tDNA intervention groups, where tDNA-MI group achieved a greater (mean±SE) weight loss of 6.9±1.3 kg (p<0.001), while patients in the tDNA-CC group achieved weight loss of 5.3±1.2 kg (p<0.001). Similarly, the magnitude of loss was greater in the tDNA-MI group for BMI than in the tDNA-CC group. The UC group did not show any significant changes in weight, BMI, and A1c during the first 6 months.
Waist circumference (tDNA-MI: −4.0±1.1 cm, p=0.002; tDNA-CC: −2.7±1.0 cm, p=0.062; UC: −0.5±0.5 cm, p=0.960) and FPG (tDNA-MI: −1.1±0.3 mmol/L, p=0.011; tDNA-CC: −0.6±0.3 mmol/L, p=0.632; UC: 0.1±0.3 mmol/L, p=1.000) decreased significantly in the tDNA-MI group than in the tDNA-CC and UC groups.
Systolic blood pressure also decreased significantly in the tDNA-MI (−9±2 mm Hg, p<0.001) and tDNA-CC (−9±2 mm Hg, p=0.001), but not in the UC patients (−1±2 mm Hg, p=1.000). Diastolic blood pressure, however, was significantly lowered in tDNA-CC patients (−6±2 mm Hg, p=0.008), but not in the tDNA-MI (−3±1 mm Hg, p=0.442) and UC groups (−1±1 mm Hg, p=0.980).
At 6 months, the hsCRP did not change for any of the groups. In the UC group, total cholesterol (UC: −0.3±0.1 mmol/L, p<0.001; tDNA-MI: −0.2±0.1 mmol/L, p=0.599; tDNA-CC:−0.2±0.1 mmol/L, p=0.493) and LDL-C were lowered significantly (UC: −0.26±0.07 mmol/L, p=0.005; tDNA-MI: −0.08±0.08 mmol/L, p=0.980; tDNA-CC:−0.18±0.09 mmol/L, p=0.386) due to an increase in statin dose and change to stronger medication in the majority, that is, 56.5% of patients, while only 38.5% of patients in the tDNA groups had their lipid-lowering medication adjusted.
Patients in the tDNA groups ate significantly fewer calories (tDNA-MI: −574±43 kcal/day, p<0.001; tDNA-CC: −458±47 kcal/day, p<0.001) than patients in the UC group (−171±46 kcal/day, p=0.002) at 6 months. There was a concomitant decrease in carbohydrate, protein, and fat intake, with the decrease in energy intake in the tDNA patients with the exception that UC patients maintained their protein intake. Patients in tDNA-MI group also did longer duration of exercise (188±16 min/week, p<0.001) than patients in the tDNA-CC (149±24 min/week, p=0.383) and UC groups (106±14 min/week, p=1.000) (table 3).
Changes in dietary intake and exercise duration after 6 months’ intervention phase (mean±SE)
About 41.0% of tDNA-MI patients and 38.0% of tDNA-CC patients experienced symptomatic hypoglycemia at an average of two to four episodes in a month, which were resolved at once. They received diabetes medicine adjustments in addition to dietary treatment of hypoglycemia. The use of oral diabetic agents decreased in more tDNA-MI (19.6%) than tDNA-CC patients (12.5%), while it increased for 37.4% of the UC patients.
Changes at follow-up
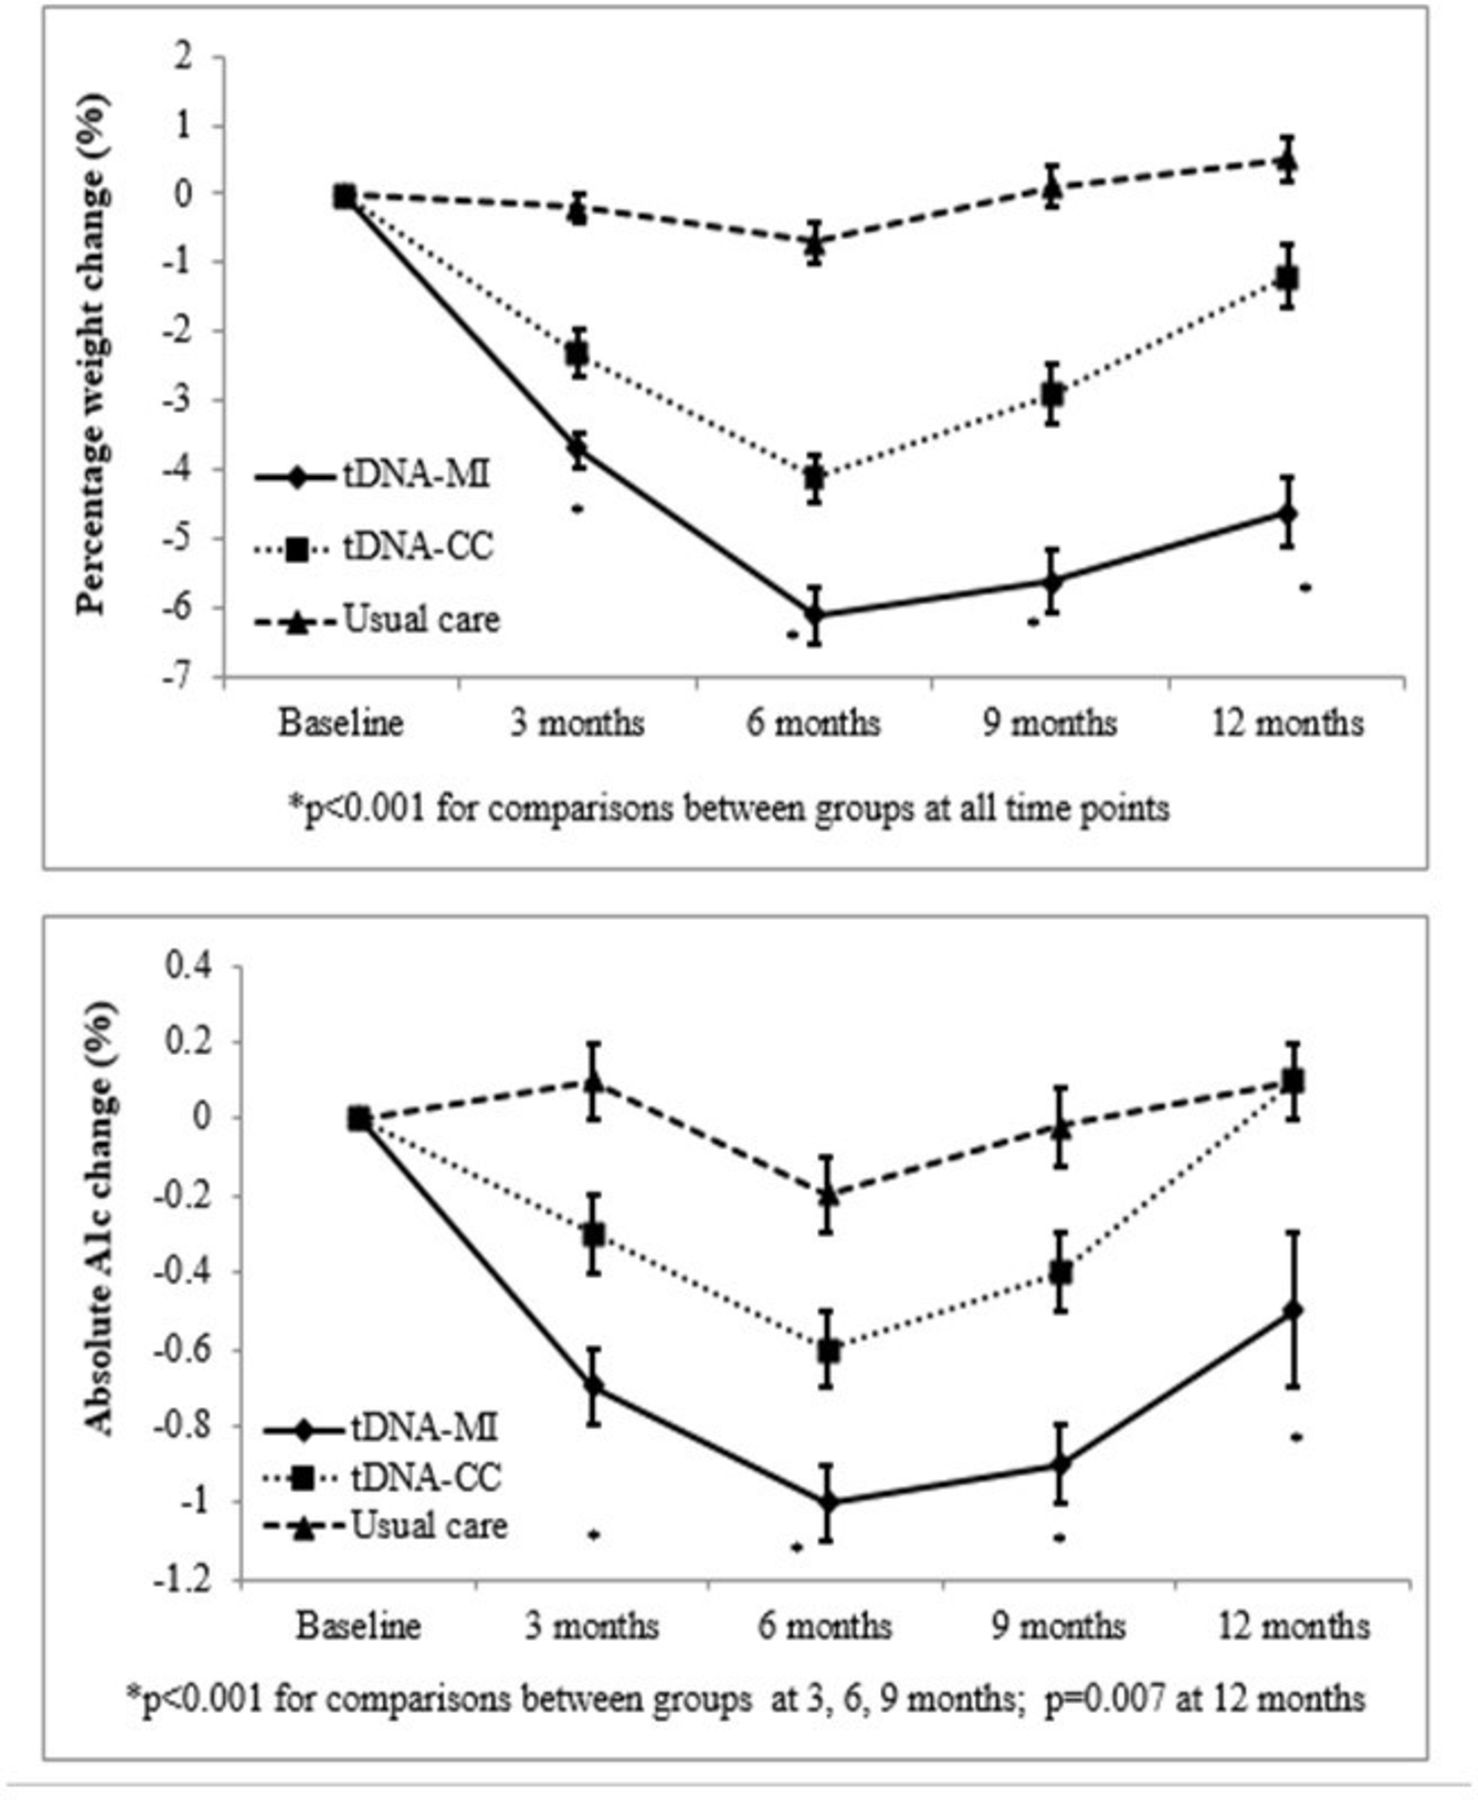
When patients were followed up, that is, 6 months after the intervention has stopped, the weight, BMI, and A1c of all groups increased (figure 2). However, tDNA-MI patients were able to maintain significant weight loss from their baseline but not for patients in tDNA-CC and UC groups (−5.8±1.3 kg vs −3.3±1.2 kg vs 0.5±0.6 kg, p<0.001, respectively). This corresponded to percentage weight loss of −4.6±0.5% in tDNA-MI, −1.2±0.5% in tDNA-CC, and 0.5%±0.3% in UC groups (p<0.001), respectively (figure 2). The tDNA-MI group also maintained a significant reduction of A1c from baseline during the follow-up phase, but tDNA-CC and UC patients had A1c values returning to baseline (−0.5±0.2% vs 0.1±0.1% vs 0.1±0.1%, p=0.007, respectively; figure 2).

Graph of percentage weight change and absolute change in A1c with time (mean±SE). *Significant changes between groups from baseline at p<0.05 by one-way analysis of variance. A1c, glycated hemoglobin; tDNA-CC, trans-cultural diabetes nutrition algorithm-conventional counseling; tDNA-MI, trans-cultural diabetes nutrition algorithm-motivational interviewing.
Weight changes and A1c
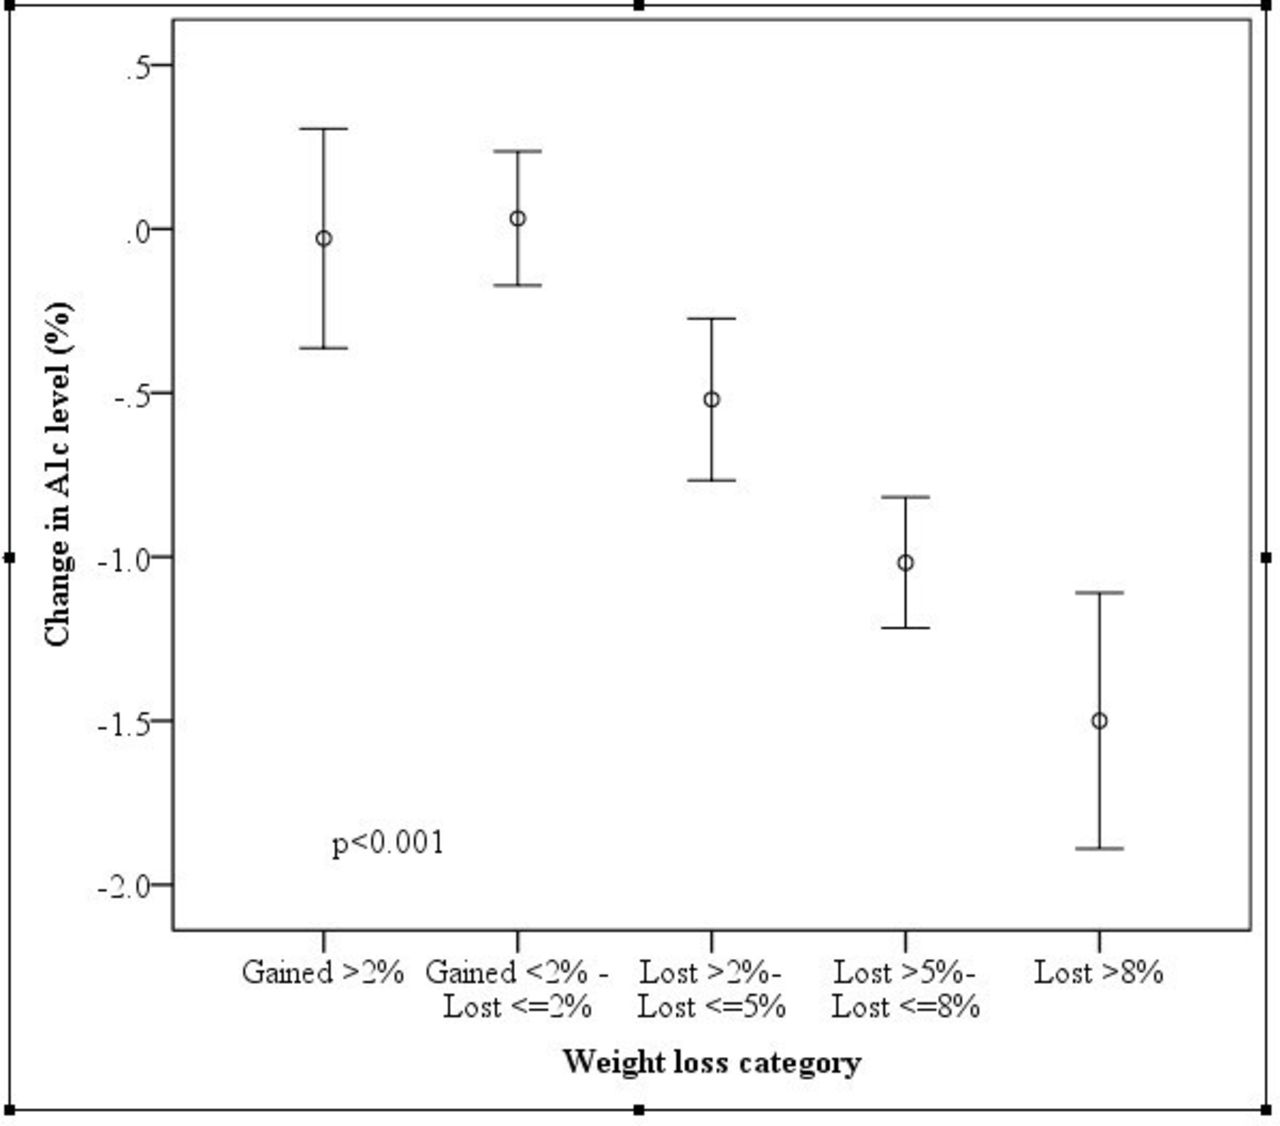
The benefit of modest weight loss on A1c was examined between percentage weight loss and change in A1c for the entire study population (n=230) (figure 3). There was a significant interaction between the amount of weight loss and A1c. The results showed a significant relationship of modest weight loss (as low as 2%–5% from baseline) with reduction in A1c by −0.5% (p<0.001). Furthermore, weight loss of 5%–8% was associated with a further drop in A1c by −1.0% (p<0.001).

Graph of mean and SEM (mean±2 SE) between weight loss categories and change in glycated hemoglobin (A1c). *Significant association by regression analysis at p<0.05.
Conclusions
The present results show that MNT based on the Malaysian tDNA and a customized pragmatic toolkit provides a structured lifestyle approach achieving clinically significant weight loss and improved glycemic control in patients with overweight/obesity and type 2 diabetes. After 6 months, patients in the tDNA-MI group achieved an average weight loss of −5.8 kg (−5.2% change) of initial body weight, −3% drop in BMI, and significant reductions of body fat and waist circumference. The changes in body weight and composition were associated with a significant decrease in A1c of −0.8% and FPG by −5% in the intervention group. Patients in the tDNA groups also had significant lowering of systolic blood pressure by an average of −9.0 mm Hg (−6% change). The provision of structured meal plans with the use of meal replacements also led to higher decrease in energy intakes in the tDNA patients. The increased exercise minutes practiced by the tDNA-MI group possibly contributed to the higher drop in body weight as well.
Change in body weight in the present study was linearly correlated with A1c reduction, where modest weight loss of just 2%–5% was sufficient to produce significant improvement in A1c in these patients. Several meta-analyses17 18 have reported an average weight reduction of 5 kg or around 6% from baseline using lifestyle interventions with incorporation of meal replacements in patients with type 2 diabetes, compared with UC or brief diabetes education sessions. Terranova et al 17 reported a pooled effect of A1c reduction of −0.29%, while Chen et al 19 reported a significant reduction in A1c by −0.37%. Several other studies involving lifestyle interventions with the incorporation of meal replacements reported weight losses of 2–4 kg in 1 year,20–23 with corresponding drops in A1c ranging from 0.1% to 0.8%. Hence, the magnitude of weight loss and A1c reduction achieved in this study is higher compared with several other similar studies conducted in diabetes populations using lifestyle interventions.
Cardiovascular risk reduction with structured lifestyle intervention may have been related to the significant reduction in waist circumference, blood pressure, and hyperglycemia in this study. Achieving a reduction in adiposity correlates with decreased insulin resistance and should be an essential therapeutic target.24 25 Evidence from the UKPDS studies have shown that reduction in blood pressure can significantly reduce microvascular complications by 37% and risk of stroke by 44%.26 However, lipid profile changes could not be attributed to the tDNA intervention in this study since the majority of patients were on statin drugs and had optimal cholesterol levels at baseline. In addition, there were no changes in hsCRP, indicating the absence of any significant change in inflammatory responses, regardless of the intervention provided.
In the subsequent 6-month follow-up after the intervention terminated, all groups regained some of their lost weight—a common observation after successful weight loss treatment—leading to the concomitant rise in A1c. The usual course of weight loss therapy shows that weight is quickly lost at first, and the point of greatest loss occurs 6 months after beginning of treatment; then the weight is slowly regained until weight returns near the baseline level,27 as also demonstrated by this study. Several factors can lead to weight regain: changes in appetite-related hormones causing increased hunger and energy storage, and diet-induced lean weight loss causing decreased energy expenditures.28
One of the most significant findings of this study is the beneficial effects of using a counseling approach that incorporates motivational interviewing as part of a structured lifestyle intervention. tDNA-MI patients in the study showed significantly better outcomes in terms of weight, BMI, body composition, A1c, FPG, systolic blood pressure, reduced energy intake, and increased exercise minutes during the 6 months’ intervention period. Moreover, patients receiving motivational interviewing maintained significantly lower body weight and A1c levels even 1 year after the intervention terminated. There is increasing evidence that the use of motivational interviewing to assist weight loss program for type 2 diabetes can result in higher weight loss and maintenance of weight loss.29 Physicians applying the motivational interviewing ‘spirit’ (such as collaboration) and motivational interviewing-consistent strategies (such as reflective statements) had patients with obesity who demonstrated significantly greater weight loss than with those physicians not embedding the motivational interviewing spirit or using motivational interviewing-inconsistent behaviors (such as judging and confronting).30 A meta-analysis of six studies evaluated the effectiveness of motivational interviewing on self-management in patients with type 2 diabetes and reported that A1c was significantly lowered in the intervention groups at 6 months compared with control groups (weighted mean difference=−0.44, 95% CI −0.73 to −0.15, p=0.003).31
Providing a structured intervention was able to help individuals simplify the decision-making process and identify how to make changes, and in addition the use of meal replacements provided a strategy that enhanced dietary adherence.32 One meta-analysis found that the use of meal replacements increased both short-term and long-term average weight loss by about 2.5 kg, compared with prescription of a conventional reducing diet with the same calorie goals.33 In the Look AHEAD study, at 1 year, meal replacements used as part of the comprehensive behavioral strategy were associated with an 8.6% weight loss compared with a 0.7% weight loss in the control group receiving standard diabetes support and education.34 The use of meal replacements also assists weight maintenance or further weight loss in patients who lost at least 5% of body weight.35 Other factors contributing to the positive results seen in the patients in this study included frequent food diary and exercise self-monitoring. A review reported that self-monitoring in weight loss interventions was necessary to support behavior change for weight loss as it encourages the development of self-regulatory skills, such as evaluating and reinforcing progress made toward a particular behavior.36
In conclusion, culturally-adapted, structured lifestyle intervention that includes MNT, physical activity, and motivational interviewing significantly improves weight loss and metabolic control in patients with overweight/obesity and type 2 diabetes.
Acknowledgments
The authors thank Associate Professor Dr Karunathan Chinna from the Department of Social and Preventive Medicine, University Malaya, Malaysia, for assisting in the statistical analysis. The authors also thank all the study volunteers for their participation in the study.
References
Footnotes
Original reference: none
Parts of this study were presented as a late-breaking poster presentation at the 76th Scientific Sessions of the American Diabetes Association, New Orleans, LA, 10-14 June 2016.
Contributors All authors read and approved the final manuscript. WSSC was involved in conception and design of the study, data analysis and interpretation, and editing and writing of the manuscript. HKGS was involved in data collection, analysis, data interpretation, and editing of the manuscript. OH, JIM, AB, VKML, SZMA, and ZH provided input on the intellectual content of critical importance to the work described and editing of the manuscript.
Funding This study was funded by Abbott Nutrition, Malaysia. The funding body did not influence the collection, analysis and interpretation of data, writing of the report, and decision to publish the manuscript.
Competing interests None declared.
Patient consent Obtained.
Ethics approval International Medical University Institutional Review Board and National Medical Research Registry, Ministry of Health Malaysia.
Provenance and peer review Not commissioned; externally peer reviewed.