Article Text

Abstract
Objective Whey protein (WP) intake has been shown to reduce postprandial glycemia. Majority of WP research in type 2 diabetes (T2DM) involved acute challenge or weight loss studies. It is not known if WP supplementation can provide sustained glucose lowering. Our goal was to investigate the effects of WP on glycemia comprehensively by using continuous glucose monitoring (CGM) while avoiding the confounding effects of variable food intake through controlled feeding.
Research design and methods This double-blinded and placebo (PL)-controlled study included 22 patients with T2DM patients (11 male, 11 female; age 57.1±12.6 years) on diet or metformin monotherapy. First, one serving (21 g) of WP was compared with PL in parallel-armed acute challenge studies. Next, in a crossover design, each patient underwent CGM twice, over 2 consecutive weeks, 3.5 days each week. Identical diets were provided by the study during both CGM periods. During the first CGM, one serving of either WP or PL was consumed before breakfast and another before dinner. During the second CGM, participants switched to the alternate supplement. Order of the supplements was randomized.
Results During acute challenge studies, WP stimulated insulin and glucagon-like peptide (GLP)-1 secretion; suppressed ghrelin (all p<0.05), while PL had no effect. During CGM, glucose response to WP varied depending on the baseline characteristics of the patients. When evaluated using linear regression, the most predictive baseline variables were body mass index (BMI) (p=0.0006), triglycerides (p=8.3×10⁻⁵) and GLP-1 (p=0.006). Lower BMI, triglyceride and GLP-1 predicted decreased glucose levels on WP. Obesity, hypertriglyceridemia and high fasting GLP-1 concentrations predicted increased glucose levels.
Conclusions Effects of WP supplementation on glycemia in T2DM depend on the baseline characteristics. Lower body weight, normal triglyceride and lower GLP-1 levels predict glucose lowering. In contrast, obesity, hypertriglyceridemia and high baseline GLP-1 predict increased glucose response.
- whey protein
- type 2 diabetes
- continuous glucose monitoring
This is an Open Access article distributed in accordance with the Creative Commons Attribution Non Commercial (CC BY-NC 4.0) license, which permits others to distribute, remix, adapt, build upon this work non-commercially, and license their derivative works on different terms, provided the original work is properly cited and the use is non-commercial. See: http://creativecommons.org/licenses/by-nc/4.0/
Statistics from Altmetric.com
Significance of this study
What is already known about this subject?
It is known that whey protein (WP) increases secretion of insulin and incretins acutely. It is not known however, whether WP supplementation can achieve sustained glucose lowering in patients with type 2 diabetes (T2DM).
What are the new findings?
This is the first study to investigate glucose response to WP using continuous glucose monitoring (CGM) over several days. Glucose response to WP was found to be variable but predictable. Lower body mass index, triglyceride and glucagon-like peptide (GLP)-1 predicted glucose lowering, whereas obesity, hypertriglyceridemia and high fasting GLP-1 concentrations predicted increased glucose response to WP.
How might these results change the focus of research or clinical practice ?
Practice implications are that WP supplementation may be tried to improve glycemic control in non-obese patients with T2DM with normal triglyceride and GLP-1 levels.
Research implications are that the mechanisms underlying the variability in glycemic response to WP need to be investigated further. Understanding of these mechanisms may be a step towards personalized medicine.
Introduction
Postprandial hyperglycemia is a significant determinant of overall glycemic control.1 2 Severity of postprandial hyperglycemia is influenced by the nutrient-stimulated secretion of insulin and incretins and the rate of gastric emptying. Protein intake before meals has been shown to reduce postprandial glycemia in type 2 diabetes (T2DM) by stimulating secretion of insulin and incretins as well as by delaying gastric emptying.3–7 Among different proteins, whey protein (WP) was found to be most efficacious probably because WP is rich in leucine and branched-chain amino acids which are potent insulin secretagogues.8 In addition, WP is rapidly absorbed and readily bioavailable.9 Based on the findings of the challenge studies, it has been proposed that WP may be used as a natural food supplement to lower glucose in T2DM.7 10 11
So far the majority of WP research in patients with T2DM focused on acute challenge studies or weight loss interventions.3–5 7 9 11–13 Varying doses of WP—sometimes relatively high doses—were tested.4–6 A study including seven patients with diabetes showed that WP stimulated incretin secretion and delayed gastric emptying during acute challenge tests, but there was no significant improvement in fructosamine over 4 weeks.13 It is possible that some of the effects of WP may negate its long-term benefit. For example, WP stimulates insulin and glucagon-like peptide (GLP)-1, and glucagon.7 Increased glucagon may interfere with the hypoglycemic effects of WP by increasing hepatic glucose output.14 Moreover, delayed gastric emptying can blunt the peak glucose right after a WP-containing meal, but may extend the duration of hyperglycemia and raise preprandial glucose levels before the subsequent meal. Thus, it is not sufficient to determine the effects of WP over a single meal.
We hypothesized that WP consumption before meals would reduce postprandial hyperglycemia and lower average glucose levels in patients with T2DM. The primary variable of interest was the average blood glucose level determined by continuous glucose monitoring (CGM). The secondary variables were the segmental glucose values during CGM. Dietary intake was controlled to eliminate confounding effects of variable food intake on blood glucose levels. Hence the changes in glucose levels could be attributed to WP supplement only. An identical tasting placebo (PL), without any hormonal effects, was used to assure blinding. Clinical and biochemical factors which can modify the glycemic response to WP were also investigated.
Research design and methods
Subjects
Twenty-two patients with T2DM (11 men and 11 women; 9 white, 4 African-American, 5 Asian, 1 Latino and 3 East Indian) either managed by diet alone or on metformin monotherapy, with glycosylated hemoglobin (HgBA1c) between 48–70 mmol/mol (6.5%–8.6%) were included after signing informed consent forms. The study was registered with Clinicaltrials.gov (NCT01925248). Patients who had any systemic disease (liver, renal, untreated hypothyroidism) or more than 5% weight change in the last 2 months, who smoked or consumed more than four servings of alcohol per week, who were on restricted diets, medications or herbals affecting insulin secretion/sensitivity were excluded. Clinical characteristics of the patients are shown in table 1. The median age was 60 years, the median body mass index (BMI) was 34.2 kg/m2 and the median HgBA1c was 51 mmol/mol (6.8%). All patients, except for one, were taking metformin.
Baseline clinical characteristics of study participants. For each variable, minimum, first quartile, median, third quartile and maximum values are presented. Numbers of missing values are noted
Consort statement
Four hundred and twelve patients were screened for eligibility using electronic medical records. One hundred and seven were eligible and invited to participate; 89 did not respond or declined. Eighteen patients were consented. In addition, 77 patients responded to newspaper or internet advertising. Fifty-four remained interested and were screened by phone; 40 patients failed phone screening. Fourteen patients were consented. Out of the 32 total consented patients, 8 failed clinical or laboratory screening; 1 patient changed her mind about participating. Twenty-three patients participated in CGM; 22 finished both weeks; 1 patient dropped out after 1 week. Eighteen of the 22 patients volunteered to participate in the supplement challenge tests.
Protocol
Eighteen patients underwent a challenge test (not crossover design). Twenty-two patients underwent CGM and controlled feeding twice (crossover design). All studies were double blinded. (WP) and PL were administered in random order. Since metformin does not influence insulin secretion, metformin therapy was continued. The studies were conducted after an overnight fast at the Clinical Research Center of UC Davis.
Acute challenge test
Published WP challenge studies were conducted with much higher doses of WP.9 Therefore, we wanted to prove that the smaller dose of WP used in the study was capable of inducing insulin and incretin responses, and in addition, the PL did not have independent effects on these hormones.
The acute challenge tests were carried out using a randomized two-arm design where the patients were assigned to consume a single serving of either WP or PL. An intravenous catheter was placed in the forearm. Blood samples were obtained at 0 min, 15 min, 30 min, 60 min and 120 min. The supplements were administered after the time 0 samples were obtained. Samples were collected in tubes containing glucose oxidase or, EDTA on ice, centrifuged at −4°C and stored at −80°C.
Both WP and PL were prepared by Glanbia, Twin Falls, Idaho, USA, specifically for this study. They contained either WP isolate (21 g protein, 3 g carbohydrate, 0.5 g fat: 100 kcal) or indigestible potato starch (PenFibe RS) (1 g protein, 25 g carbohydrate—20 g fiber—0.5 g fat: 35 kcal). They were packaged in identical appearing pouches which were identified only by a number. The products matched in taste, flavoring (chocolate) and texture. They were dissolved in equal volumes of cold water before ingestion.
Controlled feeding
Each subject was studied over two consecutive weeks. On both weeks, from Monday morning to Thursday afternoon, patients consumed only the food, snacks and beverages provided by the study. Identical menus were used on the corresponding days of the week (table 2). All the patients were provided the same menus. The goal was to prevent additional food intake from outside by providing adequate food. Patients were instructed to eat similar to their habitual intakes and return the remaining food. The returned food items were eliminated from the menu during the subsequent week to avoid week to week variability.
Nutrient analysis of the daily menus used for controlled feeding during continuous glucose monitoring
The supplements were administered using a double-blinded crossover design: 1 week WP, the other week PL. Administration order of the supplements was randomized. One serving of WP or PL was consumed before breakfast and another serving before dinner. The supplements were not added to the meals. In between the two study weeks (Friday through Sunday) participants ate their own self–selected diets.
Continuous glucose monitoring
On Monday morning of each week two Medtronic iPRO2 CGM sensors were inserted subcutaneously, one on each side of the abdomen. Two sensors were used to obtain complete data even if one of them failed during the study. The sensors were numbered and the same sensors were used in the same patient. The odd numbered sensor was placed on the right and was defined as the primary; the even numbered sensor was inserted on the left and was defined as the alternate. The recordings and the data from the primary sensor, unless they failed to meet the quality control criteria, were analyzed. As CGM measures glucose in the interstitial fluid, for calibration with the blood glucose, the participants monitored blood glucose three to four times a day using their glucometers. Patients were blinded to their glucose levels as iPRO2 CGM does not have a display or does not provide alarm for high or low glucose. The CGM sensors were removed on the following Thursdays.
The data from the sensors were downloaded to the Medtronics site (https://carelink.minimed.com/ipro/hcp/) and the following variables were determined: highest glucose, lowest glucose and average glucose; % time spent with glucose values >140 mg/dL (7.77 mmol/L), % time spent with glucose values between 70 mg/dL and 140 mg/dL (3.89 mmol/L and 7.77 mmol/L) and % time spent with glucose values <70 mg/dL (3.89 mmol/L); segmental glucose values (during sleep, before breakfast, after breakfast, before lunch, after lunch, before dinner, after dinner and evening).
Quality control measures for CGM
The records were assessed for adequate information and optimal accuracy. Sensors provide 288 glucose measures per 24 hours. Data from Mondays and Thursdays were excluded as they were partial days and provided fewer than 288 measurements. Accuracy of the recordings was assessed by reviewing the CGM reports generated by Medtronics (https://carelink.minimed.com/ipro/hcp/) which provides the mean absolute difference (MAD). This value expresses the average difference between the sensor and meter readings as percentage. The MAD value <28% is considered optimal.15 Average MAD was 7.2% during WP, and 7.7% during PL. Every recording had MAD <28% and no data had to be excluded.
Measurements
In all plasma samples glucose and lipids were measured using Beckman-Coulter DxC 800 chemistry analyzer with coefficient of variations (CVs) between 1.5% and 3.8%. Fructosamine was measured by quantitative spectrophotometry based on a colorimetric test reaction with nitroblue tetrazolium with CV of 1.9% (Roche Diagnostics, Indianapolis, Indiana, USA). HgBA1c was determined using boronate affinity chromatography with CV of 1%–3%. Insulin was measured using the Abbott Architect i1000 chemiluminescent immunoassay analyzer with CV of 2%. Total GLP-1 and ghrelin were measured by ELISA (Millipore, Billerica, Massachusetts, USA) with CVs of 3% and 2%, respectively.
Statistical analysis
For the baseline data, the summary statistics in the form of minimum, first quartile, median, third quartile, maximum, mean and SEM, as well as Pearson correlations were calculated. Each correlation was separately computed from observations for which neither variable was missing.
For the acute challenge tests, insulin and ghrelin were analyzed on the log scale; GLP-1 was analyzed on the square root scale. The analysis was performed with the lmer function in the lme4 R package.16 For each variable, a mixed model was fit with random effects per patient and fixed effects of treatment, time, and the treatment by time interaction. The main statistical tests were for a change in the variable from baseline in the WP group compared with the change in the PL group. There was an overall likelihood ratio test of whether any such changes had occurred and a Wald test for each biomarker at each time.
For the CGM, the data obtained on Tuesday and Wednesday of each week were included in analysis.CGM provided a series of daily summary measurements for glucose including highest, lowest, average, % time spent with glucose >140 mg/dL (7.8 mmol/L), between 70 mg/dL and 140 mg/dL (3.9 mmol/L and 7.7 mmol/L), glucose concentrations before lunch, after lunch, before dinner, after dinner, evening, and all-time average. These glucose levels depend on the individual patient, the supplement provided that week, sequence of the supplement, and may possibly be influenced by the baseline variables. This was operationalized in a linear regression model with response equal to one of the blood glucose measurements and with predictors for subject, treatment, day, and interaction of baseline variables with treatment (there can be no main effect of baseline variables since they are the same for each subject).16 The most informative and most comprehensive CGM variable was the all-time average glucose.
Results
Baseline variables
Baseline characteristics of the patients are summarized in table 1. As a group, patients were obese (median BMI=34.2 kg/m2) and insulin resistant (median HOMA: 4.1) but had relatively good glycemic control (median HgBA1c 6.8% or 51 mmol/mol).
Relationships among baseline variables
Significant (p<0.05) correlations included the inverse correlations between BMI and fructosamine (r=−0.59); HgBA1c and ghrelin (r=−0.48); and direct correlations between fasting GLP-1 and insulin (r=0.52), glucose (r=0.50) and HOMA (r=0.67).
Acute supplement challenge test results
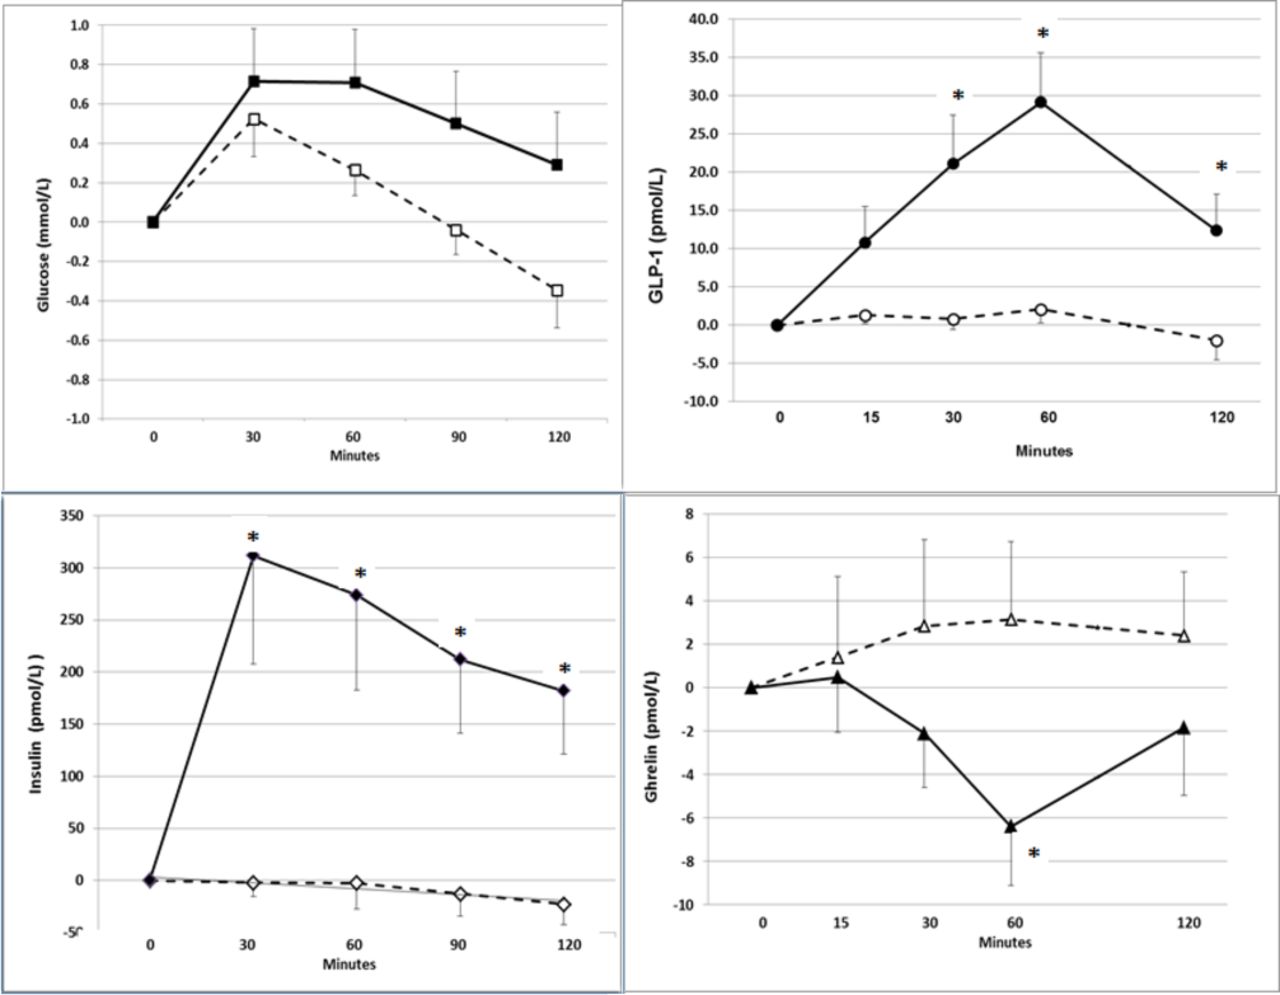
Glucose response
Both WP and PL caused small increases in glucose at 30 min at 60 min (figure 1). There was no difference between the effects of WP versus PL on glucose (p=0.097). Mean±SEM baseline glucose concentrations were 7.22±0.37 mmol/L in the WP group and 7.55±0.58 mmol/L in the PL group. Changes in glucose from the baseline at 30 min were 0.72±0.19 mmol/L in WP versus 0.50±0.27 mmol/L in PL; at 60 min 0.72±0.13 mmol/L in WP versus 0.28±0.27 mmol/L in PL groups.

Changes (mean +SEM) in glucose, insulin, glucagon-like peptide (GLP)-1 and ghrelin from the baseline values after administration of placebo (broken lines and open markings) or whey protein (solid lines and filled markings) during acute challenge tests.
Insulin response
The changes in insulin concentration by time were highly significant (p=6×10⁻⁷). Insulin changes from the baseline in the WP group were higher as compared with the PL group at all time points.
In the WP group mean baseline insulin was 90.4±18.6 pmol/L; insulin increased by 311±104 pmol/L at 30 min, 273±91 pmol/L at 60 min, and 182±61 pmol/L at 120 min. In the PL group, baseline insulin was 87.5±7.2 pmol/L; insulin decreased by −2±13 pmol/L in 30 min and −23±19 pmol/L in 120 min. The increase in insulin in response to WP did not correlate with BMI (r = −0.038, p=0.921).
GLP-1 response
The changes in GLP-1 concentration by time were also highly significant (p=2×10⁻⁵). Changes from the baseline were higher in the WP group compared with the PL group at 30 min (p=4×10⁻⁴), at 60 min (p=5×10⁻⁷) and at 120 min (p=0.0024) but not at 15 min (p=0.074).
In the WP group mean baseline GLP-1 was 29.7±5.6 pmol/L. Changes from the baseline in GLP-1 were 21.1±6.4 pmol/L at 30 min; 29.1±6.5 pmol/L at 60 min, and 12.3±4.7 pmol/L at 120 min. In the PL group mean baseline GLP-1 was 38.9±11.9 pmol/L, and the changes from baseline were 0.8±1.4 pmol/L at 30 min; 2.1±1.8 pmol/L at 60 min and −2.3±2.6 pmol/L at 120 min. Per cent increase in GLP-1 in response to WP did not correlate with BMI significantly (r=−0.526, p=0.15).
Ghrelin response
Overall changes in ghrelin were significant (p=0.014). Mean baseline ghrelin concentrations were 58.3±4.8 pmol/L in the PL group and 62.4±9.7 pmol/L in the WP group. Ghrelin concentrations decreased significantly in the WP group as compared with the PL group at 60 min (−6.4±8.3 pmol/L vs 3.4±4.1 pmol/L, p=0.0013), but not at 15 min (0.5±8.4 pmol/L vs 1.4±12.4 pmol/L, p=0.49), 30 min (−2.1±8.3 pmol/L vs 2.8±13.3 pmol/L, p=0.061) or 120 min (−1.8±10.4 pmol/L vs 2.4±9.7 pmol/L, p=0.080). Per cent decrease in ghrelin did not correlate with BMI significantly (r=−0.480, p=0.191).
Controlled feeding and CGM results
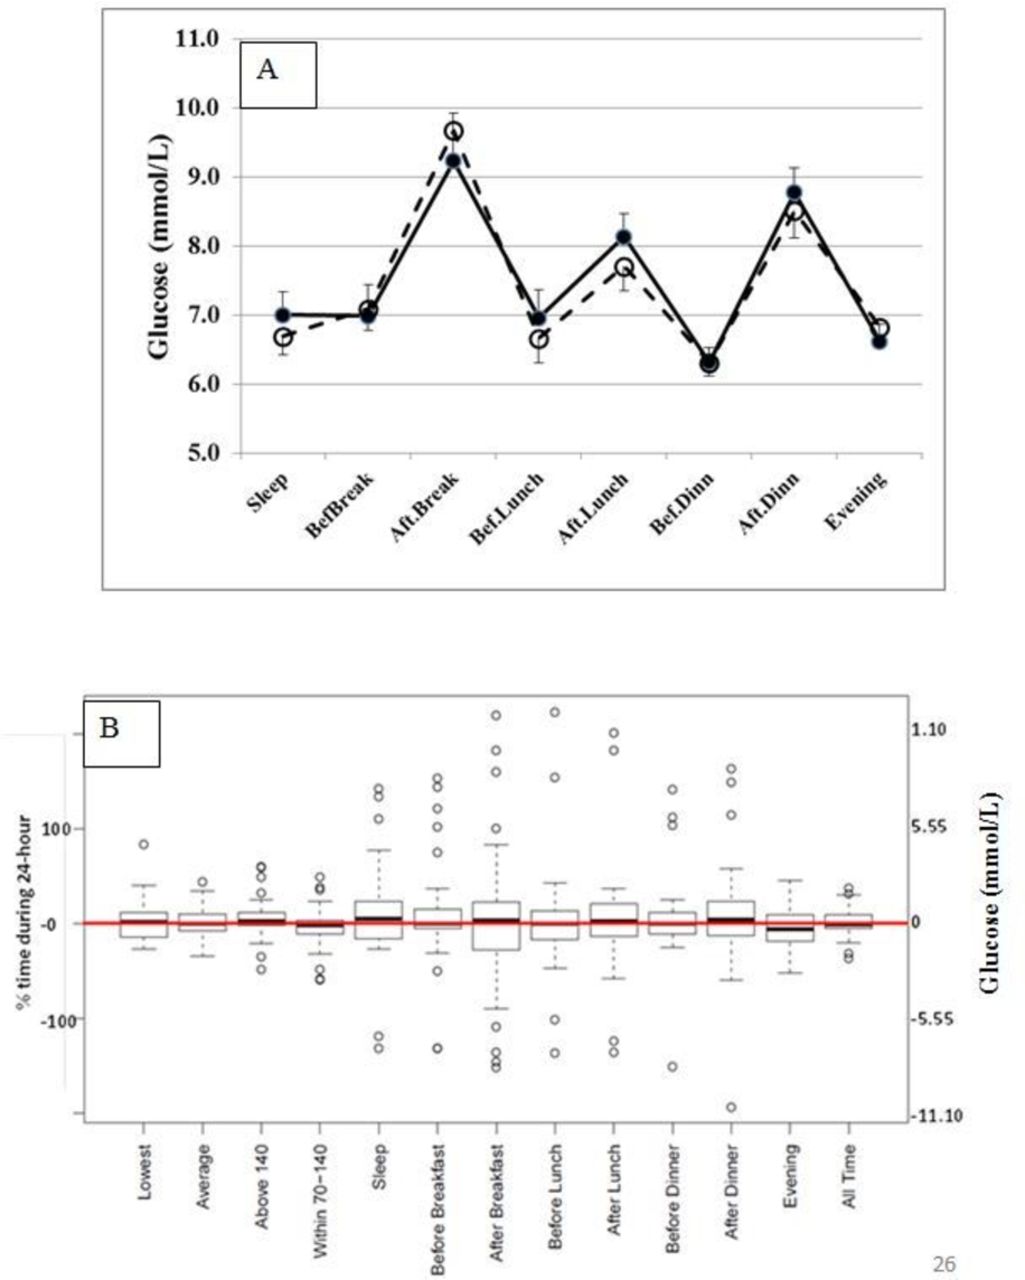
Glucose variables over two full days (Tuesday and Wednesday) were compared while consuming WP versus PL. The values from Mondays and Thursdays were excluded because those were not full days. There were no significant differences in average glucose values (figure 2A) or in glucose variability (SD for 24 hours glucose values: 25.4% in WP vs 24.3% in PL, p=0.603). However, glucose response to WP varied among individuals (figure 2B). For example, when glucose values on WP were compared with the glucose values on PL, changes in the ‘highest glucose’ ranged from a decrease of −5.93 mmol/L to an increase of 5.16 mmol/L; and changes in the 'average glucose’ ranged from a decrease of −1.94 mmol/L to an increase of 2.44 mmol/L. Similar variability was observed in other CGM parameters as well.

(A) Glucose values (mean +SEM) during continuous glucose monitoring while consuming whey protein (solid lines and filled circles) or placebo (broken lines and open circles). (B) Changes in glucose parameters during continuous monitoring when whey protein is substituted for placebo.
Anticipated effects of substitution of whey protein for placebo on glucose parameters during continuous glucose monitoring (CGM) for patients who belong to the first quartile (clear cells) and third quartile (shaded cells) of body mass index (BMI), triglycerides and glucagon-like peptide (GLP)
When evaluated using linear regression, factoring in all the CGM variables, WP sequence, day of the week, and interactions between WP and baseline variables in individual patients, it was found that glucose responses to WP were contingent on the patients’ baseline characteristics. The most predictive variables were BMI (p=0.0006), triglycerides (p=8.3×10⁻⁵) and GLP-1 (p=0.006), while fasting glucose, insulin or HOMA was not predictive. The day effect (Tuesday vs Wednesday) and the supplement-sequence effect (first vs second) were not significant either.
For further interpretation, patients at the lowest quartile and the third quartile of BMI (28 vs 37 kg/m2), triglyceride (1.05 mmol/L vs 2.13 mmol/L) and GLP-1 (14.4 mmol/L vs 42.9 pmol/L) were considered. The estimated changes in CGM glucose variables, when WP is substituted for PL, were calculated using the regression model (table 3). These calculations showed that a patient who is in the first quartiles of BMI, triglyceride and GLP-1 would have the following decreases in glucose values: −0.92 mmol/L in the average; −0.75 mmol/L during sleep and −1.32 mmol/L during the evening. In contrast, a patient who is in the third quartiles of BMI, triglyceride and GLP-1 would have the following increases in glucose values: 0.57 mmol/L in average; 1.72 mmol/L during sleep and 0.15 mmol/L during the evening.
Discussion
Based on the results of the WP challenge studies in the literature, we expected WP to lower glucose levels in all of our patients. This study demonstrated for the first time that the baseline clinical characteristics of the patients with T2DM modified the glycemic response to WP. Patients with lower BMI, fasting triglyceride and GLP-1 were likely to have glucose lowering. In contrast, patients with obesity, hypertriglyceridemia and higher fasting GLP-1 were likely to develop hyperglycemia.
The study design differed from the published reports in several aspects: It used a smaller dose of WP; monitored glucose levels over days, every 5 min, 288 times/day. It employed controlled feeding to avoid confounding effects of food intake, and used an inert PL which had no effects on insulin or incretin secretion.
Several challenge studies reported that WP acutely stimulates insulin and incretins and delays gastric emptying.4 5 7 17–21 The majority of these administered 45 g to 55 g of WP as a single dose. Because long-term high protein intake may affect kidney function adversely in diabetes,22 we investigated a smaller dose of WP. We showed that 21 g WP effectively increased insulin and GLP-1 and suppressed ghrelin. As importantly, PL was inert and did not affect these hormones.
Even though the acute WP challenge studies reported consistent decreases in blood glucose,3–6 23 a closer look at the literature indicates that these studies recruited only non-obese patients with BMIs ranging between 26.2 kg/m2 and 28.2 kg/m2. This weight range corresponds to our patients in the first quartile of the BMI. Our findings agree that this quartile of patients is likely to benefit from WP, as shown on table 3.
The majority of the published acute challenge studies measured incretin response to glucose; only a handful reports determined the response to protein. It was shown that incremental GLP-1 response to oral glucose was blunted in T2DM and obesity.24 25 Dietary weight loss could not restore the incremental GLP-1 response.26 It is not yet known whether T2DM and/or obesity blunt incremental GLP-1 response to protein challenge as well. If obese patients with diabetes exhibit less incremental increase in GLP-1 when challenged with WP, this would explain the negative effect of BMI on CGM-glucose during WP supplementation. During our WP challenge studies, per cent increase in GLP-1 appeared to correlate inversely with BMI (r=−0.526, p=0.15) suggesting that obese patients may have smaller incremental increase in GLP-1 in response to WP. However this correlation was not significant, possibly because of the small sample size.
Several mechanisms may contribute to the hyperglycemic effects of WP. One explanation may be stimulation of glucagon secretion. It is well recognized that WP stimulates glucagon acutely in healthy subjects19 as well as patients with T2DM.23 Glucagon rapidly mobilizes glucose from hepatic glycogen stores. Moreover hypertriglyceridemia augments the hyperglycemic effects of glucagon.27 This could explain the relationship between hypertriglyceridemia and hyperglycemic response to WP seen in our study.
Another explanation may be the changes in plasma amino acid metabolites. Growing evidence supports that elevated plasma concentrations of branched chain amino acids (leucine, isoleucine, and valine), other hydrophobic amino acids including alanine, and the aromatic amino acids (phenylalanine and tyrosine) are associated with increased risk for T2DM.28 29 These amino acids constitute approximately 30% of WP.8 Hence WP intake may increase the amino acids which cause insulin resistance in the circulation.
Adverse effects of hypertriglyceridemia on glucose response to WP may be explained by the experimental evidence showing modulatory effects of fatty acids. In animal studies, branched chain amino acids increased insulin resistance only when fed along with a high-fat diet.30 The underlying mechanism is that delivery of excess fatty acids along with branched chain amino acids to the mitochondria interferes with glucose utilization.30 31 In an earlier study we had demonstrated that polyunsaturated fatty acids (3 g/day) alter plasma amino acids and their metabolism in humans.32 Endogenous hypertriglyceridemia also increases fatty acid delivery to mitochondria. Therefore, patients with hypertriglyceridemia may develop mitochondrial dysfunction when exposed to the excess branched chain and essential amino acids supplied by WP.
Previously we had demonstrated that insulin resistance correlated with plasma leucine, isoleucine and valine in obese women with metabolic syndrome, and weight loss abolished these correlations.33 Moreover, WP supplementation (20 g/day) did not cause insulin resistance during weight loss. Potent effects of weight loss masked the differences in protein intake. This may explain why the weight loss studies in the literature did not show increase in glucose during WP supplementation.9
The correlations observed between BMI and fructosamine,34 between ghrelin and HgBA1c,35 and between GLP-1 and insulin and GLP-1 and glucose36 were consistent with previously published reports.
In summary, this study identified the baseline clinical characteristics which can modify the glycemic response to WP in patients with T2DM. The strengths of the study were that food intake was controlled and weight was stable; therefore, changes in glucose could be attributed directly to the supplements. The PL was inert and did not have any independent effects on insulin or incretins, and therefore did not confound the results. The CGM permitted detailed analysis of the glucose response patterns over days, after meals and during fasting. The weaknesses were that the acute challenge studies were not crossover and glucagon was not measured. Consequently, it was not possible to compare the acute insulin, incretin or glucagon responses to the longer-term glucose changes seen during CGM. In addition, the small sample size of the acute challenge studies did not allow subgroup analysis. Finally, even though the food intake was unchanged during the WP and PL phases of CGM, the controlled feeding was not adjusted to patients’ habitual energy intakes or basal metabolic rates.
In conclusion, the study findings suggest that WP can lower blood glucose in T2DM. However, obesity, hypertriglyceridemia and high baseline GLP-1 levels predict poor response to WP. This novel information may help to individualize our recommendations. Further investigation of the underlying mechanisms, such as the effects of WP on gut microbiota and plasma metabolites, is essential to understand the interindividual variability in glycemic response to different nutrients and proteins.
References
Footnotes
Contributors RUA conducted clinical studies, organized data. WMB designed the controlled feeding menus. DMR planned and carried out the statistical analysis of the data and contributed to the writing and editing of the manuscript. SEK designed the study, supervised the clinical studies and laboratory assays, facilitated collaborations and contributed to data analysis. SEK prepared the manuscript with contributions from all the coauthors. All authors have read and approved the final version of the manuscript. SEK has the primary responsibility for the final content of the article.
Funding The study was supported by a grant from the California Dairy Research Foundation to the University of California, Davis, for SEK. The clinical studies were also partly supported by the National Center for Advancing Translational Sciences (NCATS), National Institutes of Health (NIH), through grant #UL1 TR000002. Whey protein and placebo were produced and donated by Glanbia Nutritionals, Twin Falls, Idaho, USA.
Competing interests None declared.
Patient consent Obtained.
Ethics approval Insitutional Review Board (IRB) of the University of California Davis which complies with the Helsinki Declaration as revised in 1983.
Provenance and peer review Not commissioned; externally peer reviewed.
Data sharing statement This manuscript includes all the data available.